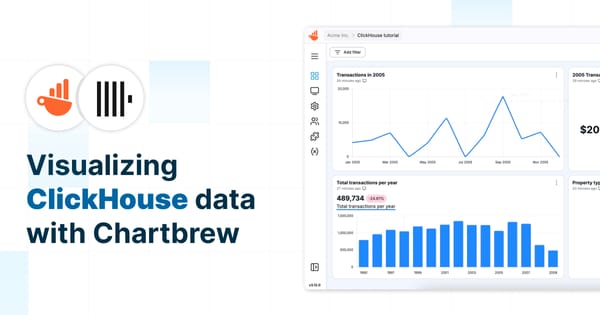
integration Visualizing ClickHouse Data with Chartbrew: A Step-by-Step Guide Learn how to connect ClickHouse to Chartbrew, write SQL queries, and build dynamic charts. This guide walks you through setting up a data source, creating datasets, and automating updates for real-time insights.
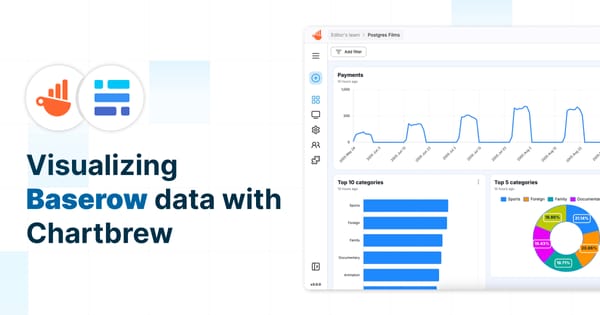
tutorial Visualizing Baserow data with Chartbrew Learn how to visualize Baserow data in Chartbrew with this step-by-step guide. From setting up an API connection to configuring datasets, handling pagination, and creating interactive charts, this tutorial will help you build a Baserow dashboard effortlessly.
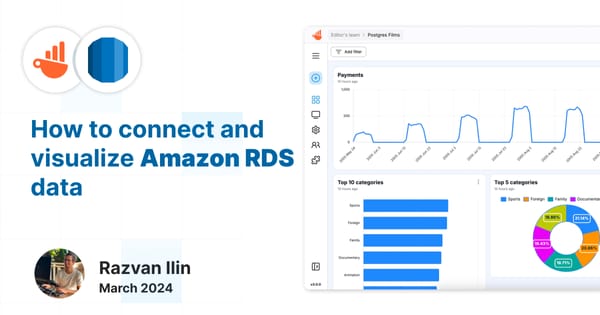
integration How to connect and visualize Amazon RDS data with Chartbrew In this tutorial, we'll guide you through the steps to connect your Amazon RDS databases, specifically Postgres and MySQL, with Chartbrew
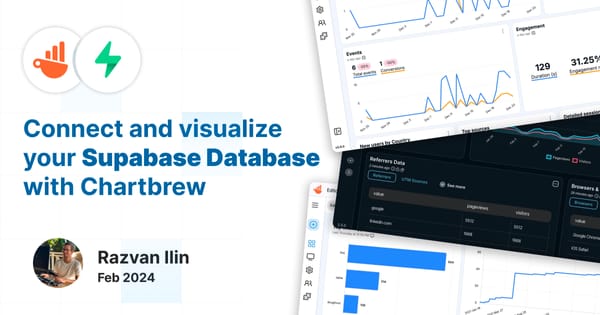
integration Featured Connect and visualize your Supabase Database with Chartbrew This tutorial shows you how to connect, query, and visualize your Supabase database with Chartbrew. Create Supabase client reports with ease.
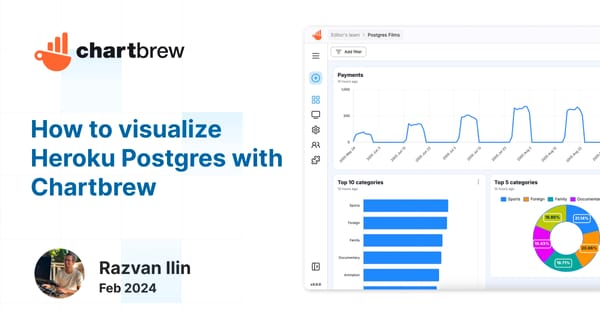
integration Featured How to visualize Heroku Postgres data with Chartbrew In this tutorial, we are going to connect Heroku Postgres to Chartbrew, fetch some data, and create charts to visualize our data.
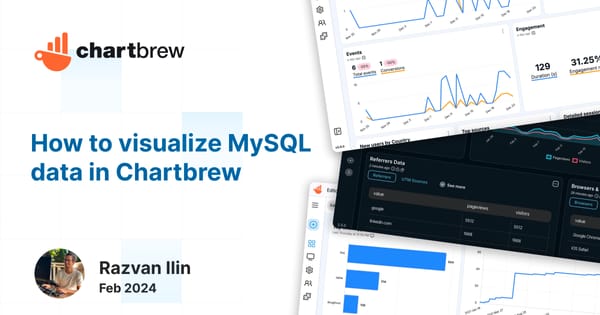
tutorial Visualize MySQL data with Chartbrew In this short tutorial, we will show how you can connect any MySQL database to Chartbrew. Once we connect the database, we are going to write a few simple queries to fetch some data and create datasets to be visualized in multiple ways.
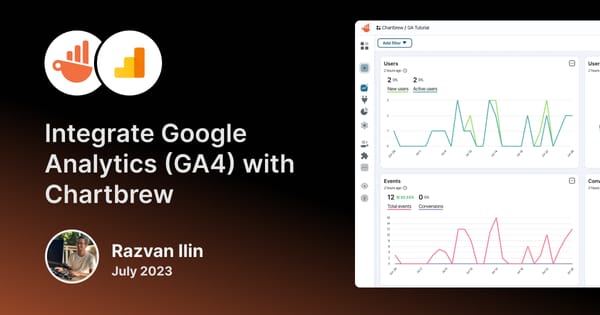
integration Integrate Google Analytics (GA4) with your Chartbrew dashboards Integrate Google Analytics (GA4) with your Chartbrew dashboards and use our advanced query builder and chart editor to get the most out of your data.
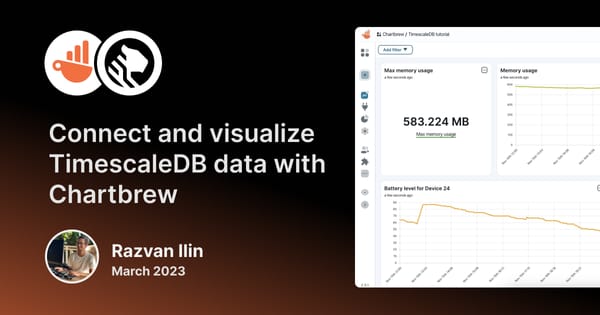
integration Connect and visualize TimescaleDB data with Chartbrew Learn how to connect Timescale databases to Chartbrew and create powerful visualization dashboards and reports to monitor and share with others.
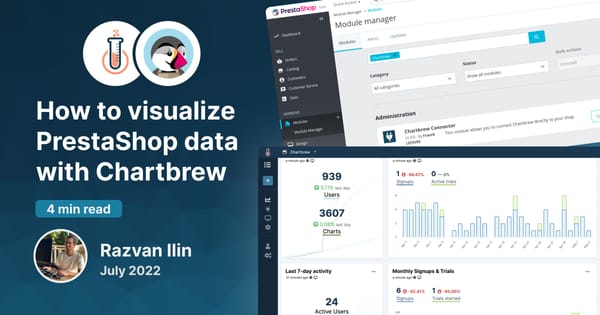
tutorial How to visualize PrestaShop data with Chartbrew Learn how to create charts and visualize your PrestaShop data to make better business decisions.
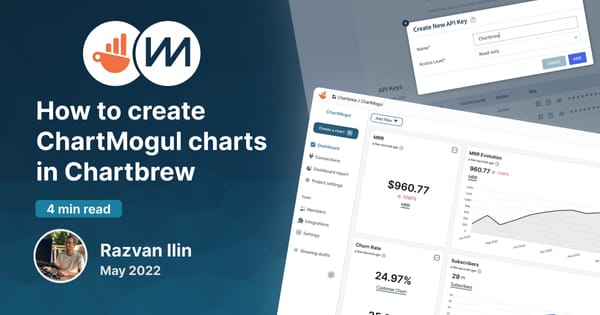
tutorial How to create ChartMogul charts in Chartbrew Chartbrew offers a ChartMogul dashboard template that can be used to create charts almost instantly. This tutorial will show you how to get started.
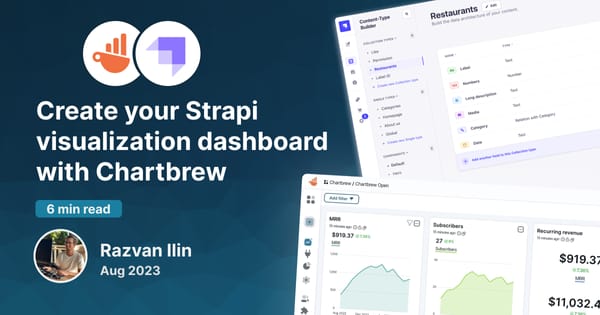
tutorial Create your Strapi visualization dashboard with Chartbrew Strapi is a headless content management system used by many businesses worldwide. Chartbrew can connect to its API to visualize and monitor data
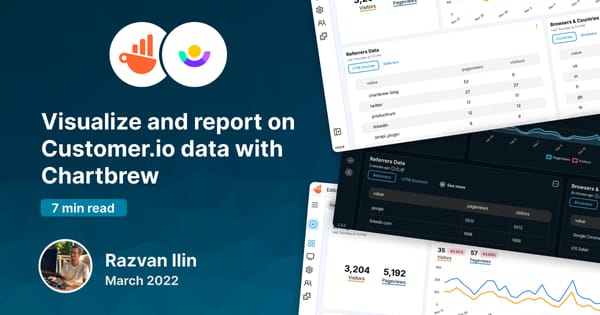
tutorial Visualize and report on Customer.io data with Chartbrew Customer.io is the perfect messaging platform to keep users engaged with your product. Chartbrew can now integrate with Customer.io to get data about customers and visualize it with beautiful charts and live reports.
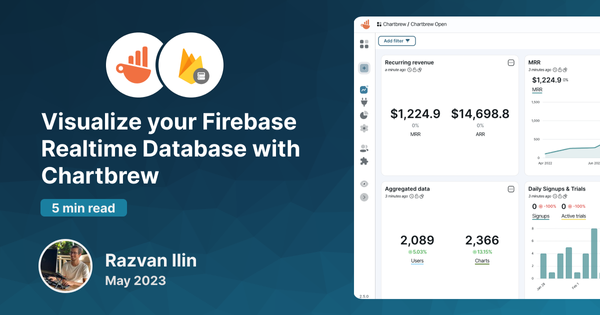
tutorial Visualize your Firebase Realtime Database with Chartbrew Connect to Firebase Realtime Database to create reports and visualize your data. This tutorial will show you how to connect and create your first chart.
tutorial Create your Google Analytics dashboard in Chartbrew Learn how you can power up your Chartbrew dashboards with the Google Analytics integration. Get to know your data with Chartbrew.
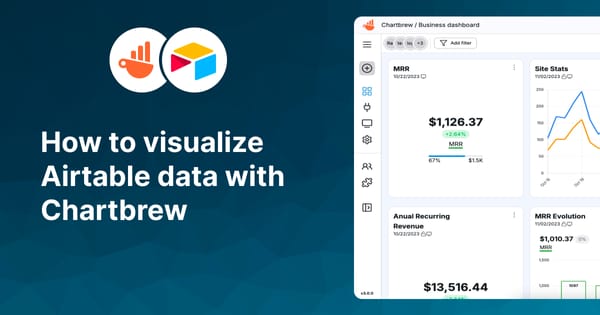
tutorial How to visualize Airtable data with Chartbrew Learn how to visualize Airtable data with Chartbrew. Create KPIs and other Airtable charts using Chartbrew's extended set of features.
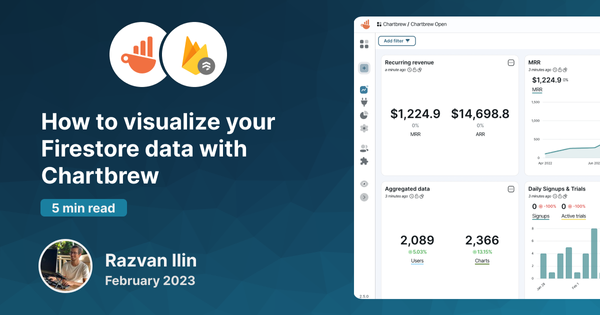
integration Featured How to visualize your Firestore data with Chartbrew Connect, query, and visualize your Firestore data with Chartbrew. A step-by-step tutorial on how you can start creating your insightful dashboard.
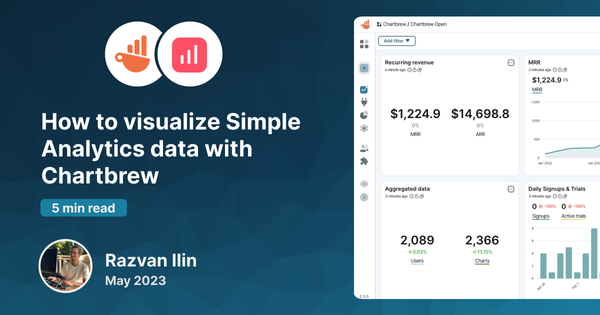
tutorial How to visualize Simple Analytics data with Chartbrew In this tutorial, we are going to connect Simple Analytics' API, get different datasets, and create a dashboard in Chartbrew to show all this data.
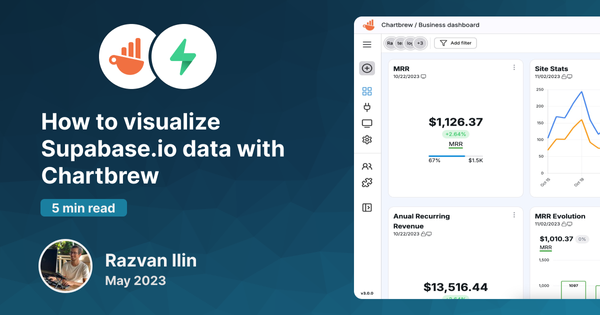
tutorial How to visualize Supabase.io data with Chartbrew Supabase.io makes it easy to create your database. In this tutorial, we will go through visualizing this data with Chartbrew just as easily.
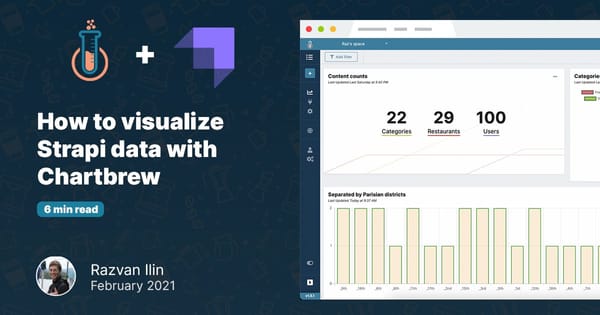
tutorial How to visualize Strapi data with Chartbrew In this tutorial, we are going to learn how to visualize the data stored with Strapi. For the visualization, we are going to use Chartbrew, an open-source visualization platform.
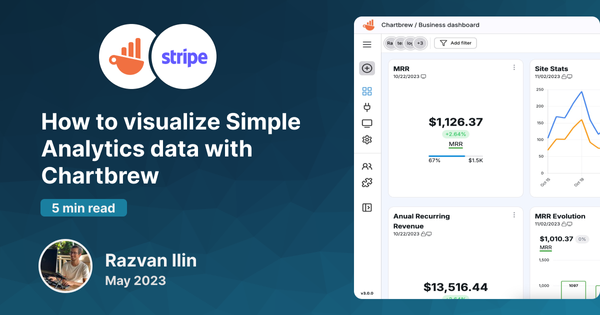
tutorial How to create a Stripe dashboard in Chartbrew Revenue data contains some of the most important KPIs for businesses. Chartbrew supports Stripe API connections allowing everyone to visualize their Stripe data. This post will show you how to connect to the API and what data you can pull from Stripe.
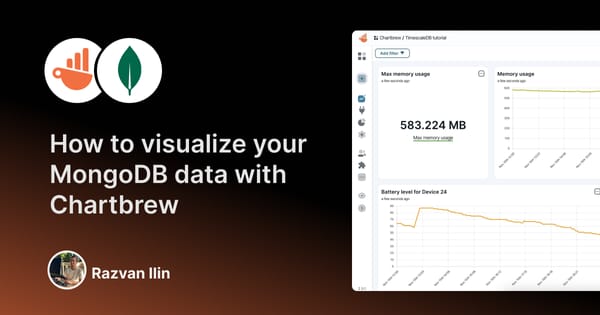
tutorial Featured How to visualize your MongoDB data with Chartbrew Chartbrew is an open source visualization platform where you can pull data from different sources and create insightful dashboards. With Chartbrew you can connect to your MongoDB database and create charts that tell you more about your data.
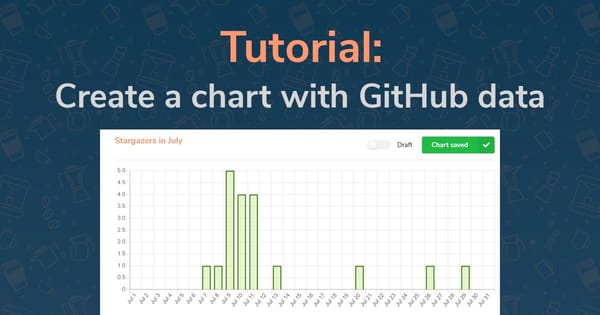
tutorial Creating a time series chart from API data - Tutorial In this tutorial we are going to create a time series chart showing how many stars Chartbrew's GitHub repository accumulated in July 2020.