
In this tutorial, we are going to connect Heroku Postgres to Chartbrew, fetch some data, and create charts to visualize our data. The data comes from a sample database called "Sakila" and you can find it here.
Setting up
For this tutorial, you will need a Chartbrew account or a self-hosted instance if you are using the open-source project.
The database we are going to connect to is hosted on Heroku and it can be attached as an add-on to your Heroku application.
https://devcenter.heroku.com/categories/heroku-postgres
You can use your database or if you want to follow the tutorial with the same, data, you can find the sample database at https://github.com/jOOQ/sakila/tree/main/postgres-sakila-db
Once you have the database set up locally, you can push it to Heroku:
heroku pg:push mylocaldb DATABASE_URL --app example-app
Connecting Heroku Postgres to Chartbrew
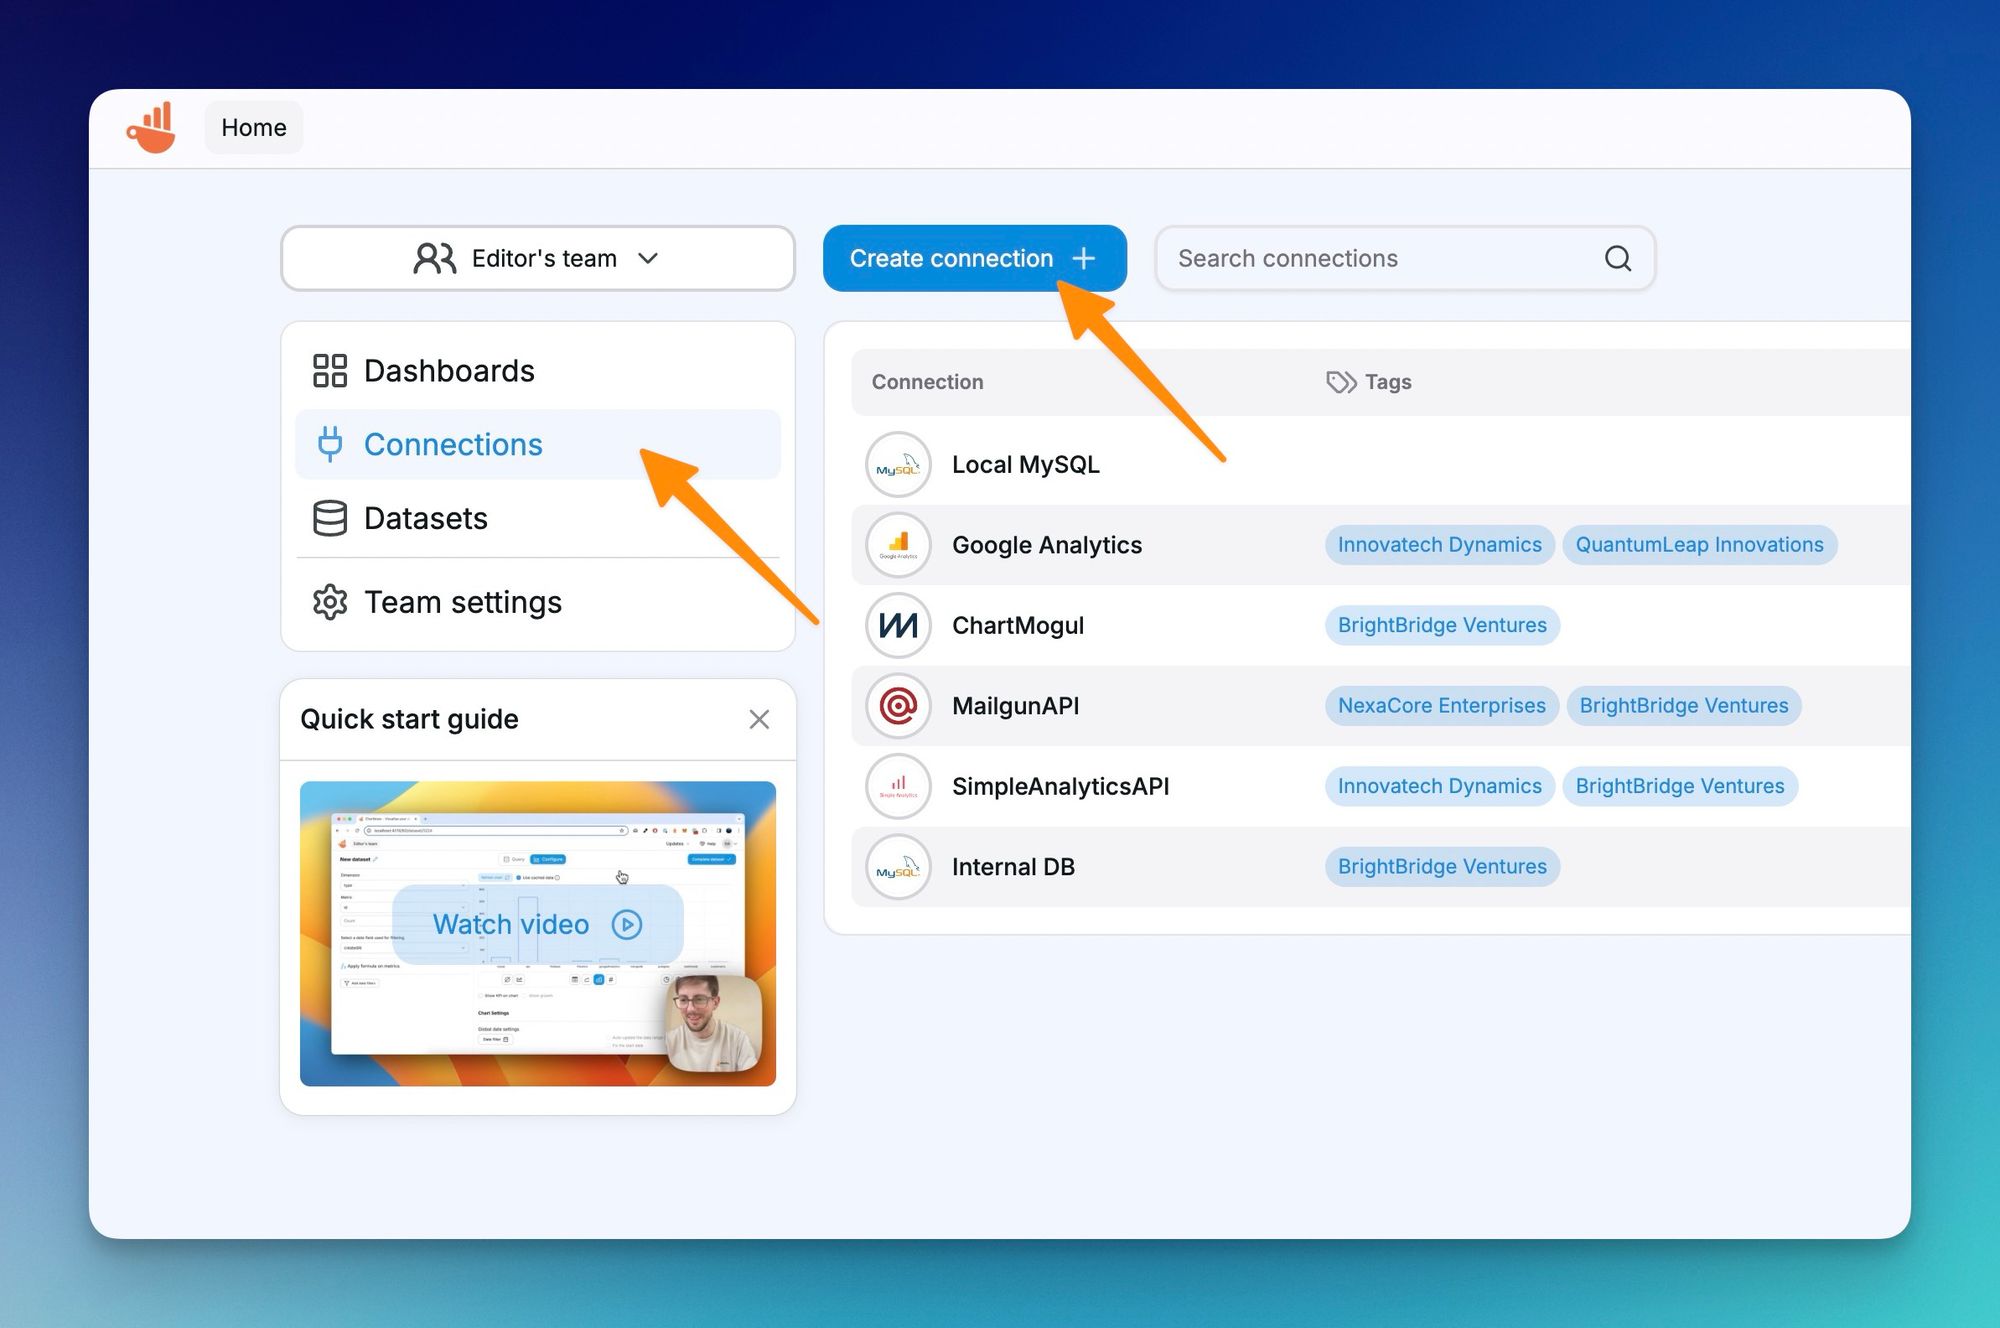
Let's start with Chartbrew and create a new Postgres connection. From your homepage, click on the Connections menu and then Create Connection.
Next up, we will need to get the Postgres database credentials from Heroku. If you use a production database, it is recommended to connect with a read-only user. You can find out more about how to manage credentials on Heroku in the link below:
Heroku Postgres Credentials | Heroku Dev Center
Postgres manages database access permissions using the concept of ‘roles.’ Heroku Postgres provides a management layer around these roles, called credentials, that are tightly integrated with the rest of the Heroku platform.
Heroku Dev Center
And more specifically, on how to create read-only credentials:
Heroku Postgres Credentials | Heroku Dev Center
Postgres manages database access permissions using the concept of ‘roles.’ Heroku Postgres provides a management layer around these roles, called credentials, that are tightly integrated with the rest of the Heroku platform.
Heroku Dev Center
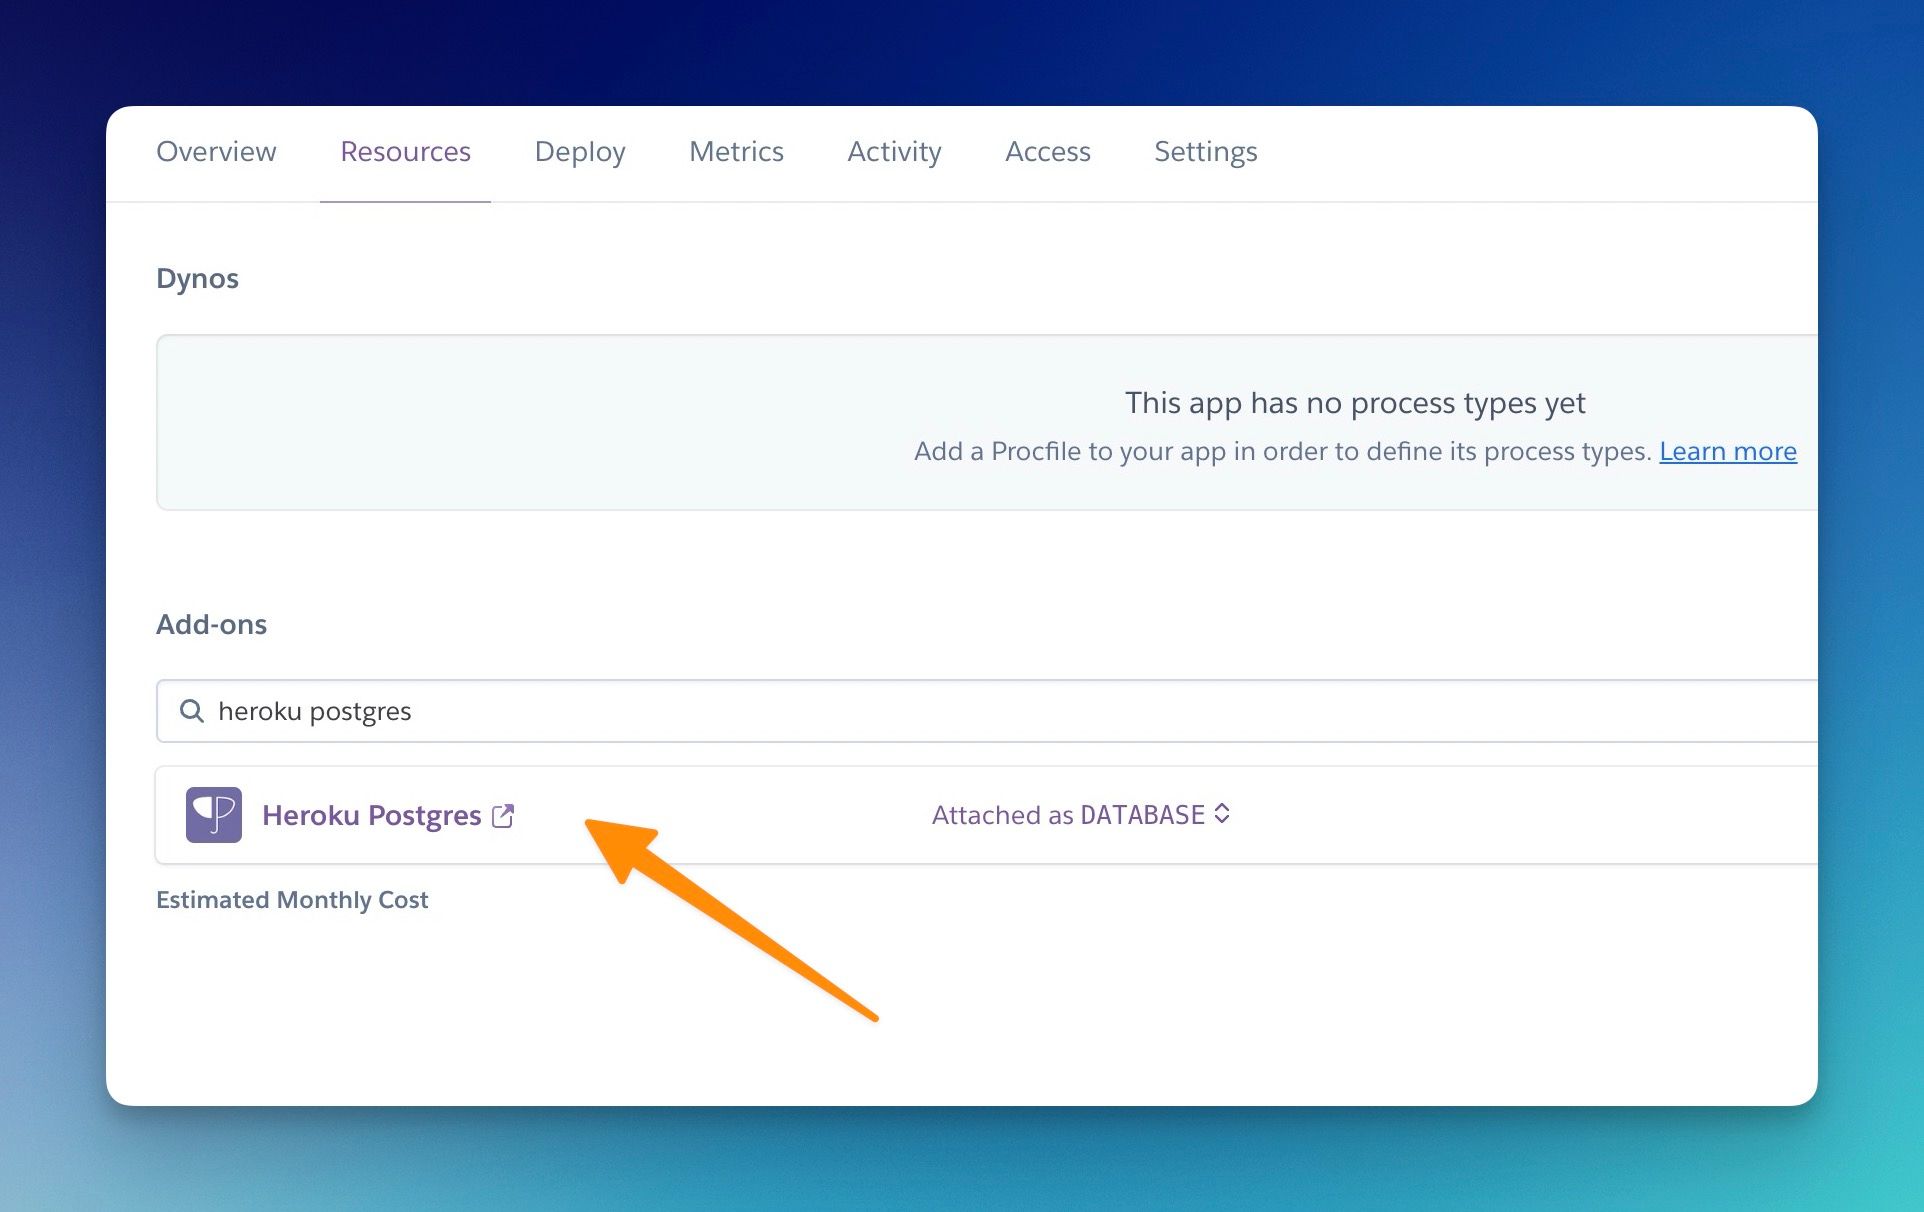
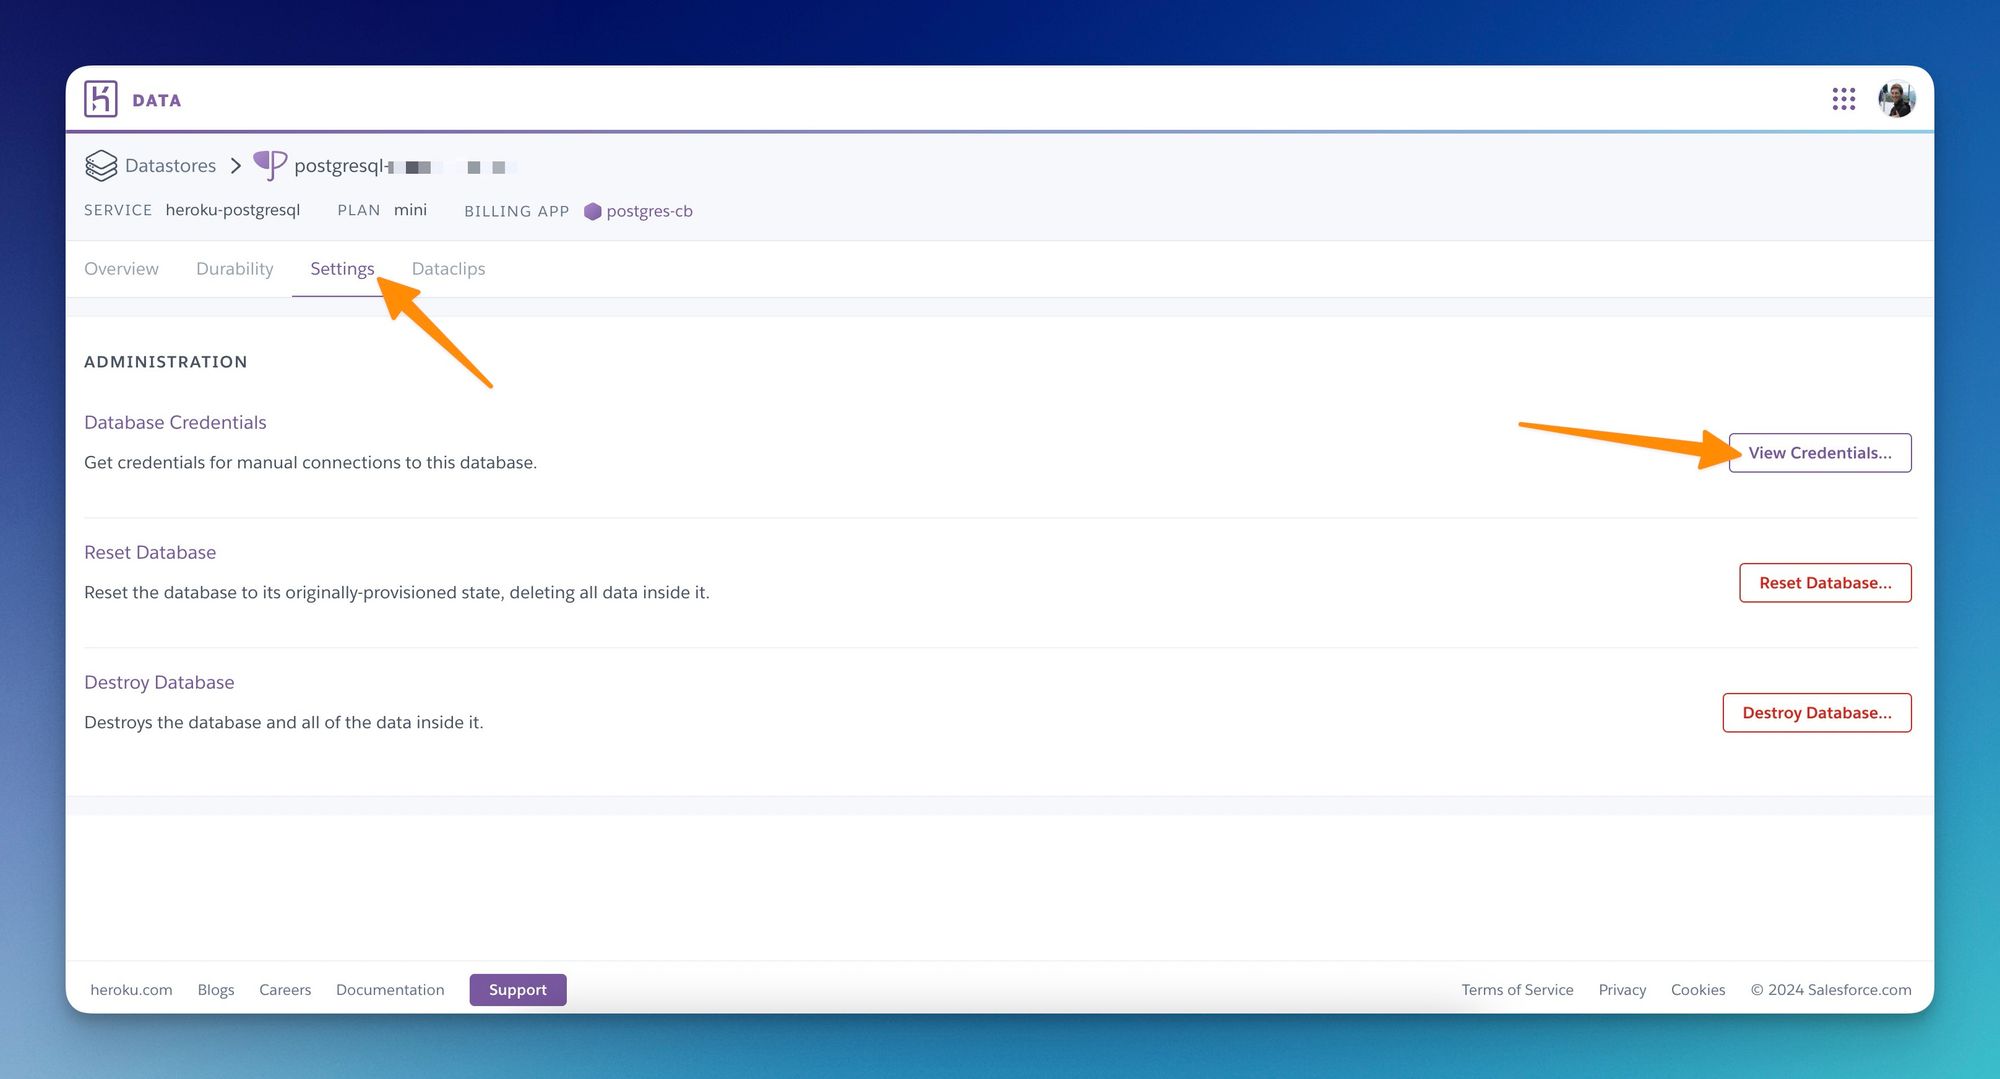
If you just want to test the integration with a sample database, you can get the main credentials from the Heroku Postgres settings page, but please be aware that these credentials have Write Access to your data. Click on the Postgres add-on from your Heroku dashboard and head over to the credentials page.
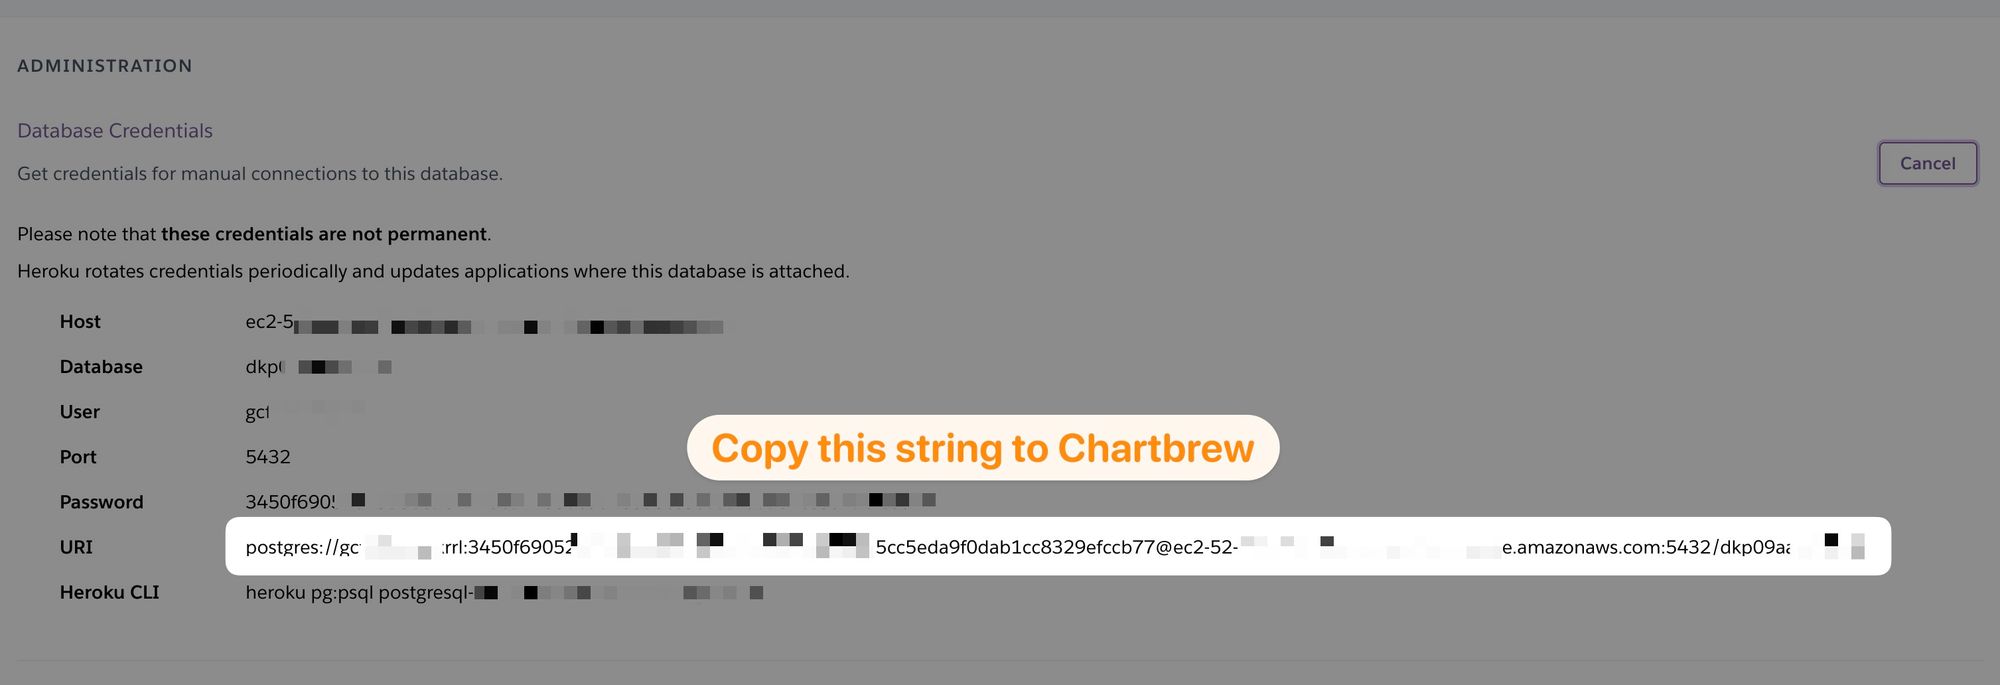
Copy the entire URI from the credentials page and we will then use this to connect to the database from Chartbrew. Back to the connection form, enter a name for your connection, paste the URI string in the connection string input, and enable the SSL connection.
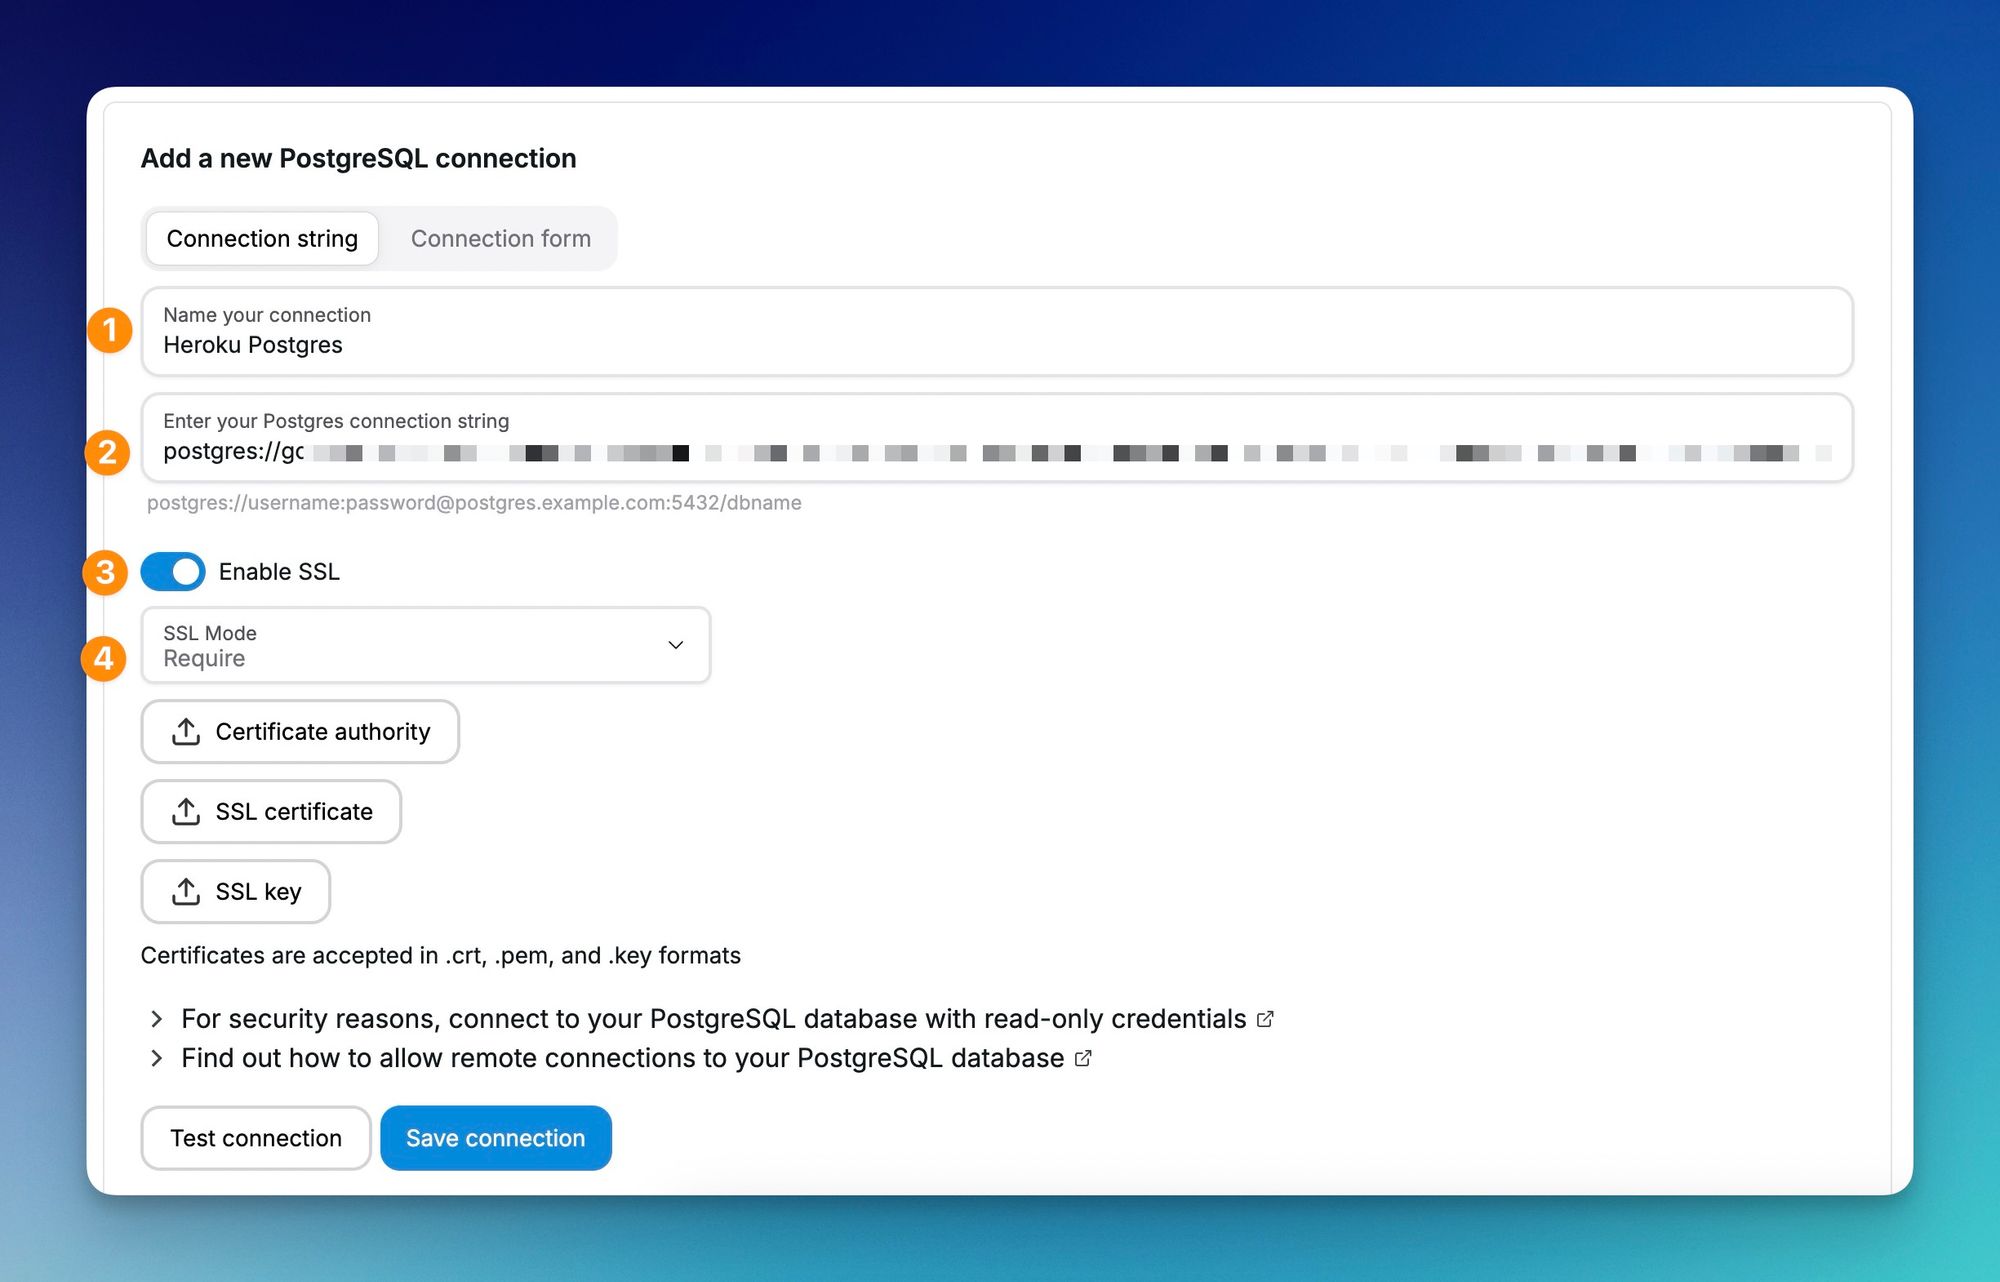
Once you enter all the information like in the screenshot above, you can click on the Test connection button to check if everything works. If the connection works, you will see a list of tables available in your database. All good? You can press Save Connection.
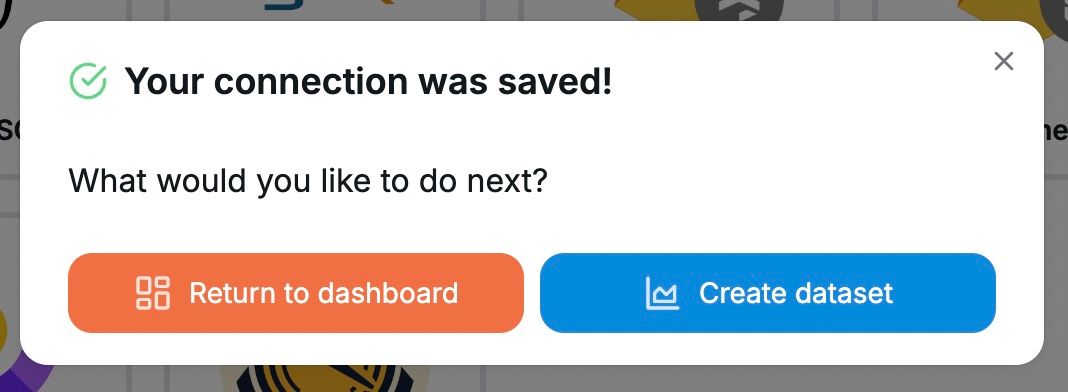
Press Create dataset and let's prepare our first query.
Creating a dataset from Postgres data
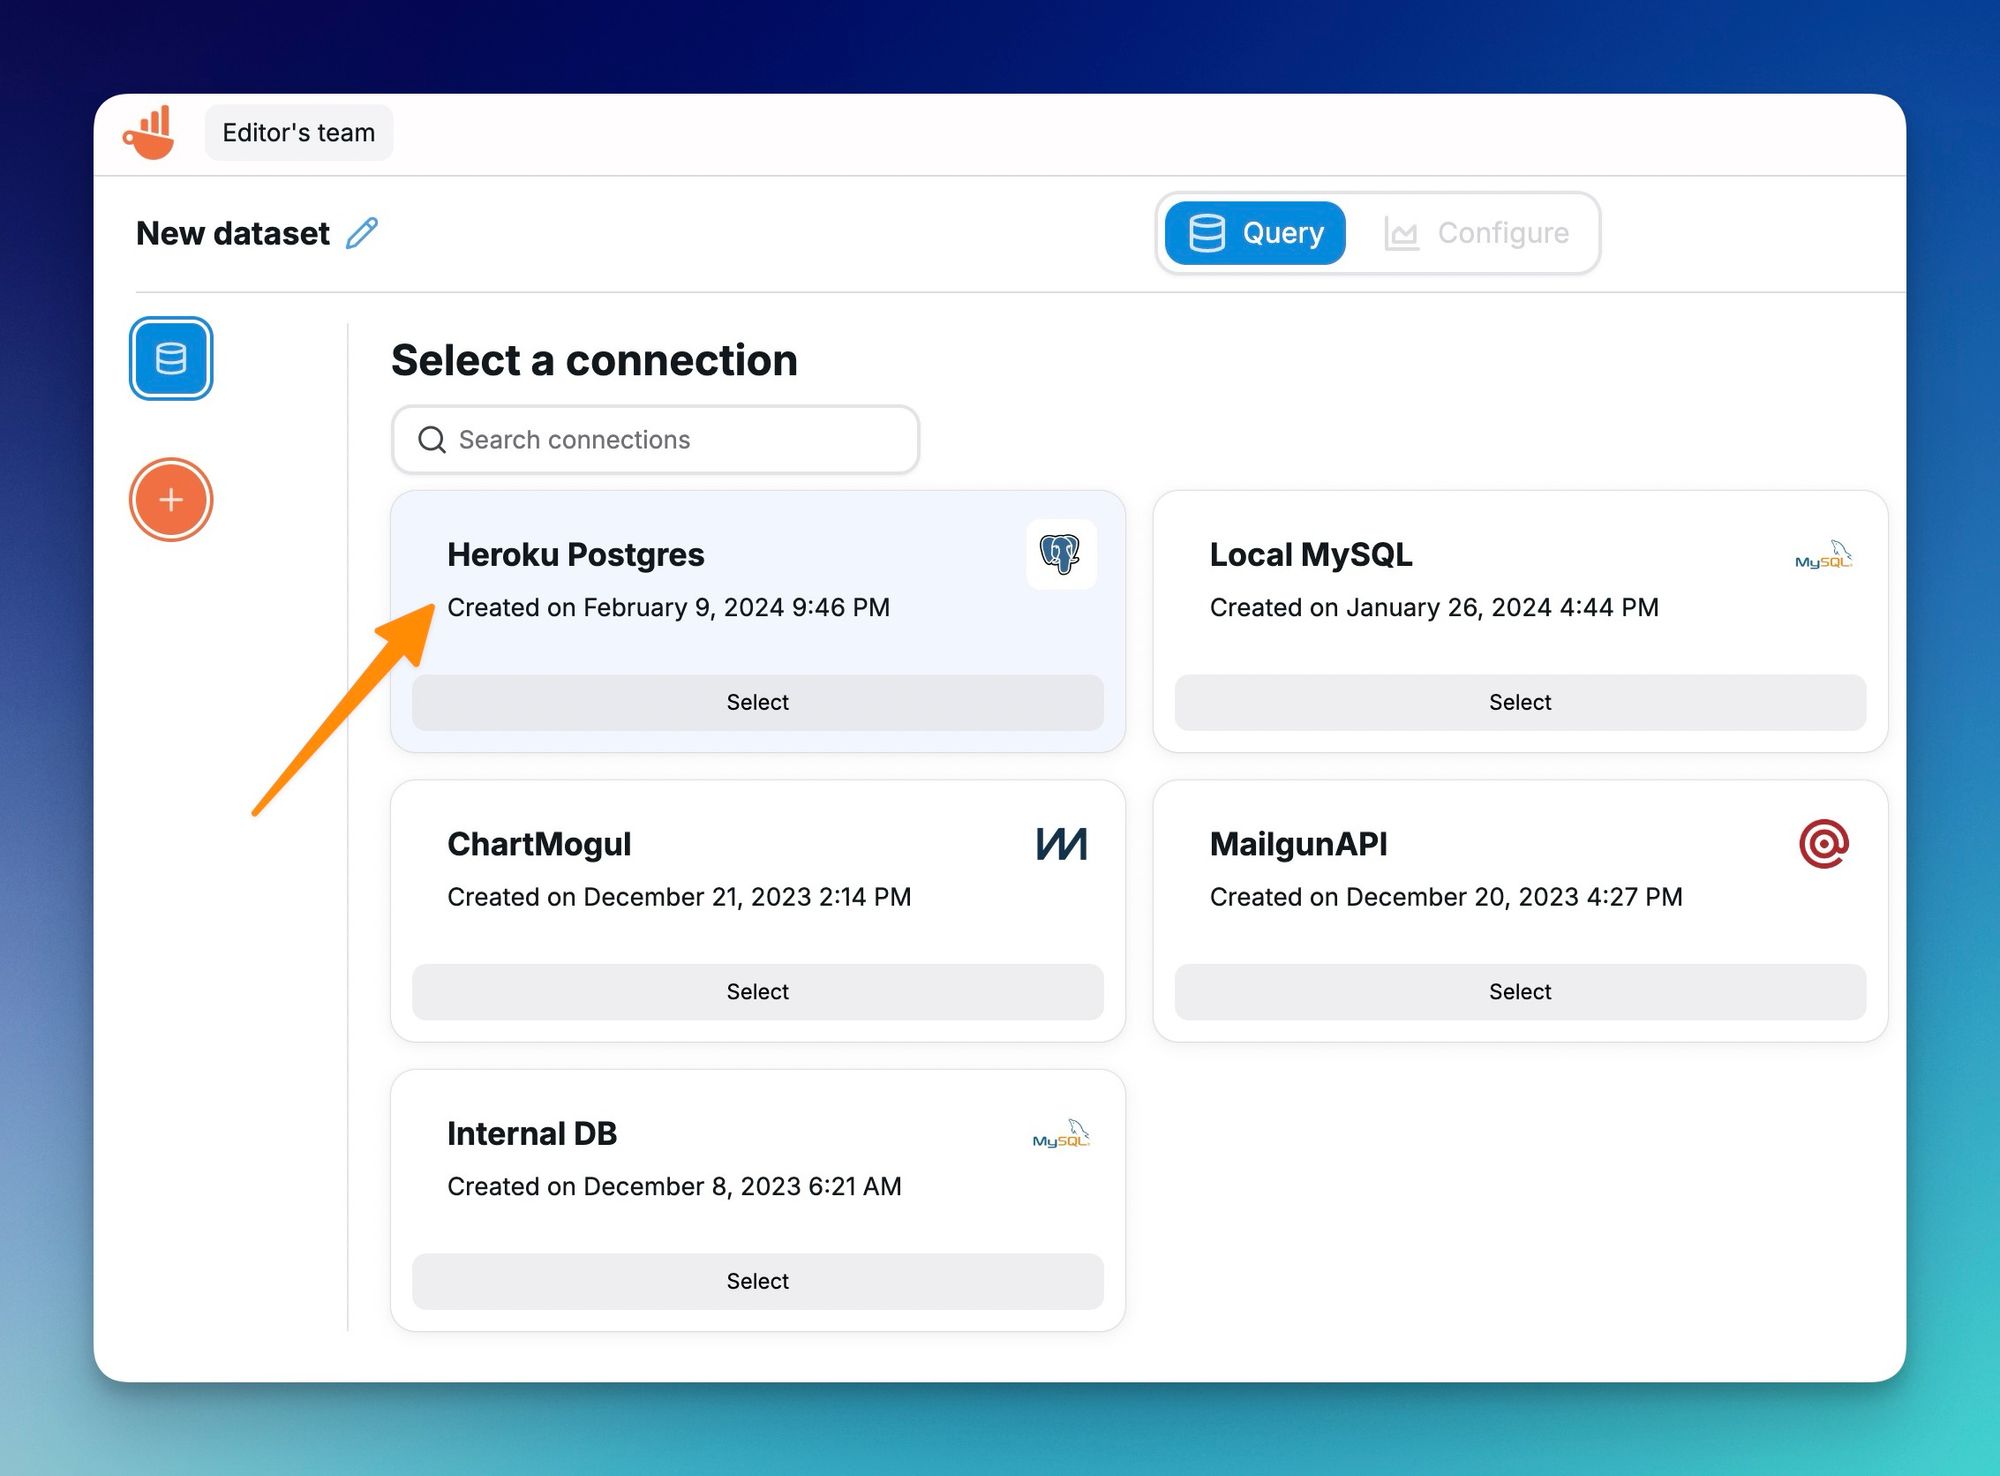
When you create a new dataset, Charbrew will ask which connection to use to fetch the data. Let's select our new Heroku Postgres connection and create our first dataset.
In this example, we are going to determine the most popular movie categories in the database. To get the data, we write an SQL query to fetch all the films and their categories. The plan is to create a bar chart to easily determine the most popular category.
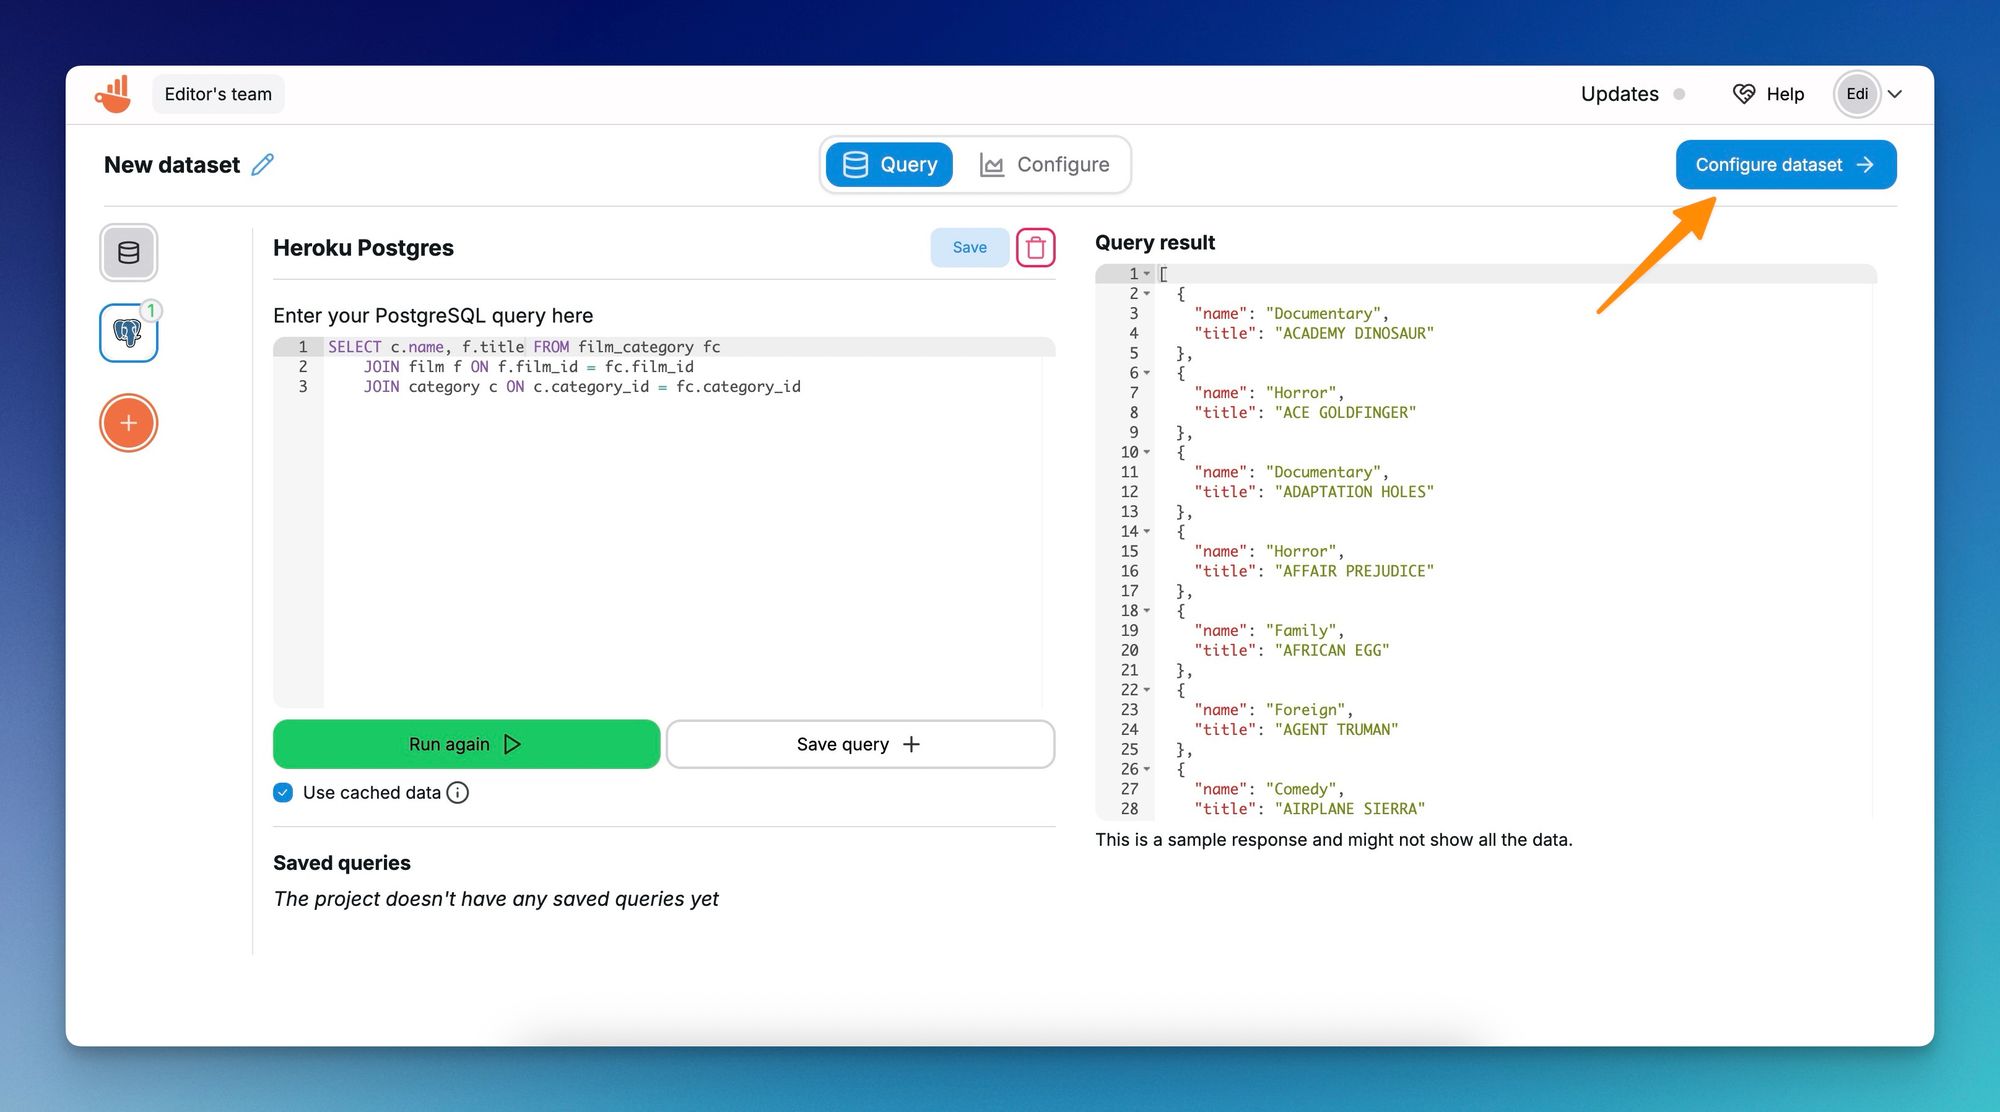
When making a SQL query, Chartbrew shows a preview of the data in JSON format on the right side of the screen. The results are limited to only a few results in the preview to keep the application snappy. Once you are happy with the results, click on the Configure dataset button to head over to previewing visualizations.
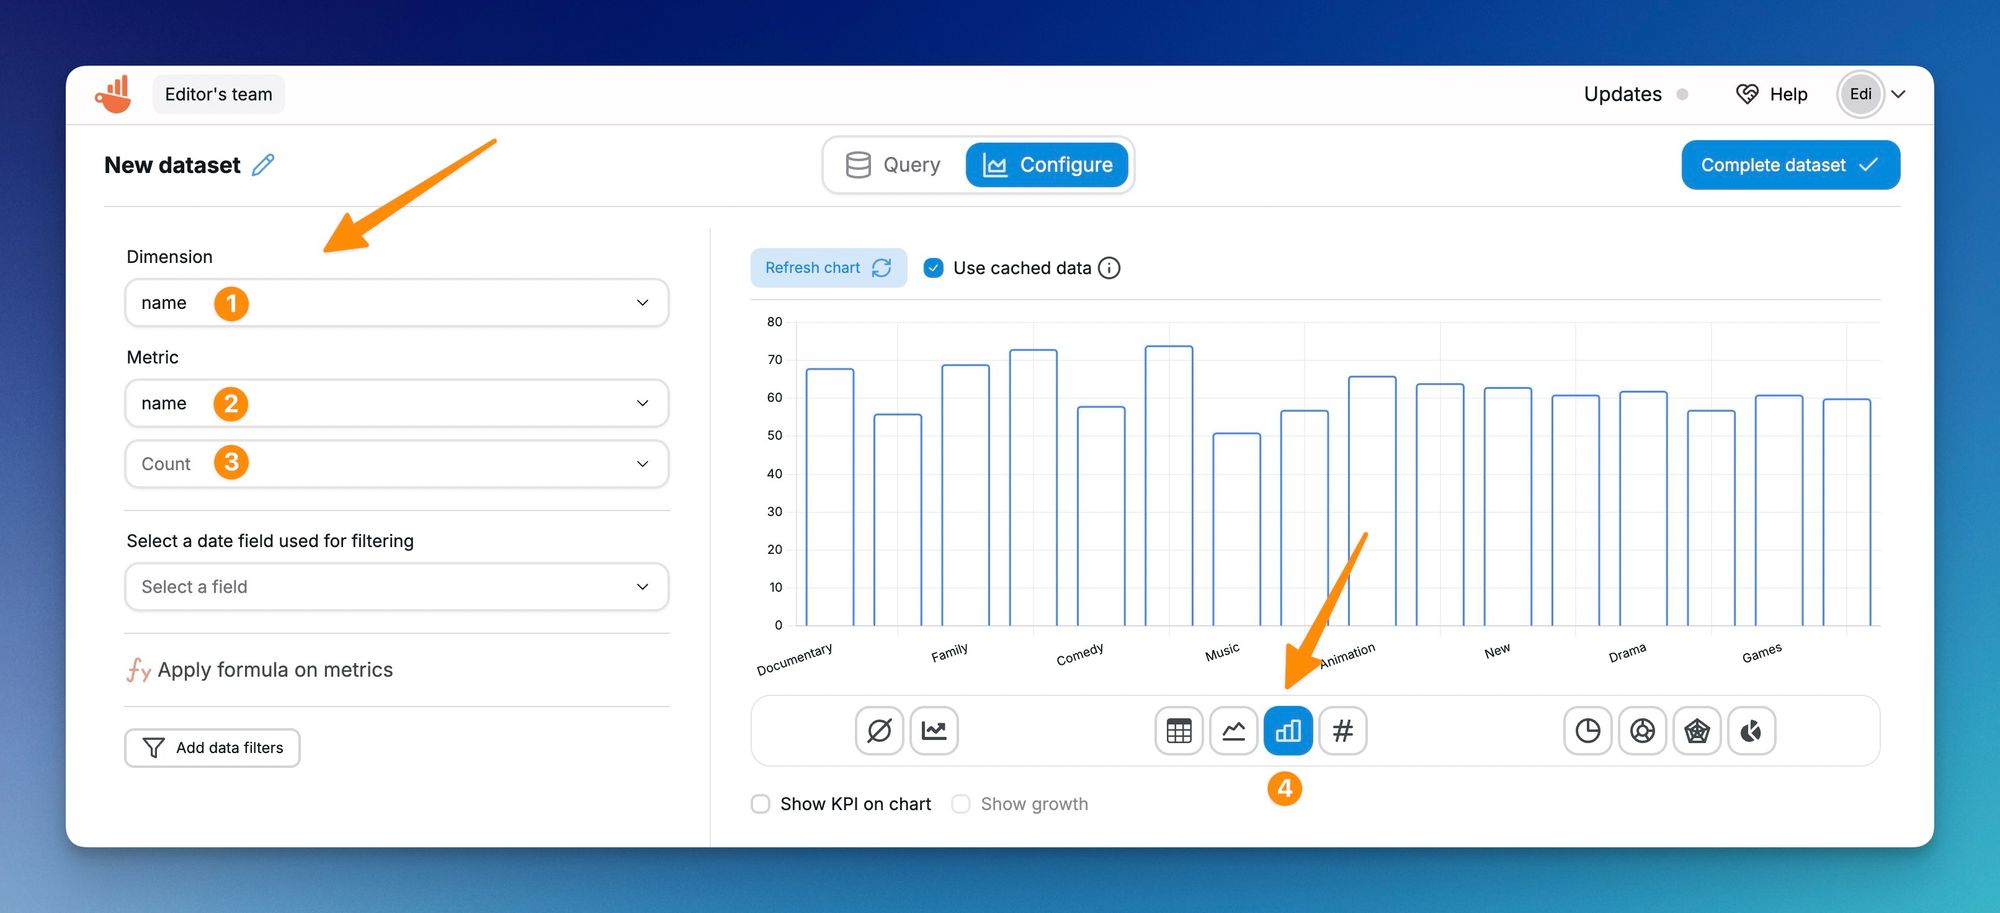
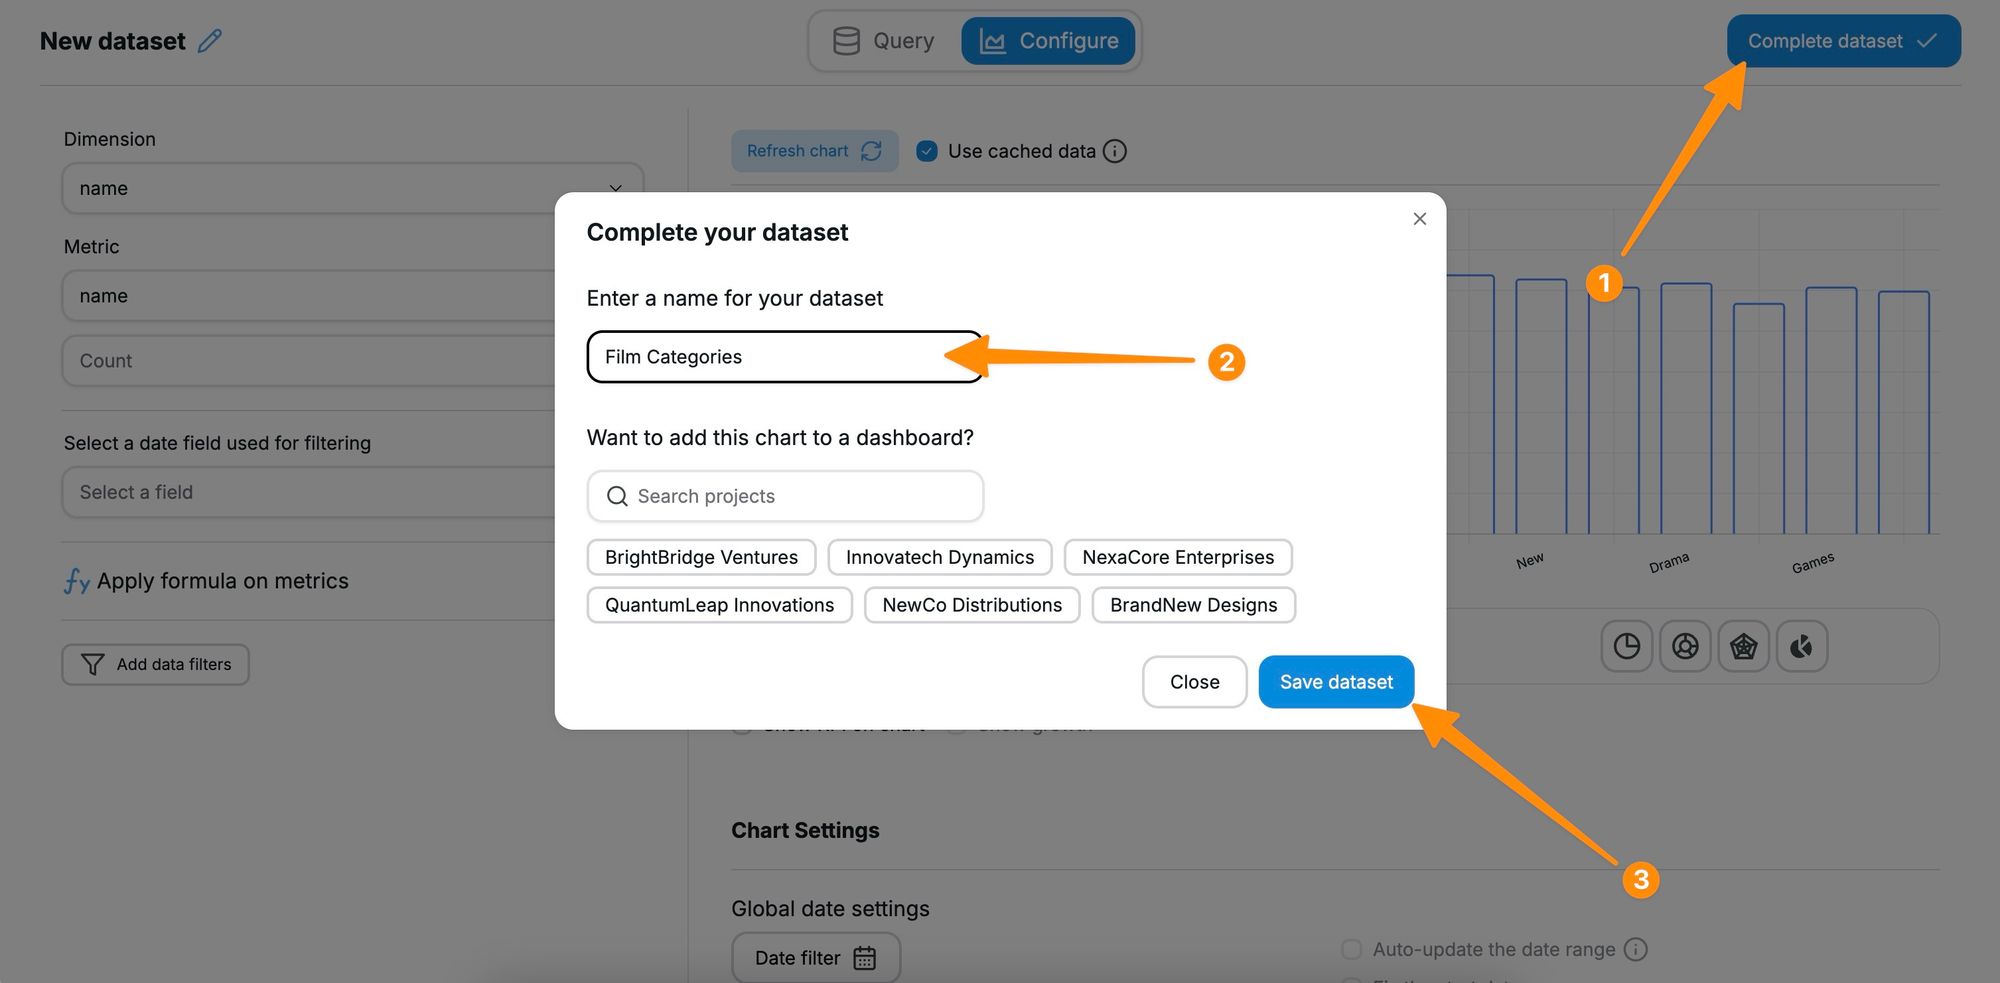
On the left side of the screen, you can select the Dimension and Metric your dataset is going to use for the visualization. The left side is the preview, where you can experiment to see what kind of visualizations you can create. After the dataset is created, you can re-use this in multiple dashboards and use different visualization types. Let's save the dataset and create a new dashboard where we can use this dataset to create charts.
Create a dashboard with Postgres data
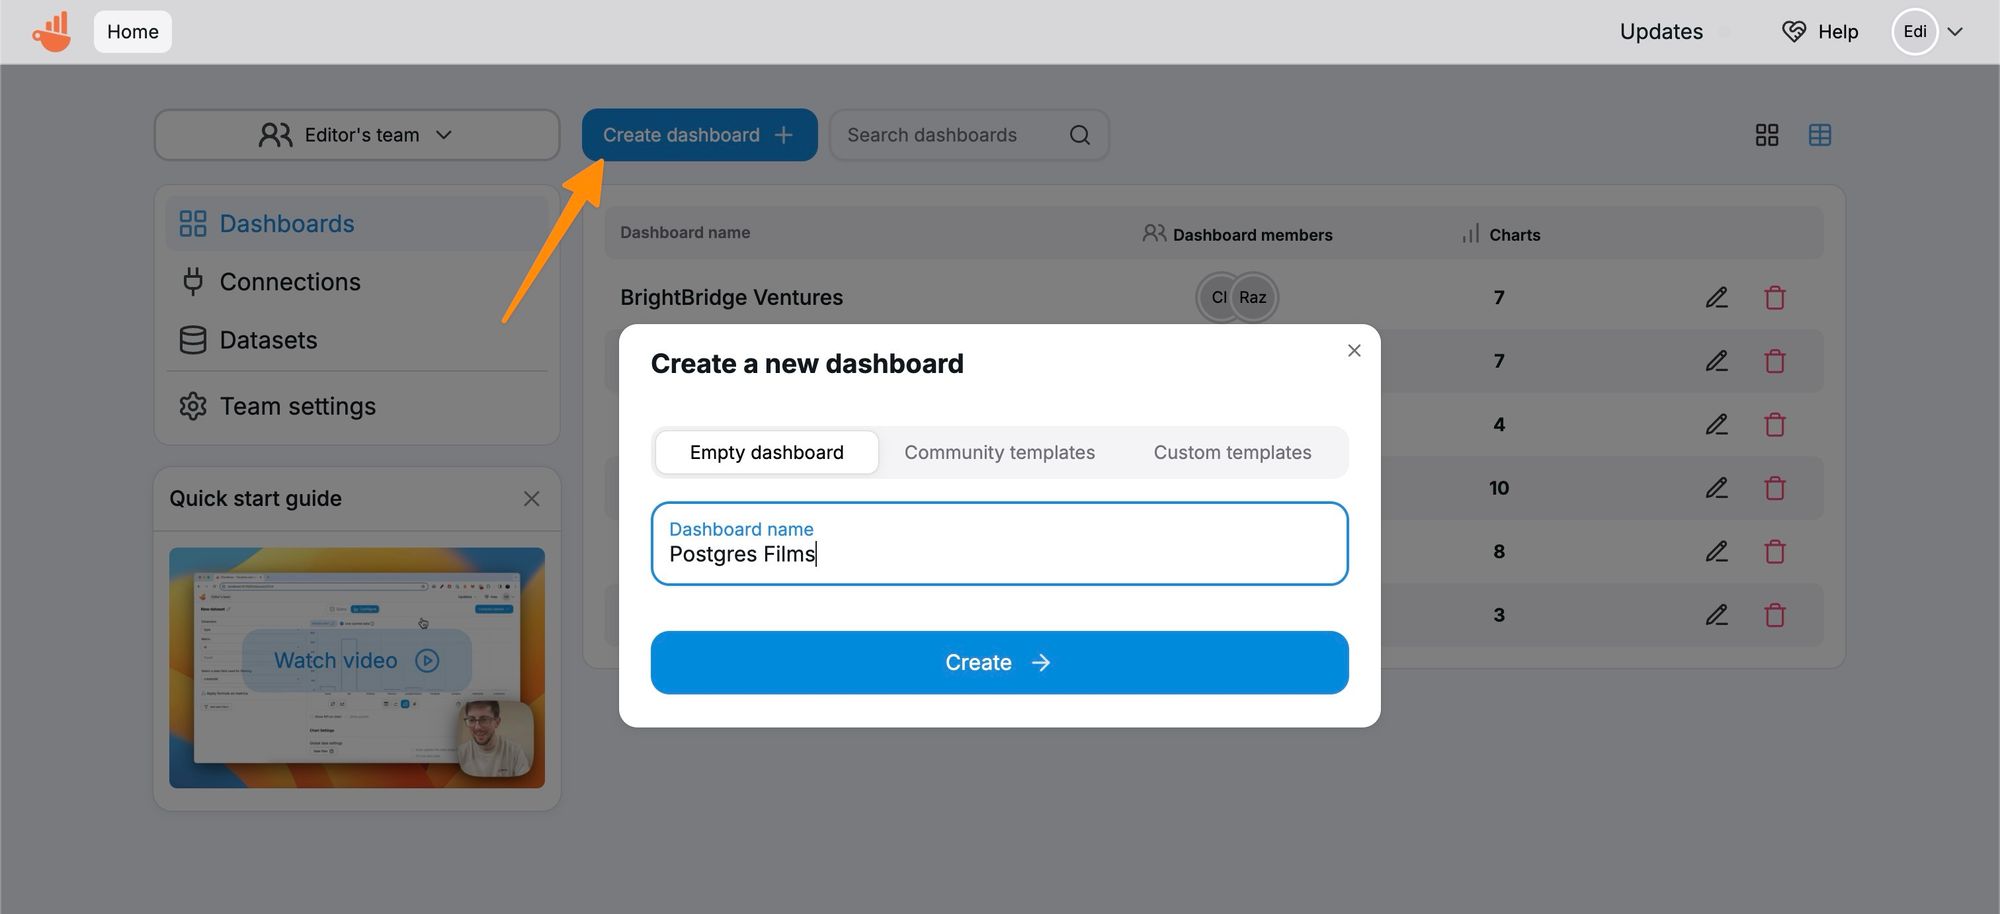
Once the dataset is saved, you will be redirected to the main dashboard. Let's create a new dashboard to create our first charts.
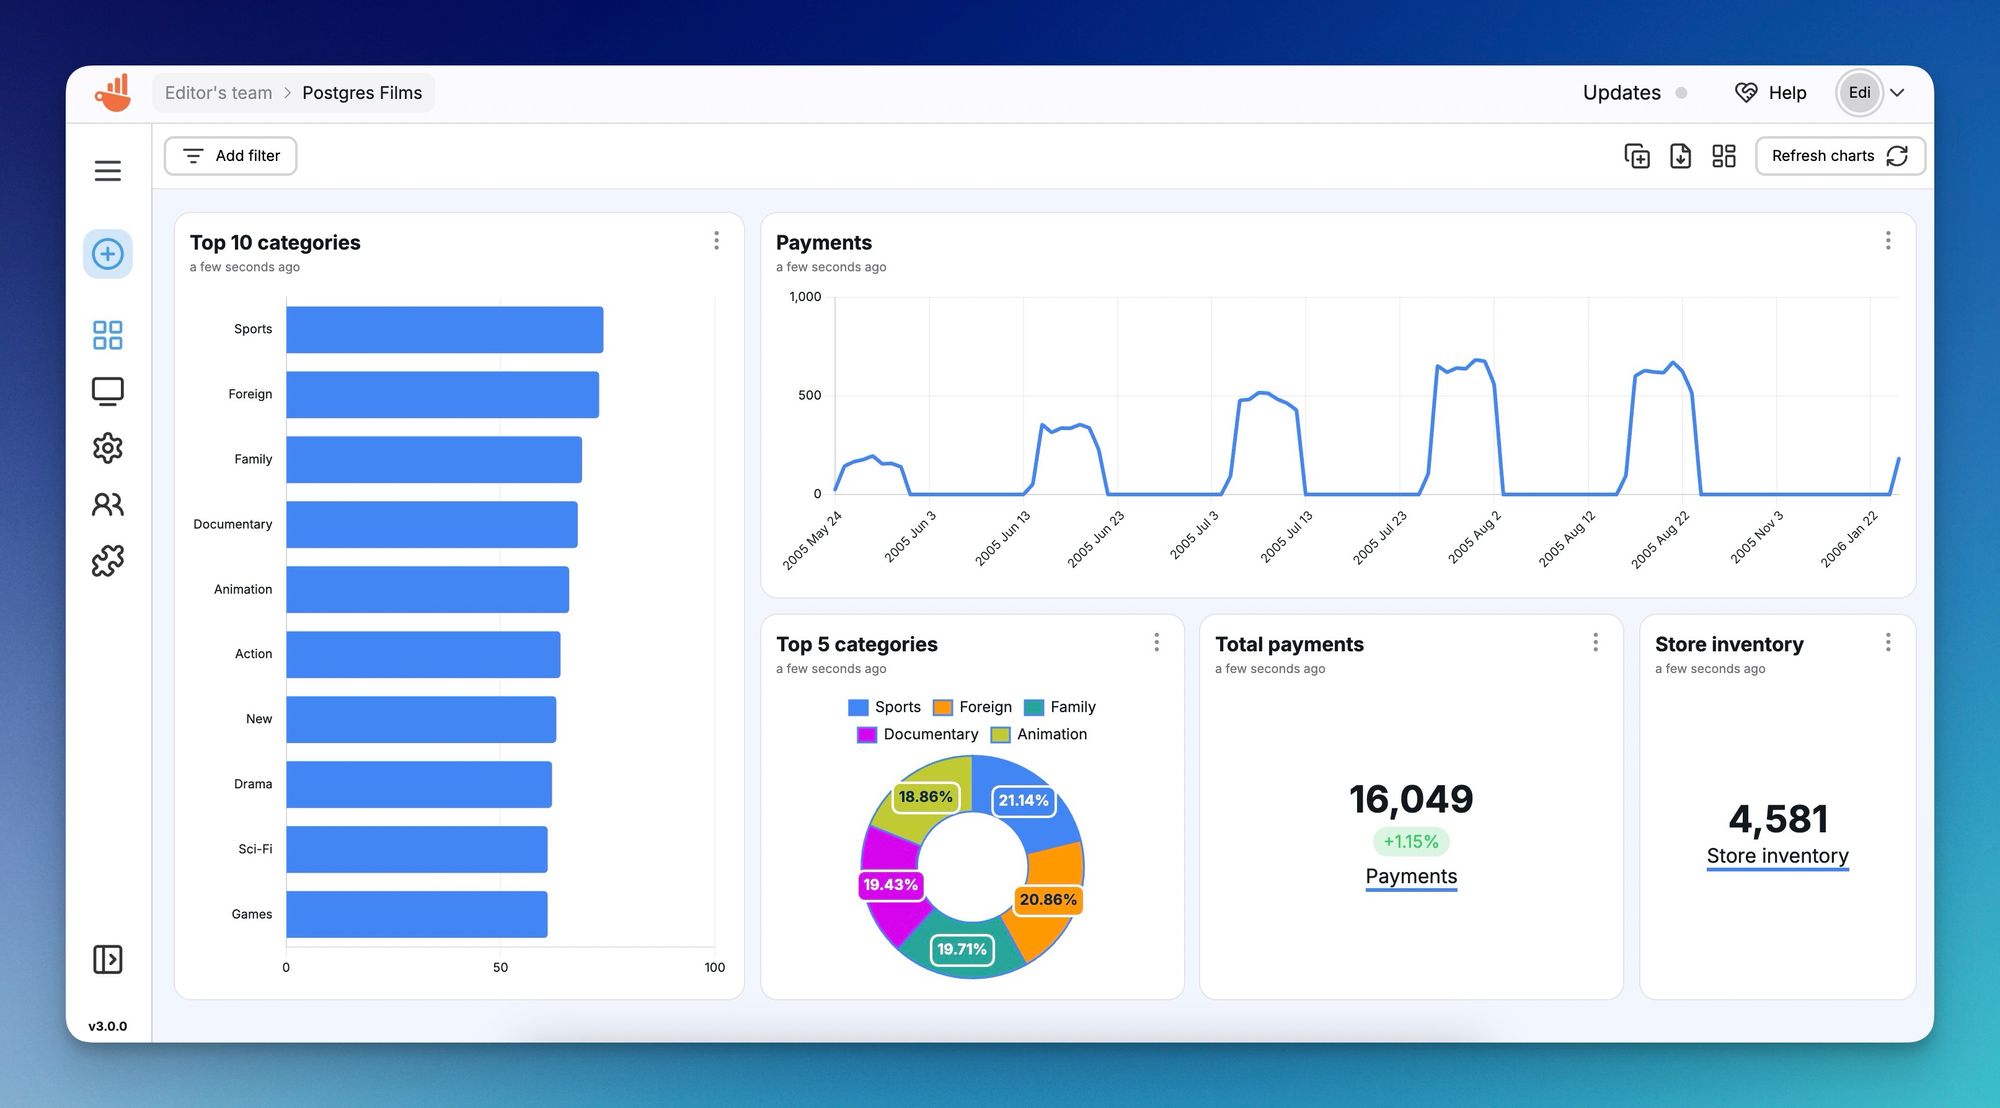
In the following example, we will use the film categories dataset we created earlier to show a horizontal chart of the top 10 categories.
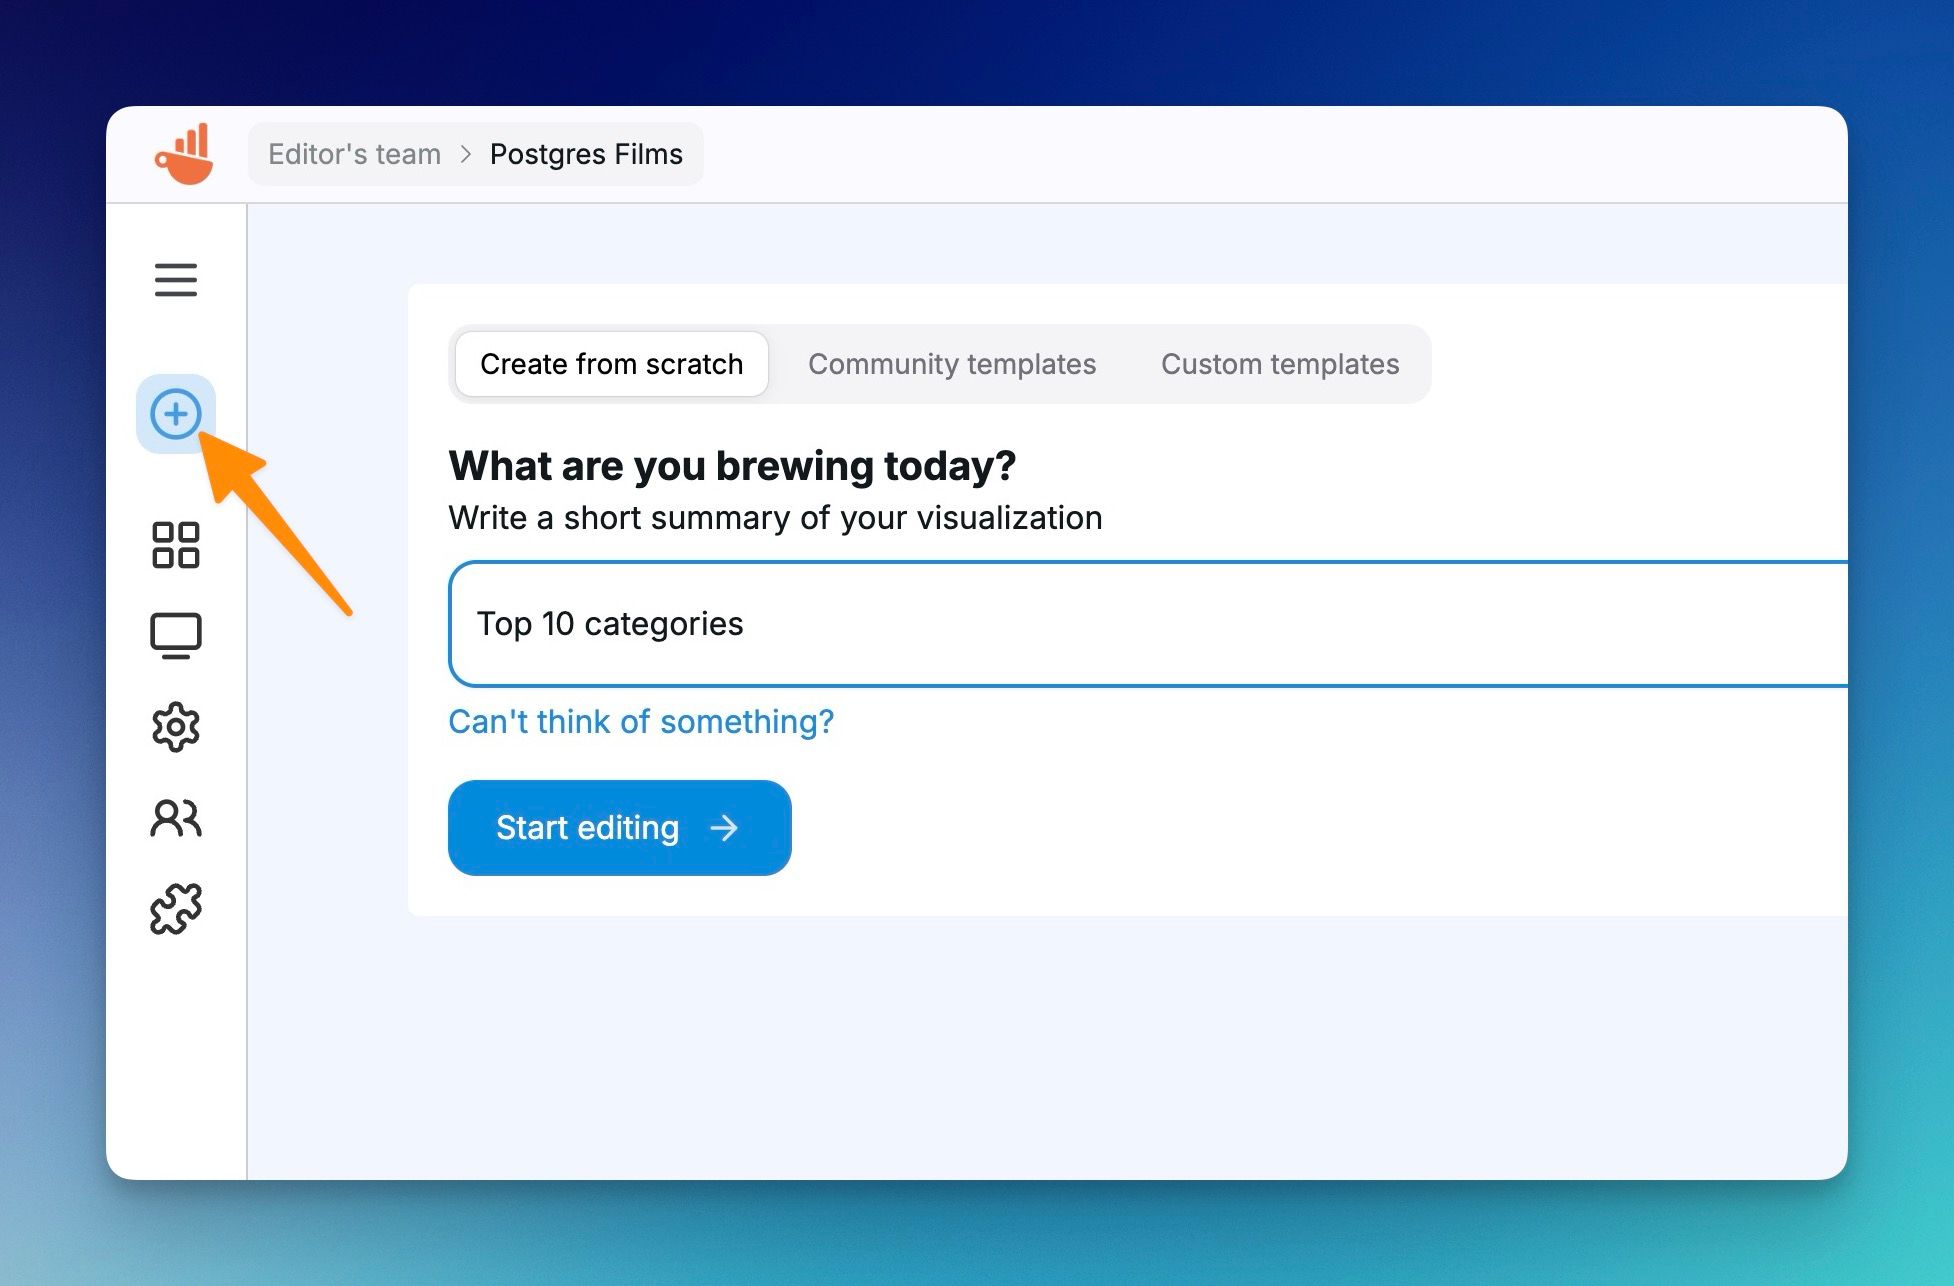
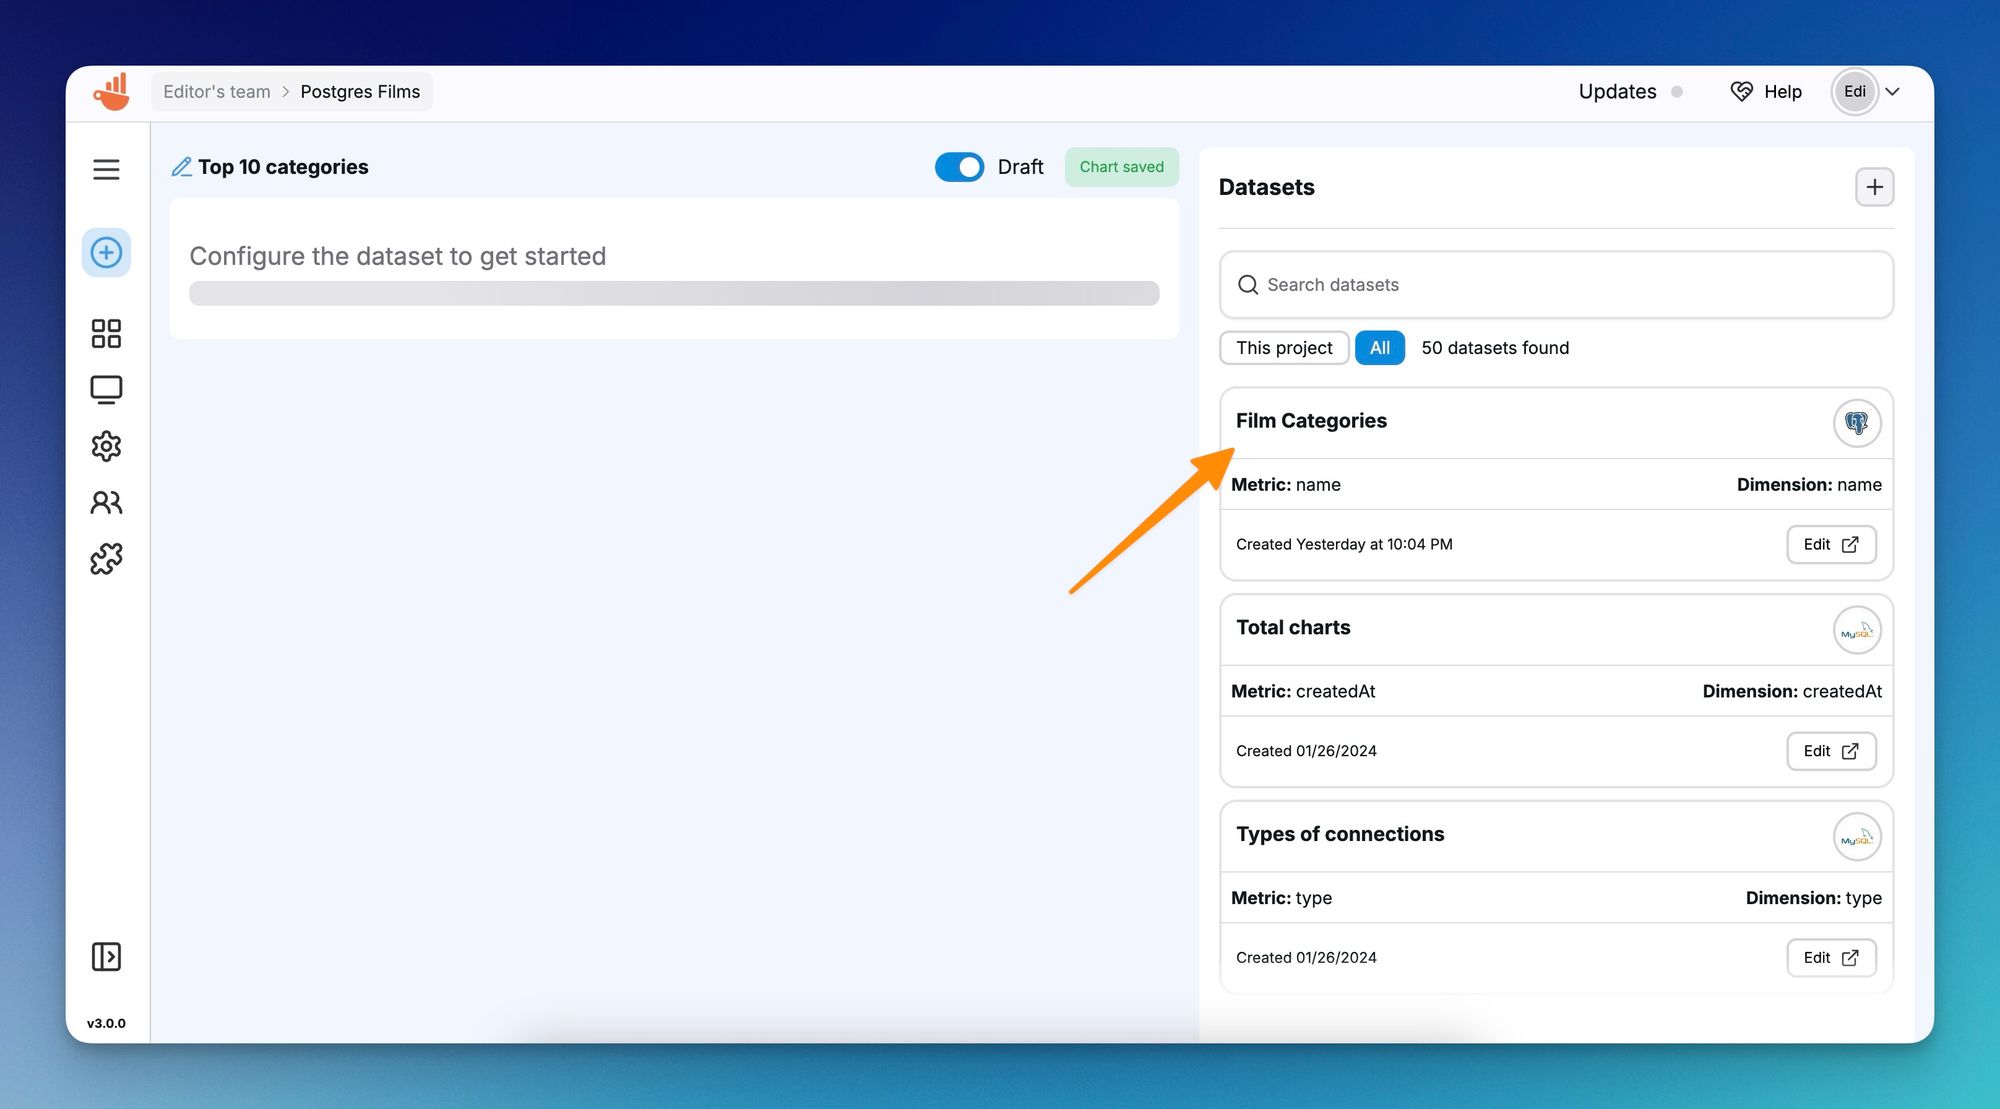
When creating a chart, you can select one or even multiple datasets to display on your chart. In our case, we are going to select the dataset we created earlier.
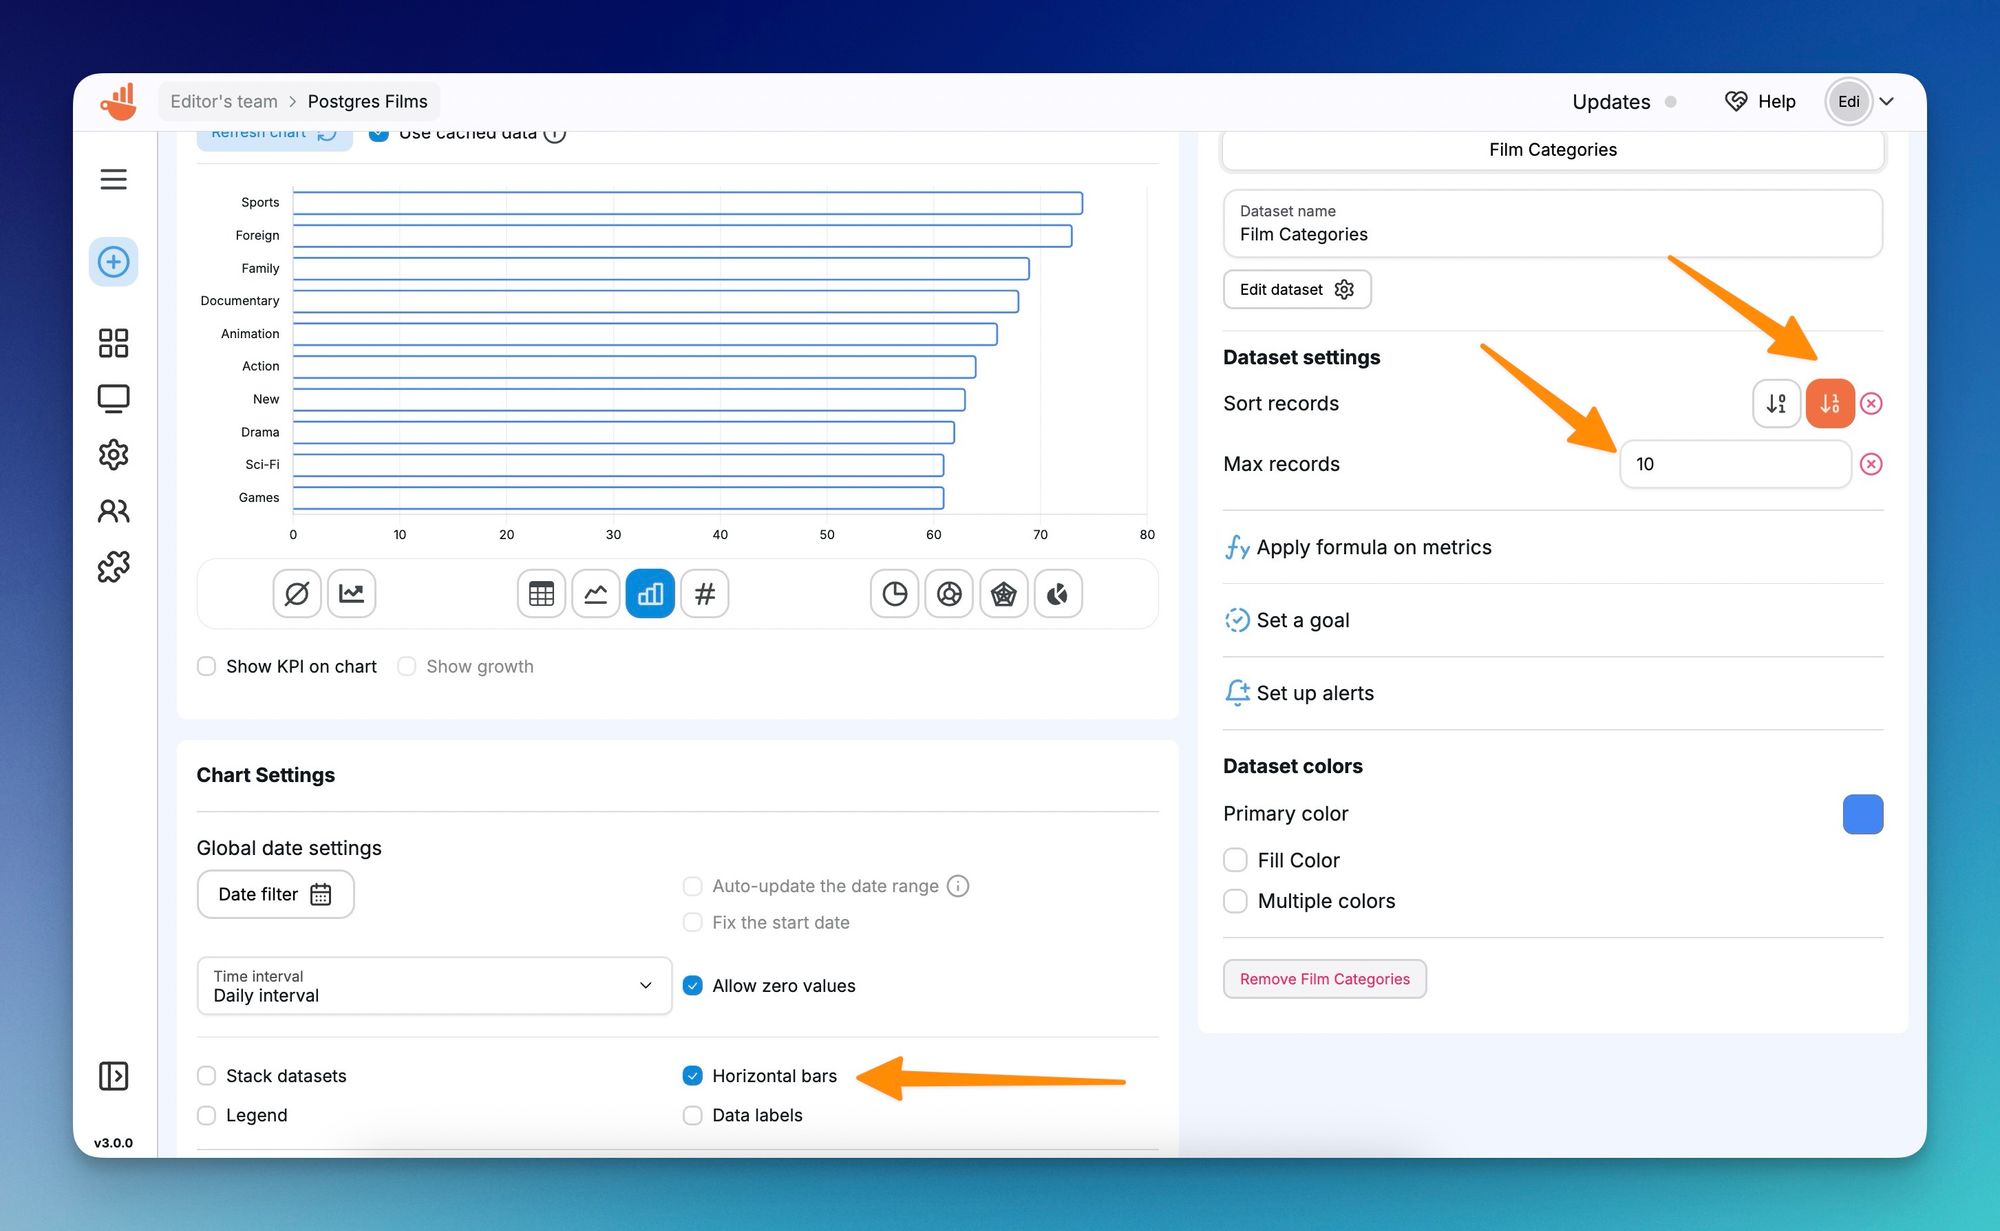
Next up, we are going to arrange the results to show the most popular first, cap the results at max 10, and then change the bar chart to be horizontal. We will end up with a clear visualization of the most popular film genres from the Postgres database.
We can then re-use this dataset in other contexts as much as we want. In this case, we can show the same data in a different format like a doughnut chart.
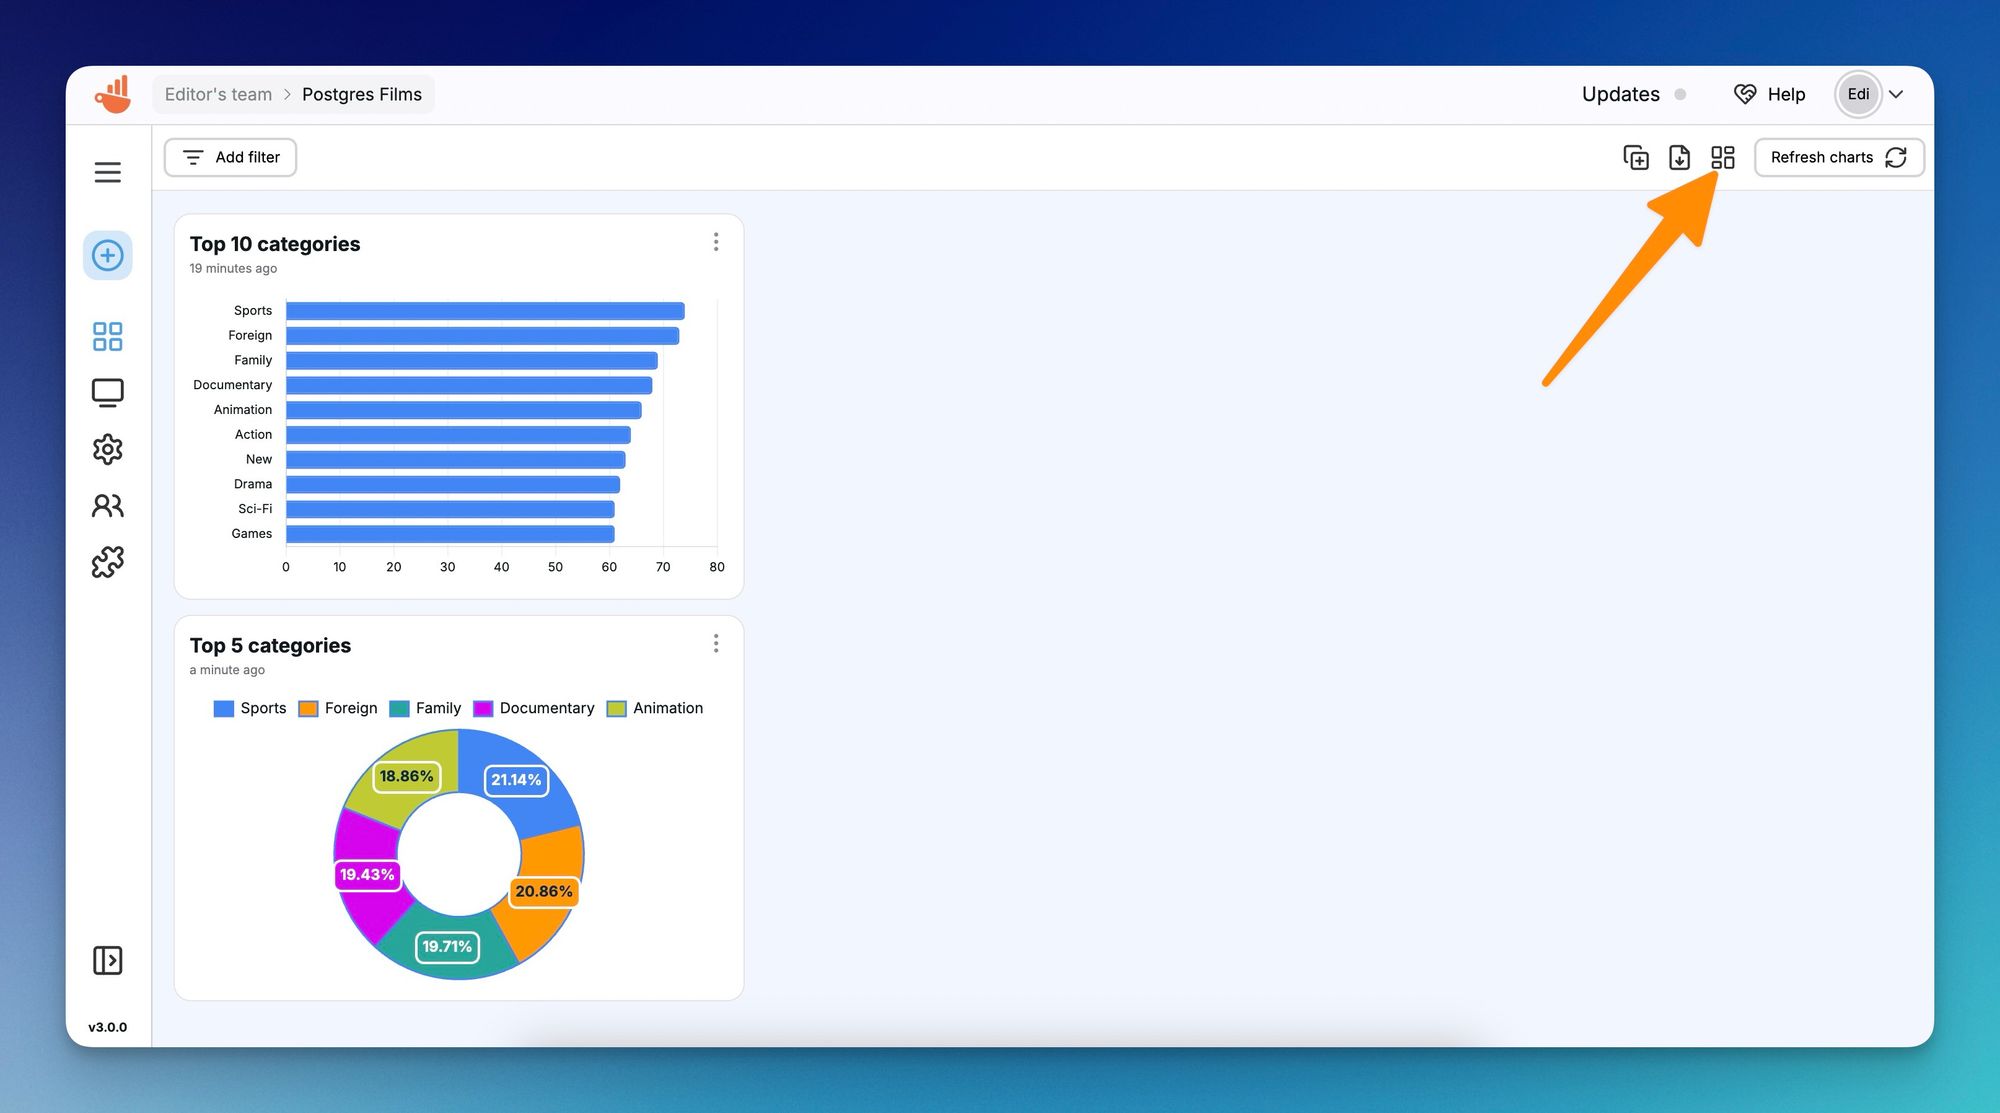
Once you create more charts, you might want to re-arrange the widgets. You can click on the layout button on the right to create and edit the layout. We can then create more datasets and add more charts to the dashboard to make sure we have a good view of what's going on with the data.
Next steps
The real value of Chartbrew is when you connect more data sources to the platform. Check the full list of tutorials to see what else you can connect. Then learn how to create client reports and share them with others, and once you're ready to scale, create dashboard templates and create multiple dashboards for your clients.
