How to connect and visualize Amazon RDS data with Chartbrew
In this tutorial, we'll guide you through the steps to seamlessly connect your Amazon RDS databases, specifically Postgres and MySQL, with Chartbrew. This will enable you to visualize your data in a dynamic and interactive way.
Preparing your Amazon RDS instance
Before connecting your RDS database to Chartbrew, you need to ensure that your RDS instance is properly configured to accept remote connections. Here’s how to do it:
Find Your RDS Instance Details
- Log in to your AWS Management Console.
- Navigate to the RDS Dashboard.
- Select Databases on the left menu and click on your database instance.
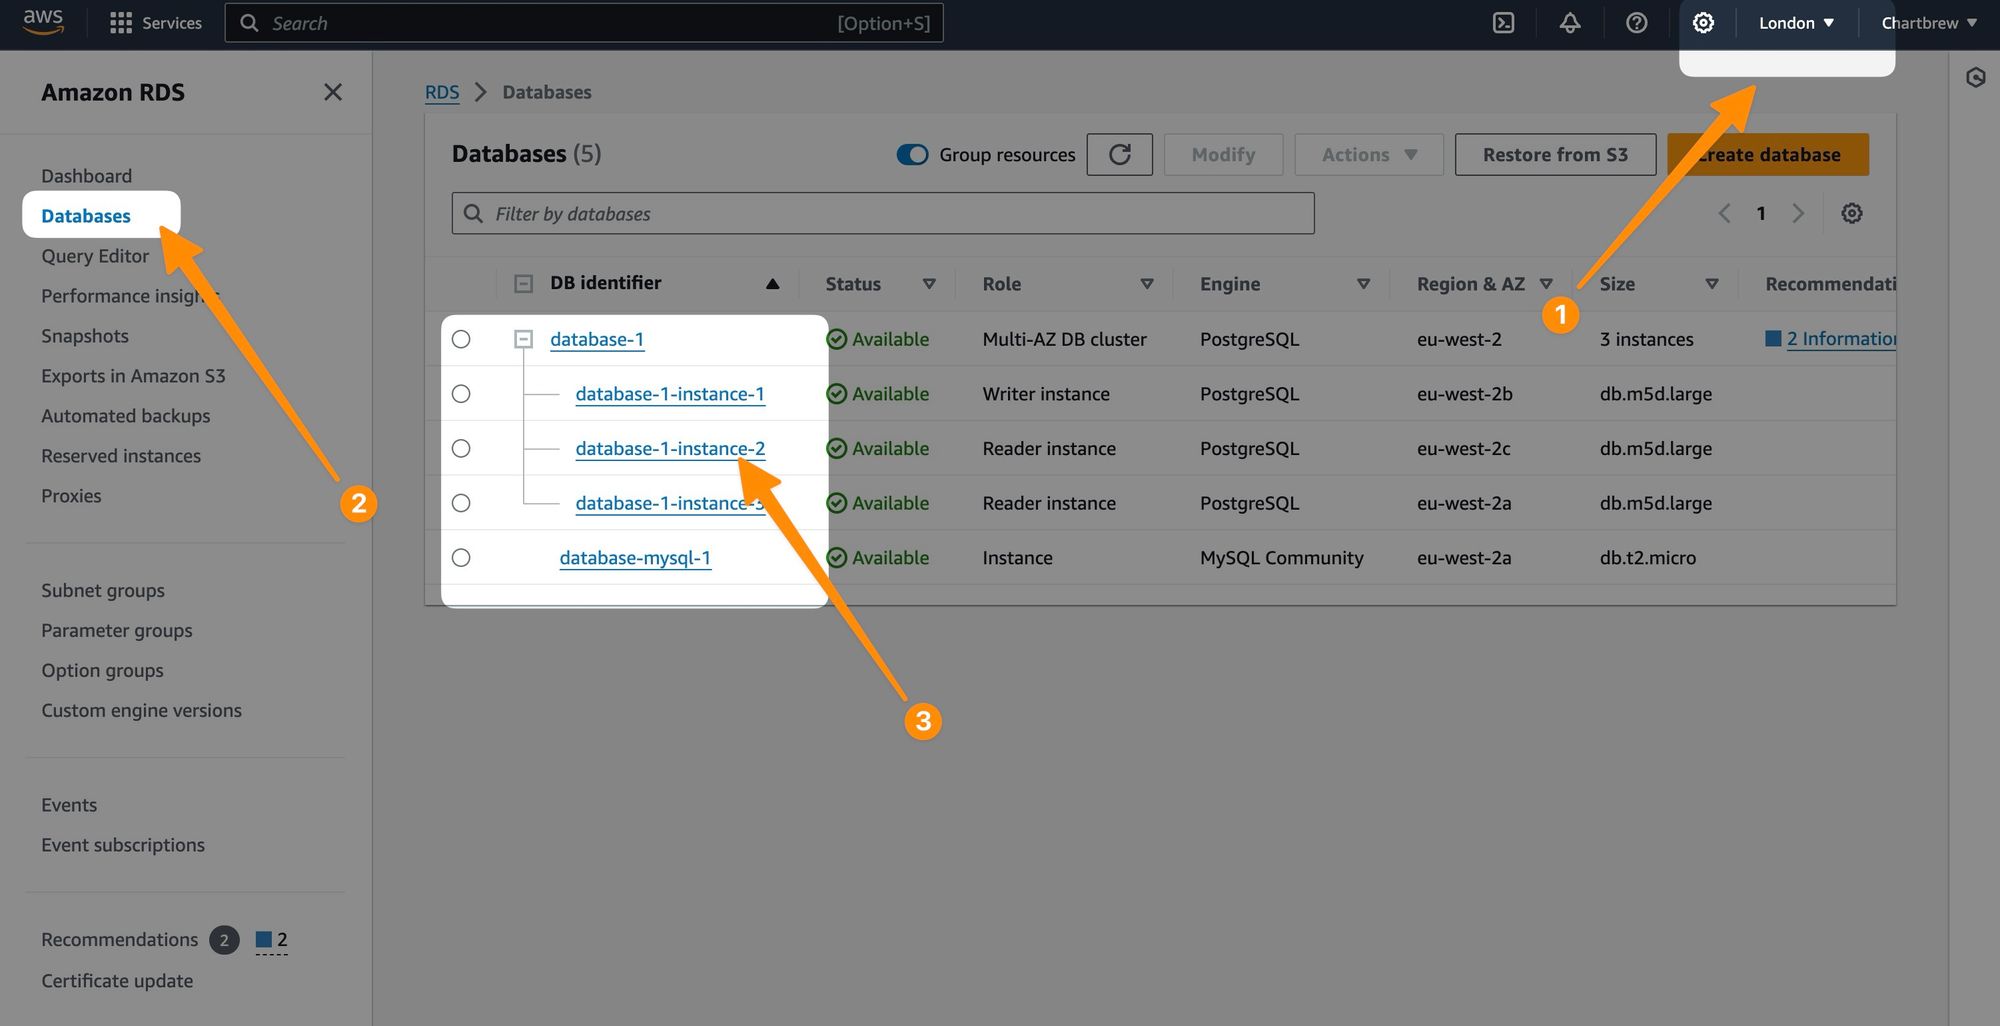
4. Click on one of the instances you want to connect to.
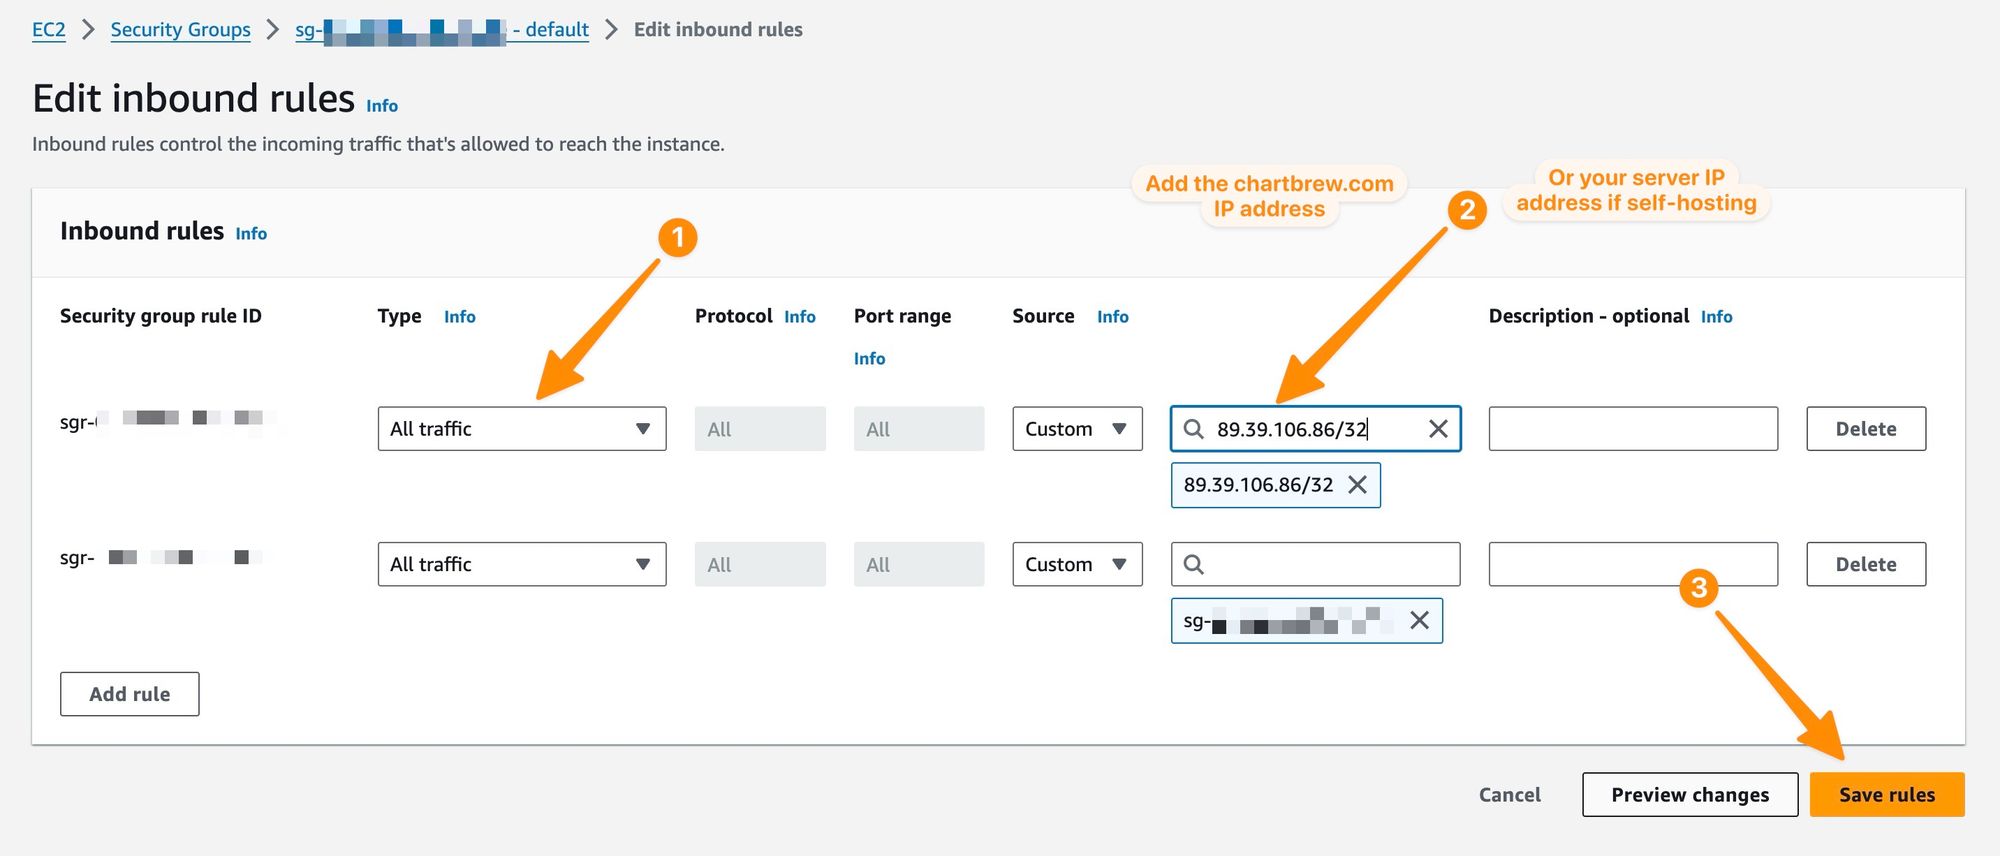
Adjust your RDS instance to allow remote connections
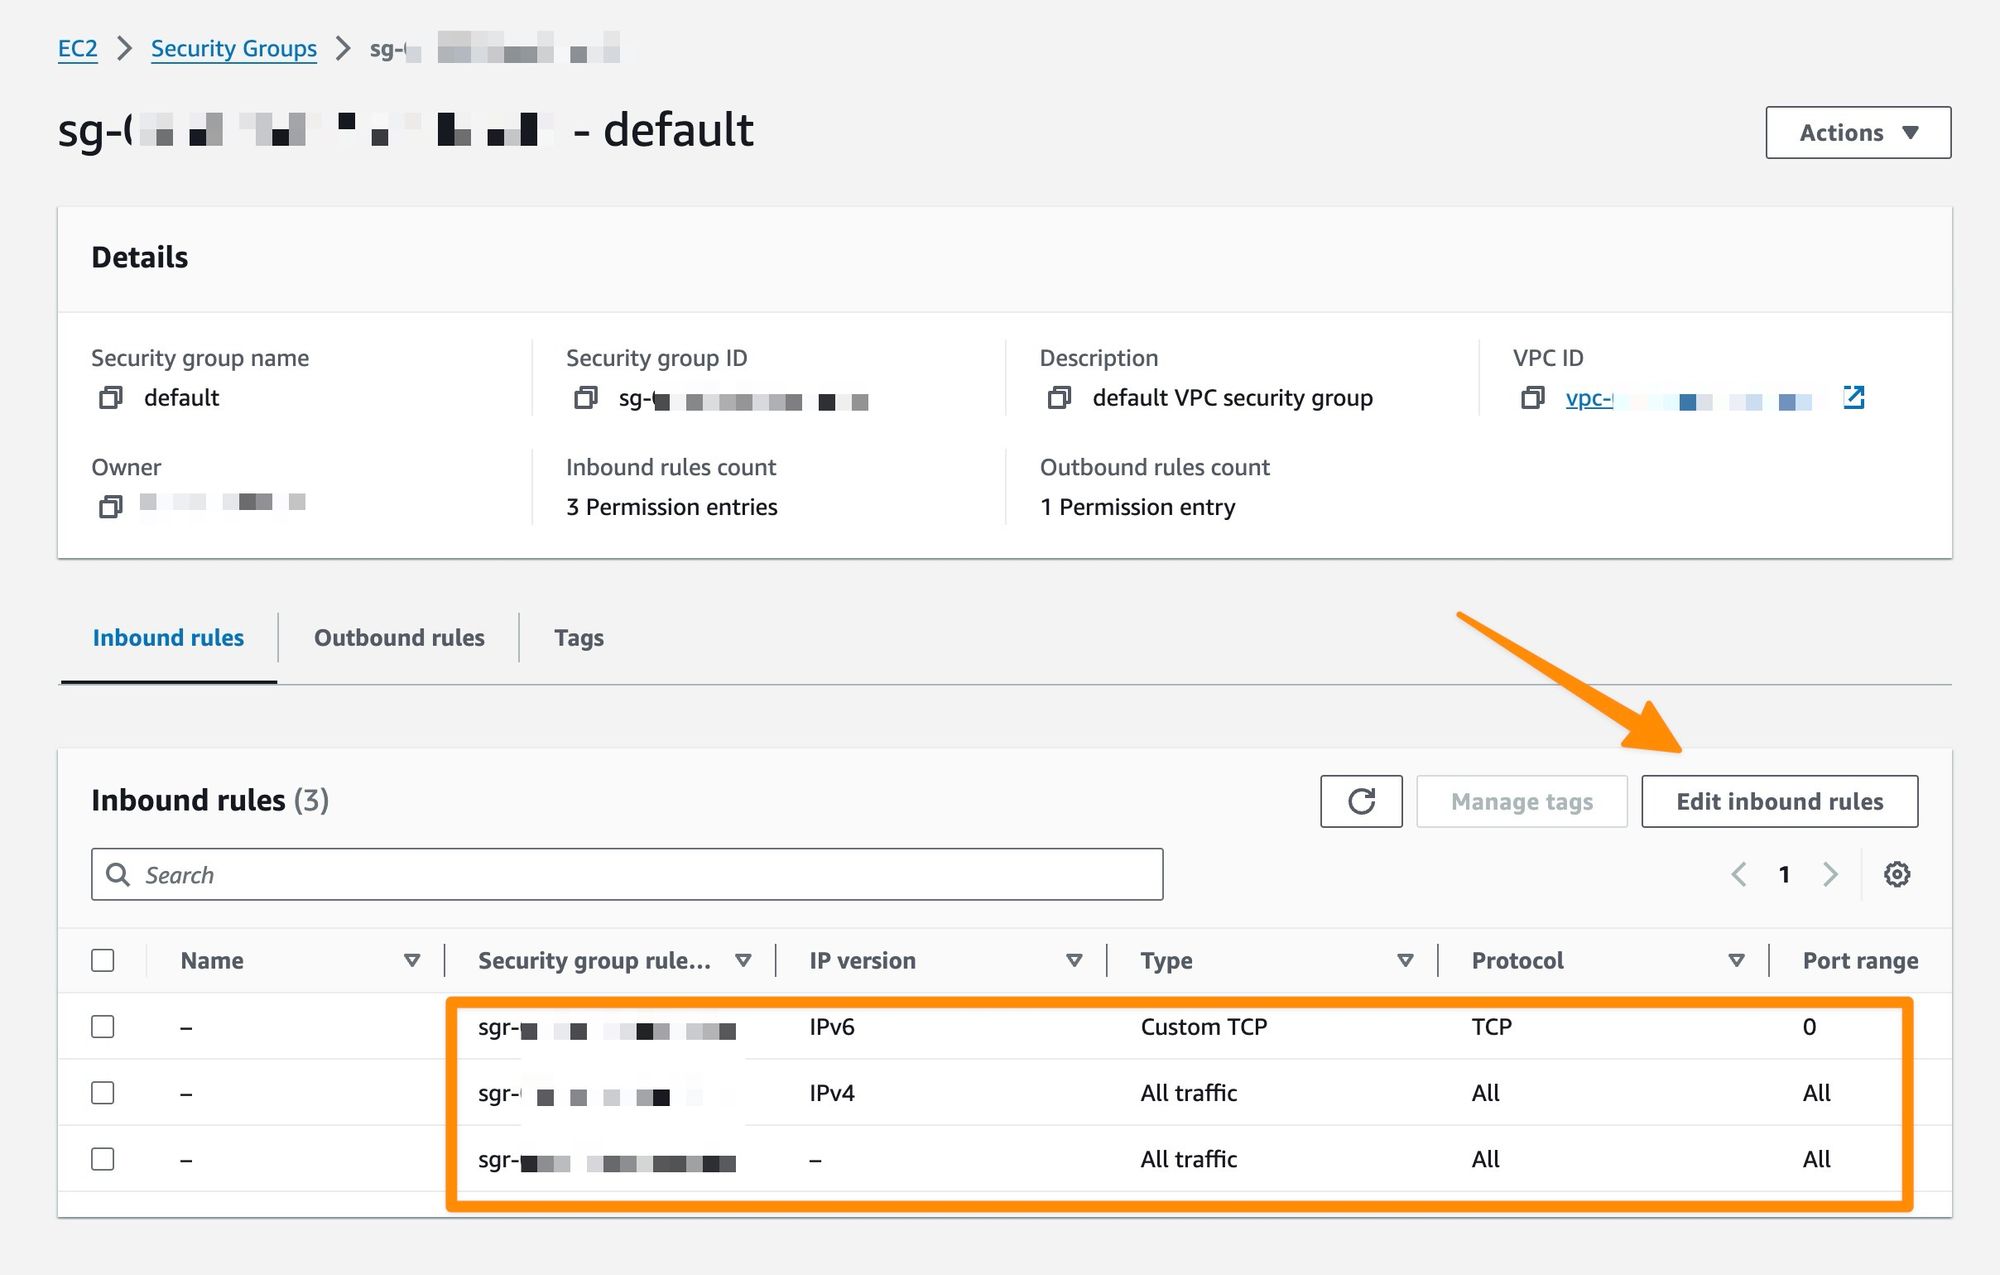
- In your database instance's Security group rules, find the Inbound rules.
- Edit the rules to allow inbound connections on the database port from your IP or any (
0.0.0.0/0for testing purposes, but not recommended for production).
Ensure your database user has Read-Only access (Optional but recommended)
If your Amazon RDS instances do not include read-only access, it is strongly recommended you create a read-only database user to use with Chartbrew. This will require you to access your database first, then run the following commands for MySQL or Postgres.
For Postgres:
CREATE USER chartbrew_readonly WITH PASSWORD 'password';
GRANT CONNECT ON DATABASE your_database TO chartbrew_readonly;
GRANT USAGE ON SCHEMA public TO chartbrew_readonly;
GRANT SELECT ON ALL TABLES IN SCHEMA public TO chartbrew_readonly;
ALTER DEFAULT PRIVILEGES IN SCHEMA public GRANT SELECT ON TABLES TO chartbrew_readonly;
For MySQL:
CREATE USER 'chartbrew_readonly'@'%' IDENTIFIED BY 'password';
GRANT SELECT ON your_database.* TO 'chartbrew_readonly'@'%';
FLUSH PRIVILEGES;
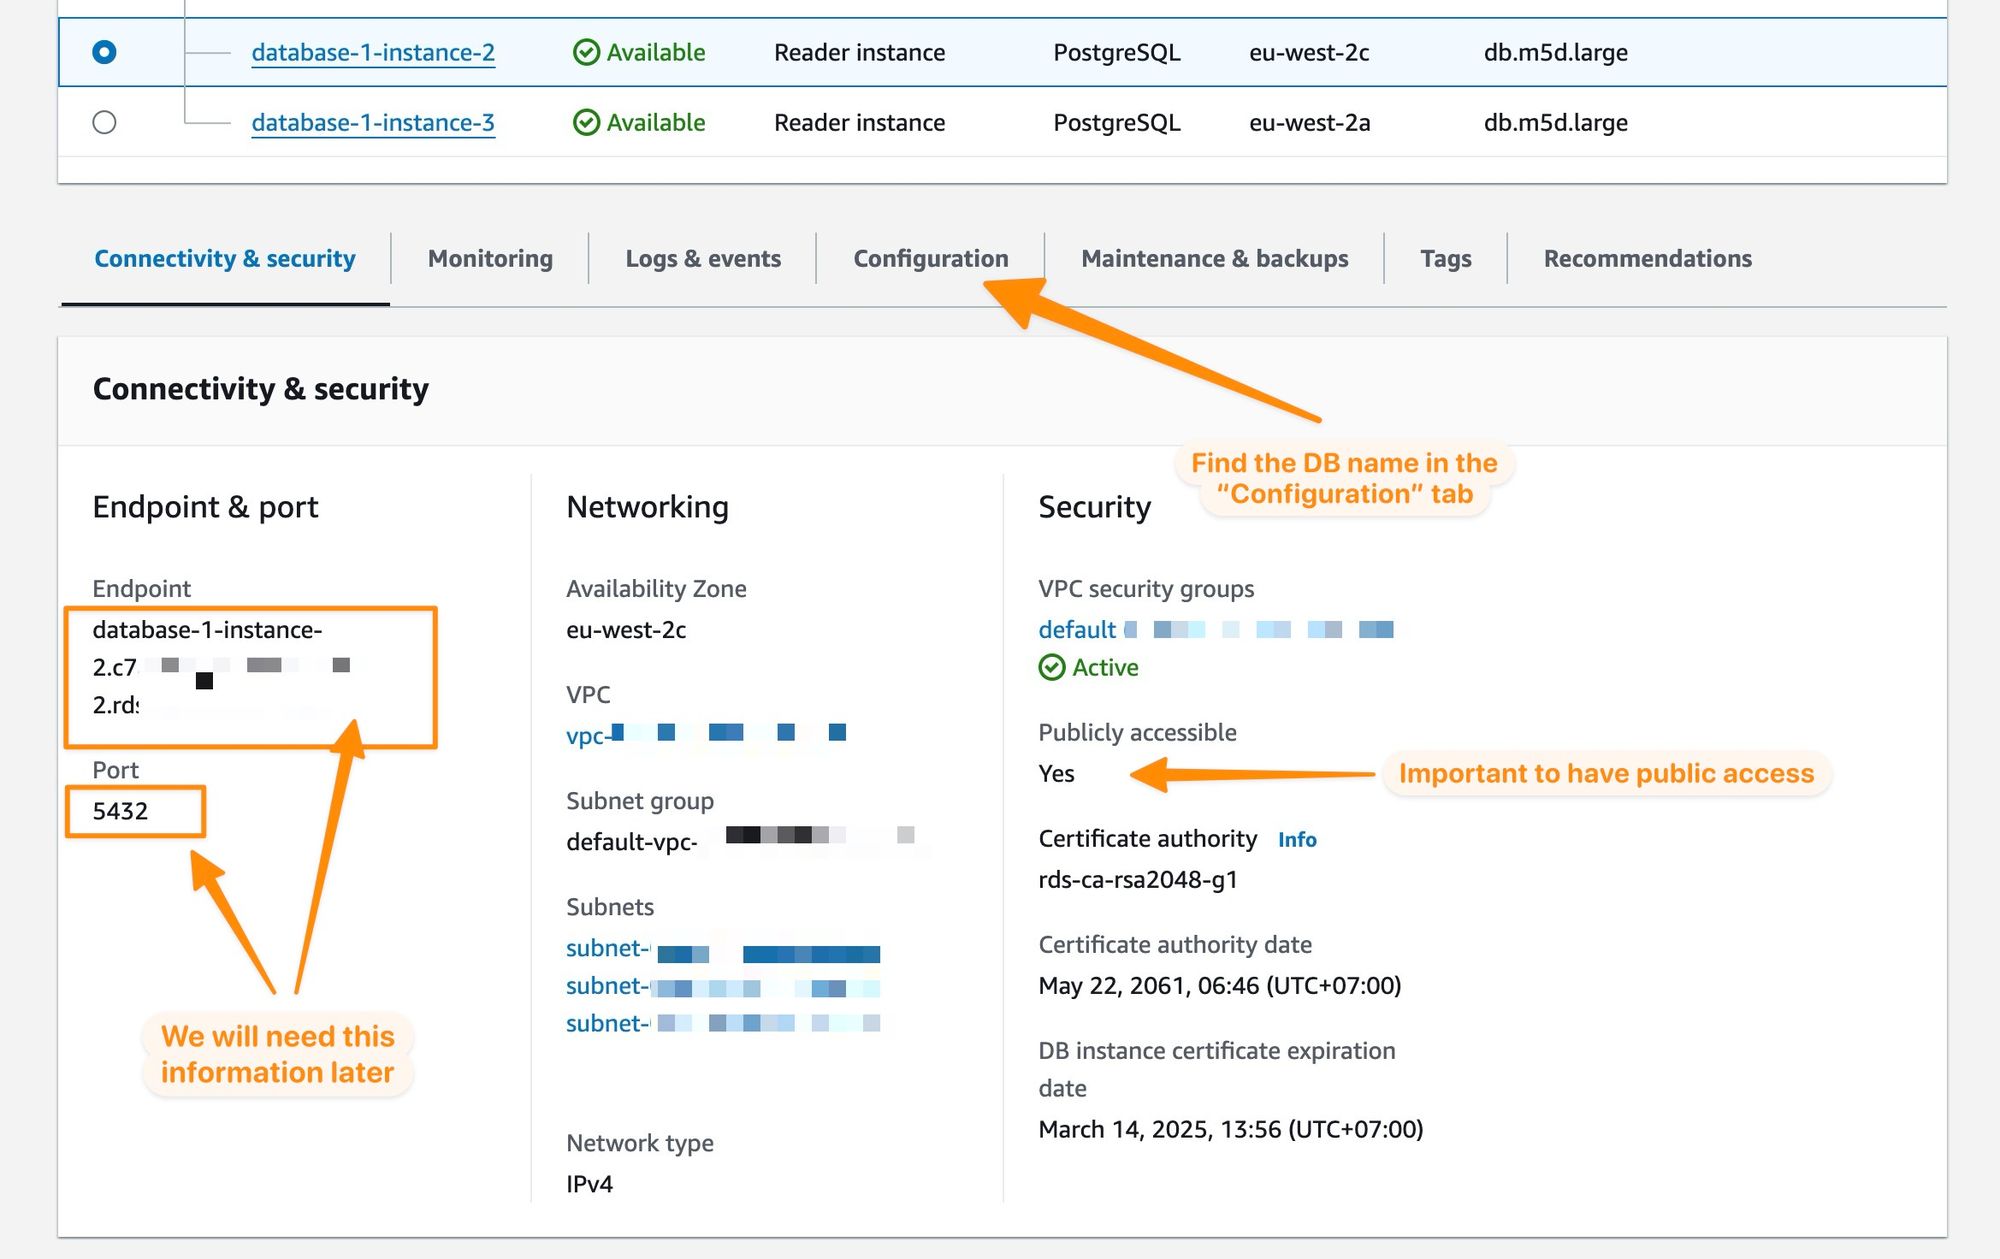
Connect Your RDS Database to Chartbrew
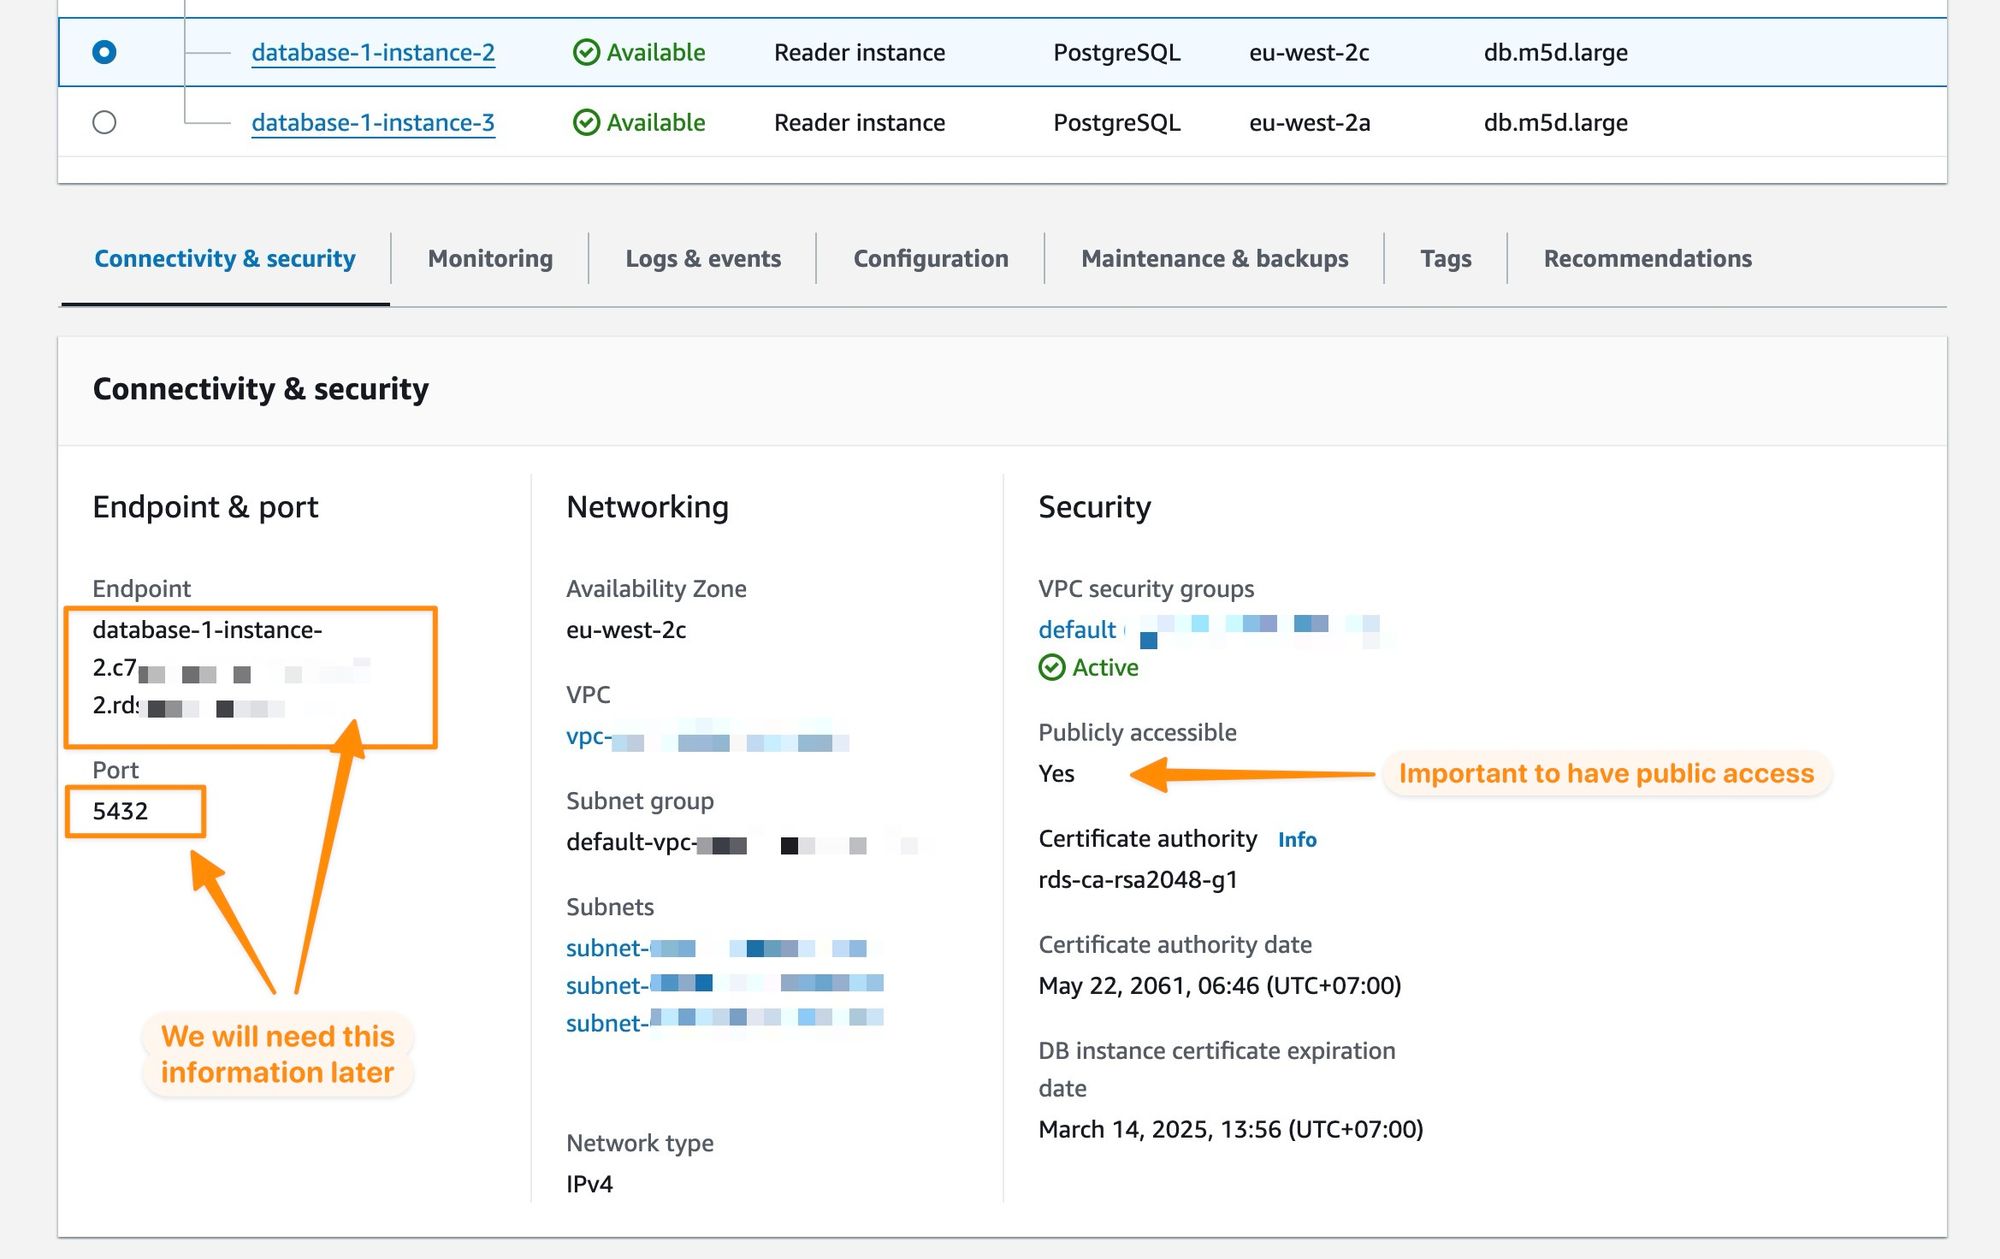
Before creating a new connection in Chartbrew, find your RDS connection details by clicking on the instance you want to visualize.
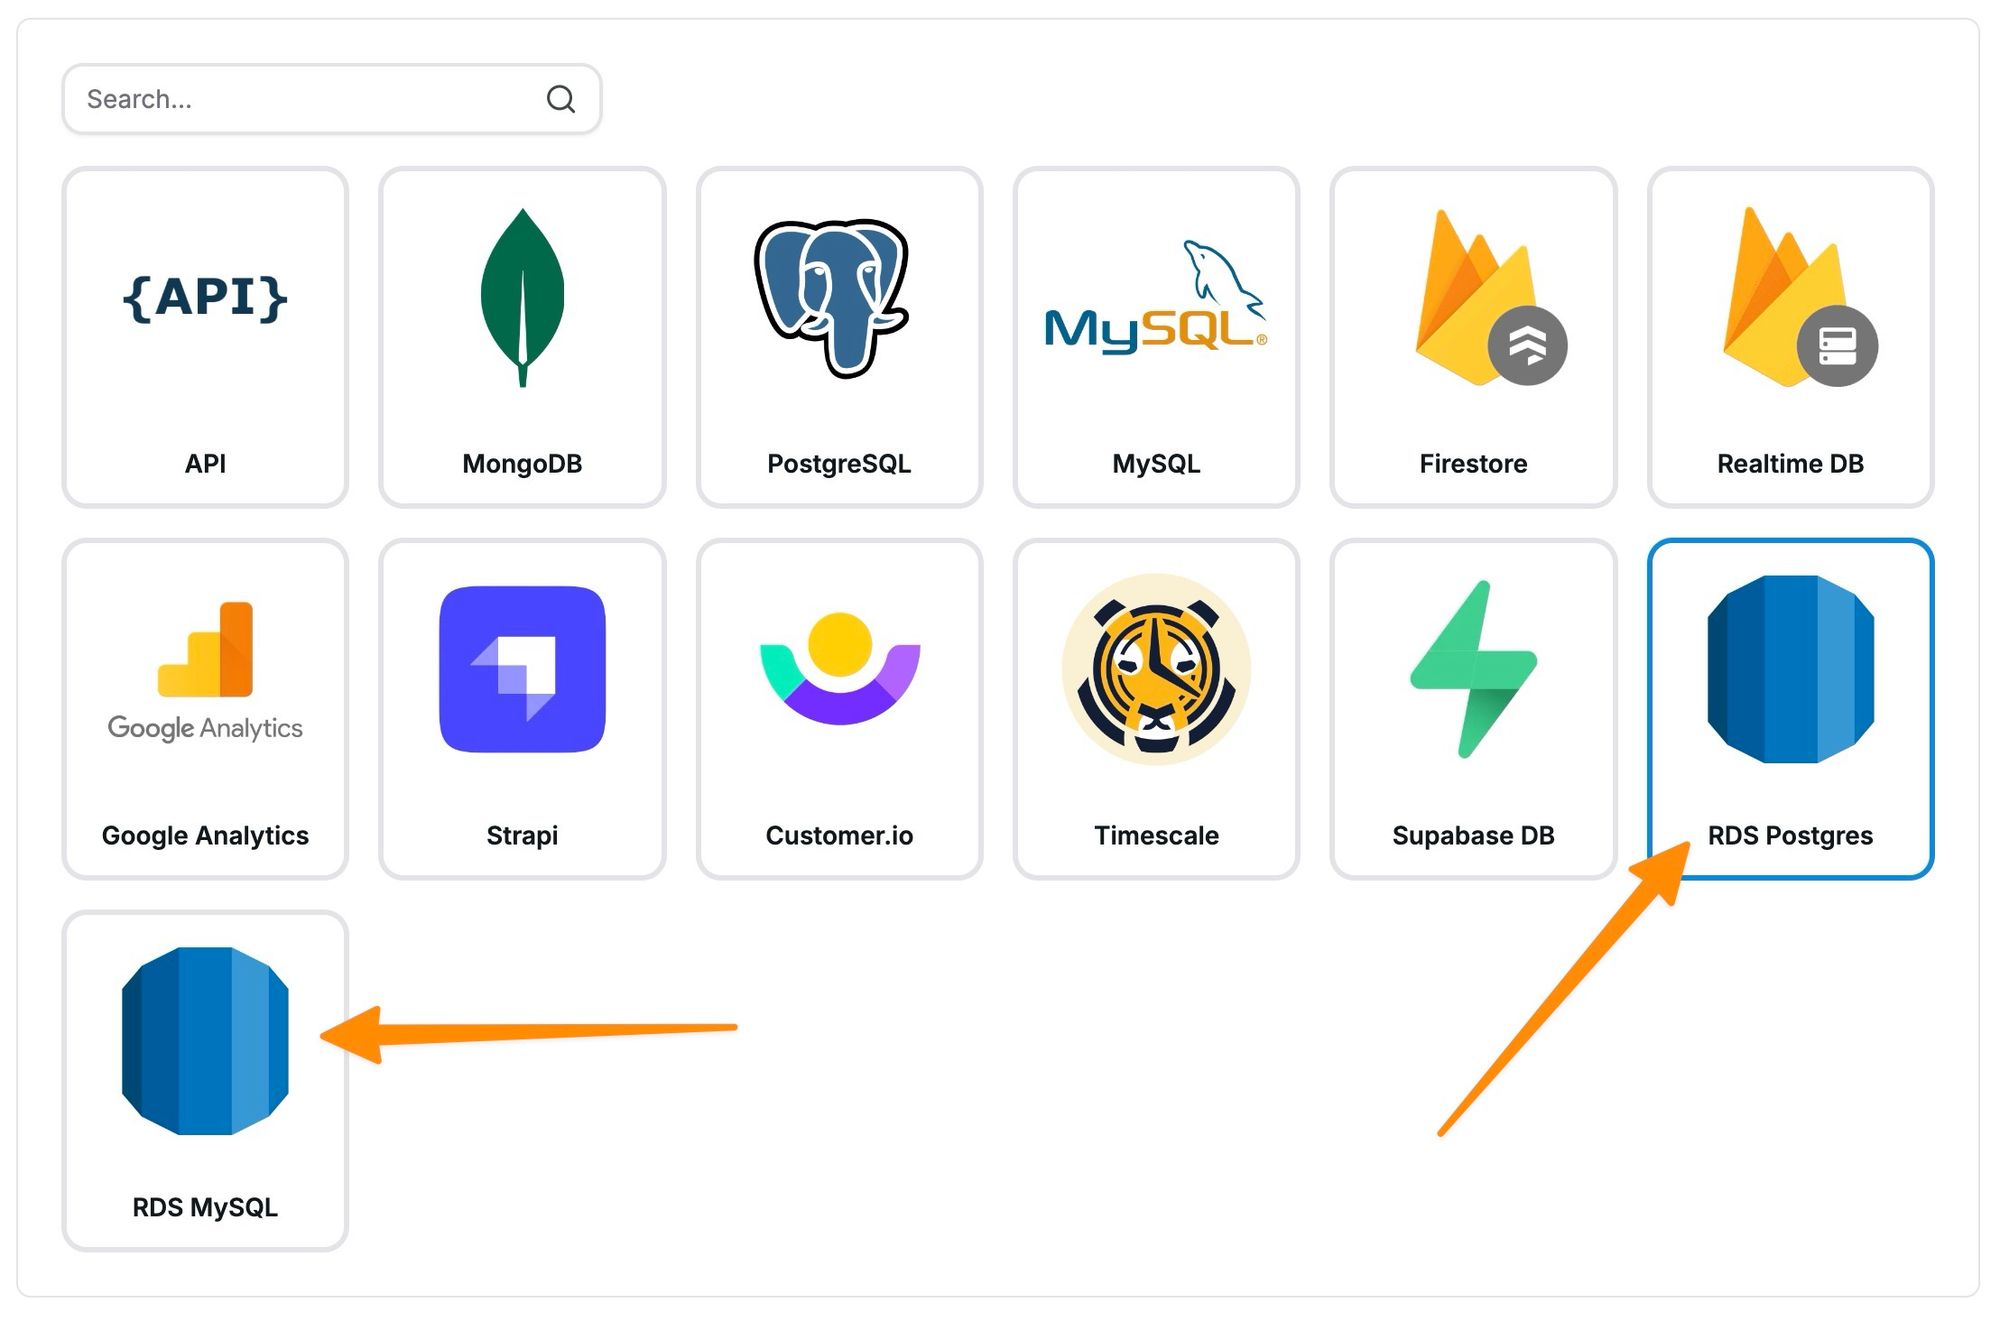
You can now switch to Chartbrew and create a new RDS connection. You can choose the Postgres and MySQL variants.
The Postgres variant works with:
- PostgreSQL
- Aurora (PostgreSQL Compatible)
The MySQL variant works with:
- MySQL
- MariaDB
- Aurora (MySQL Compatible)
In this example, we are going to show how to connect to a Postgres instance, but you can follow the same instructions for MySQL too.
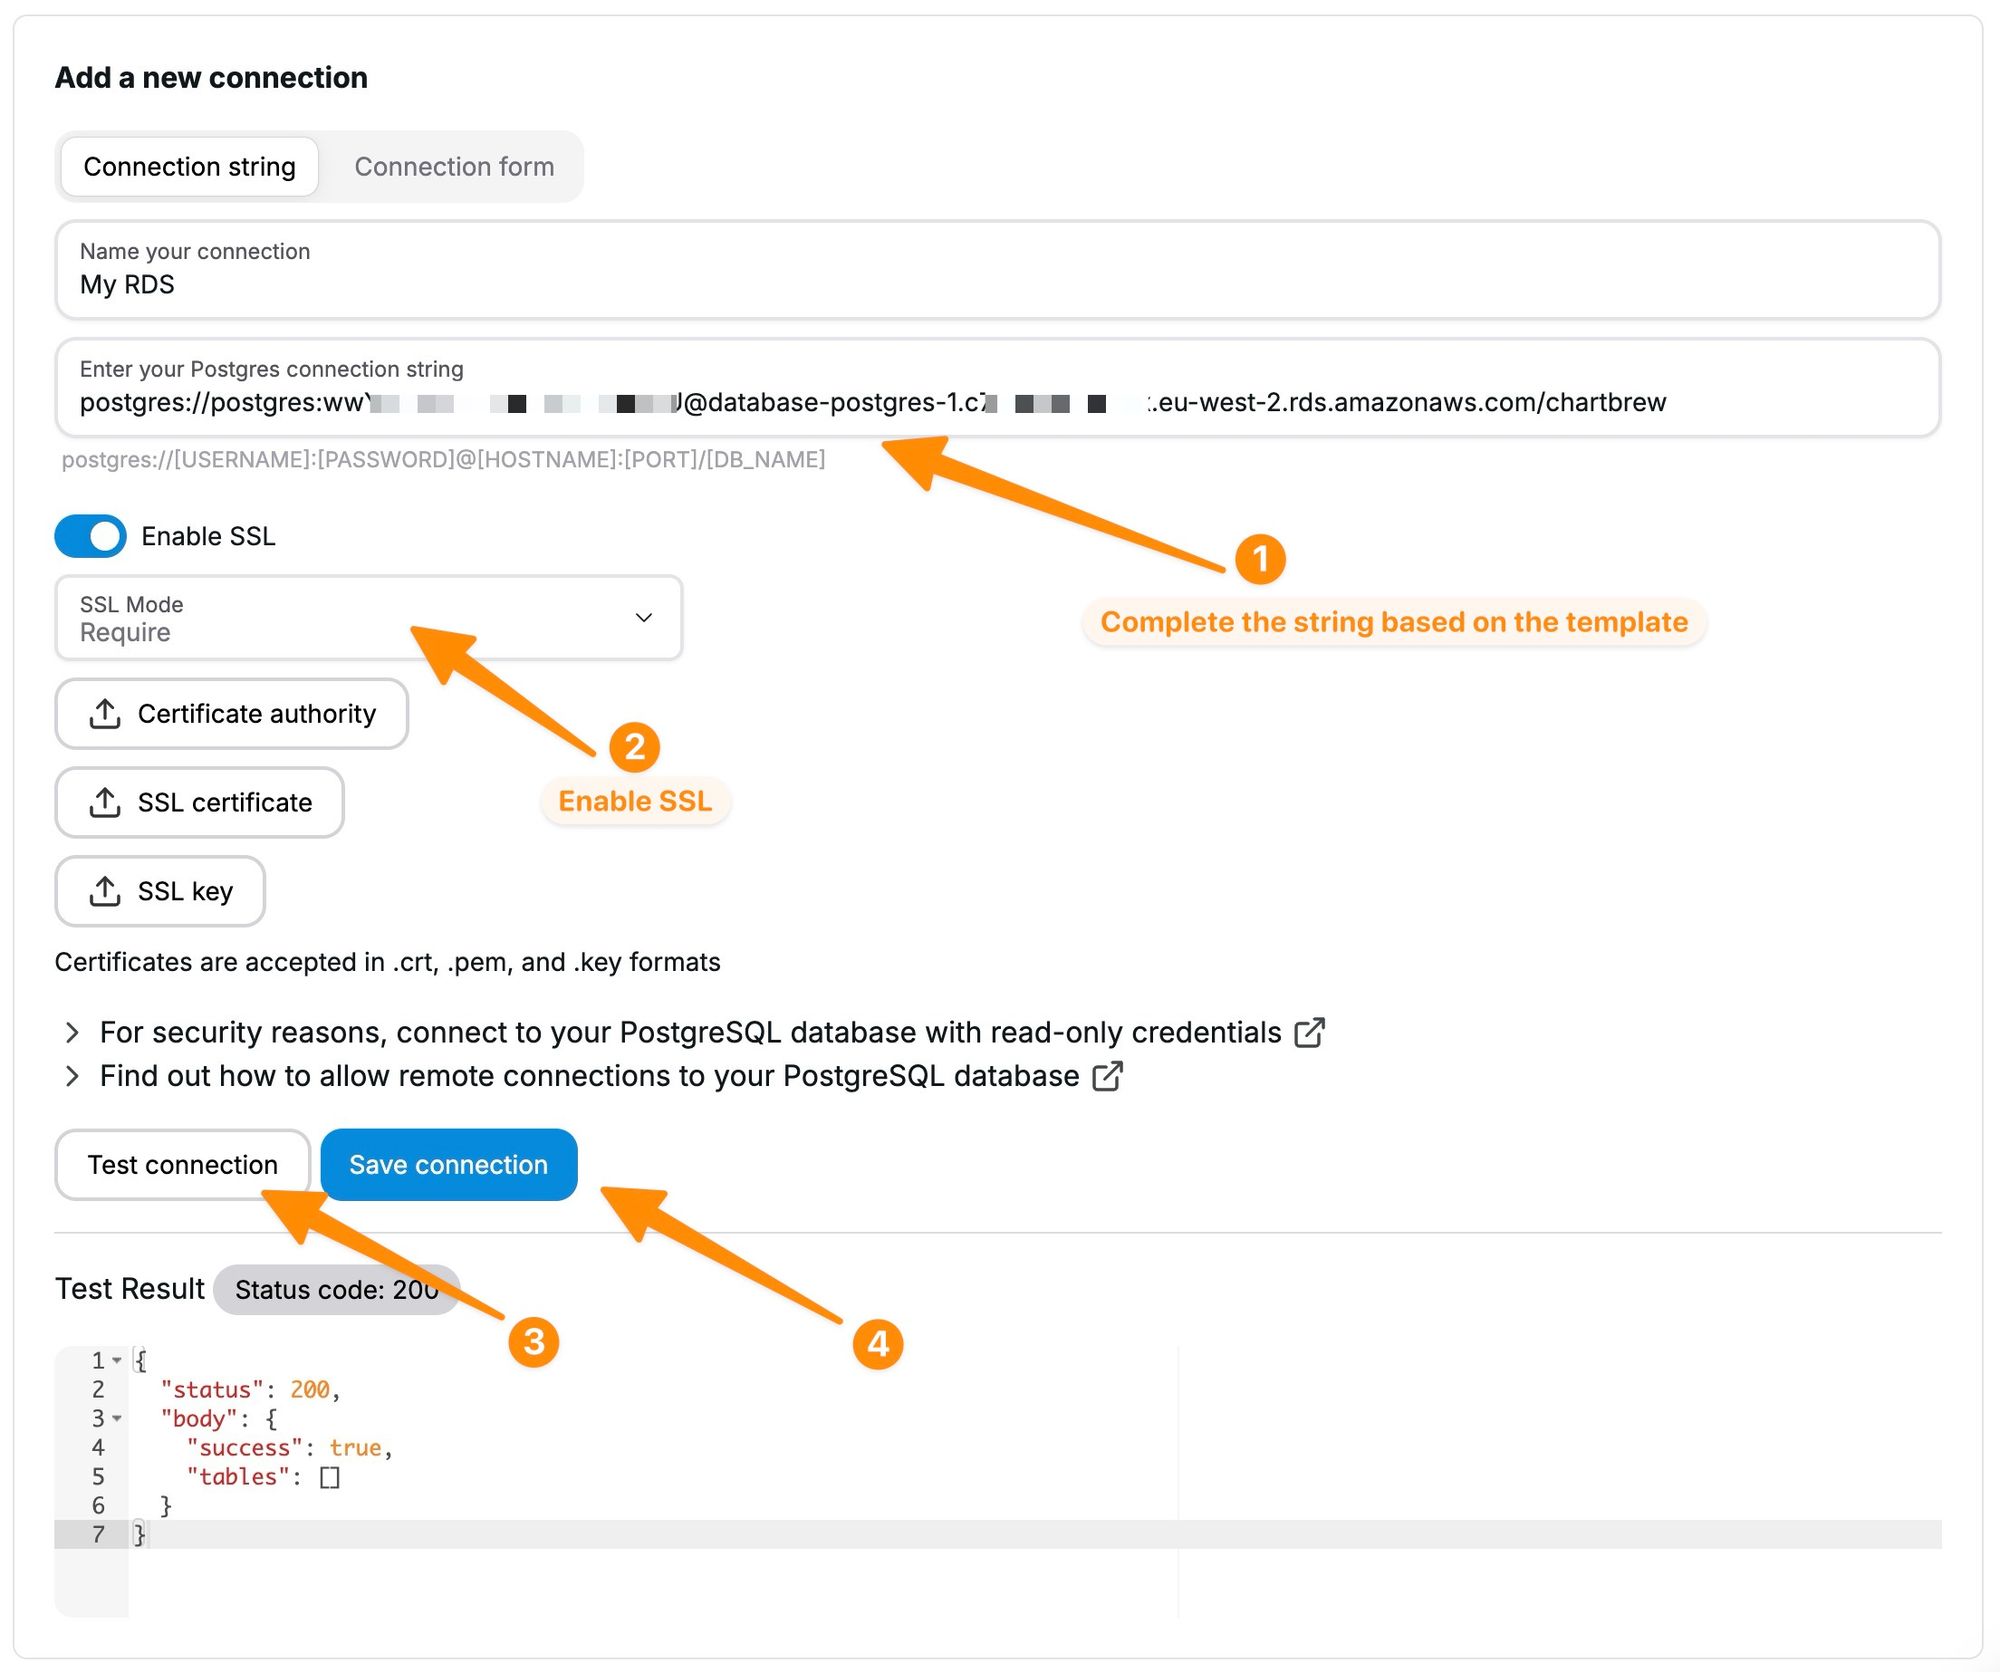
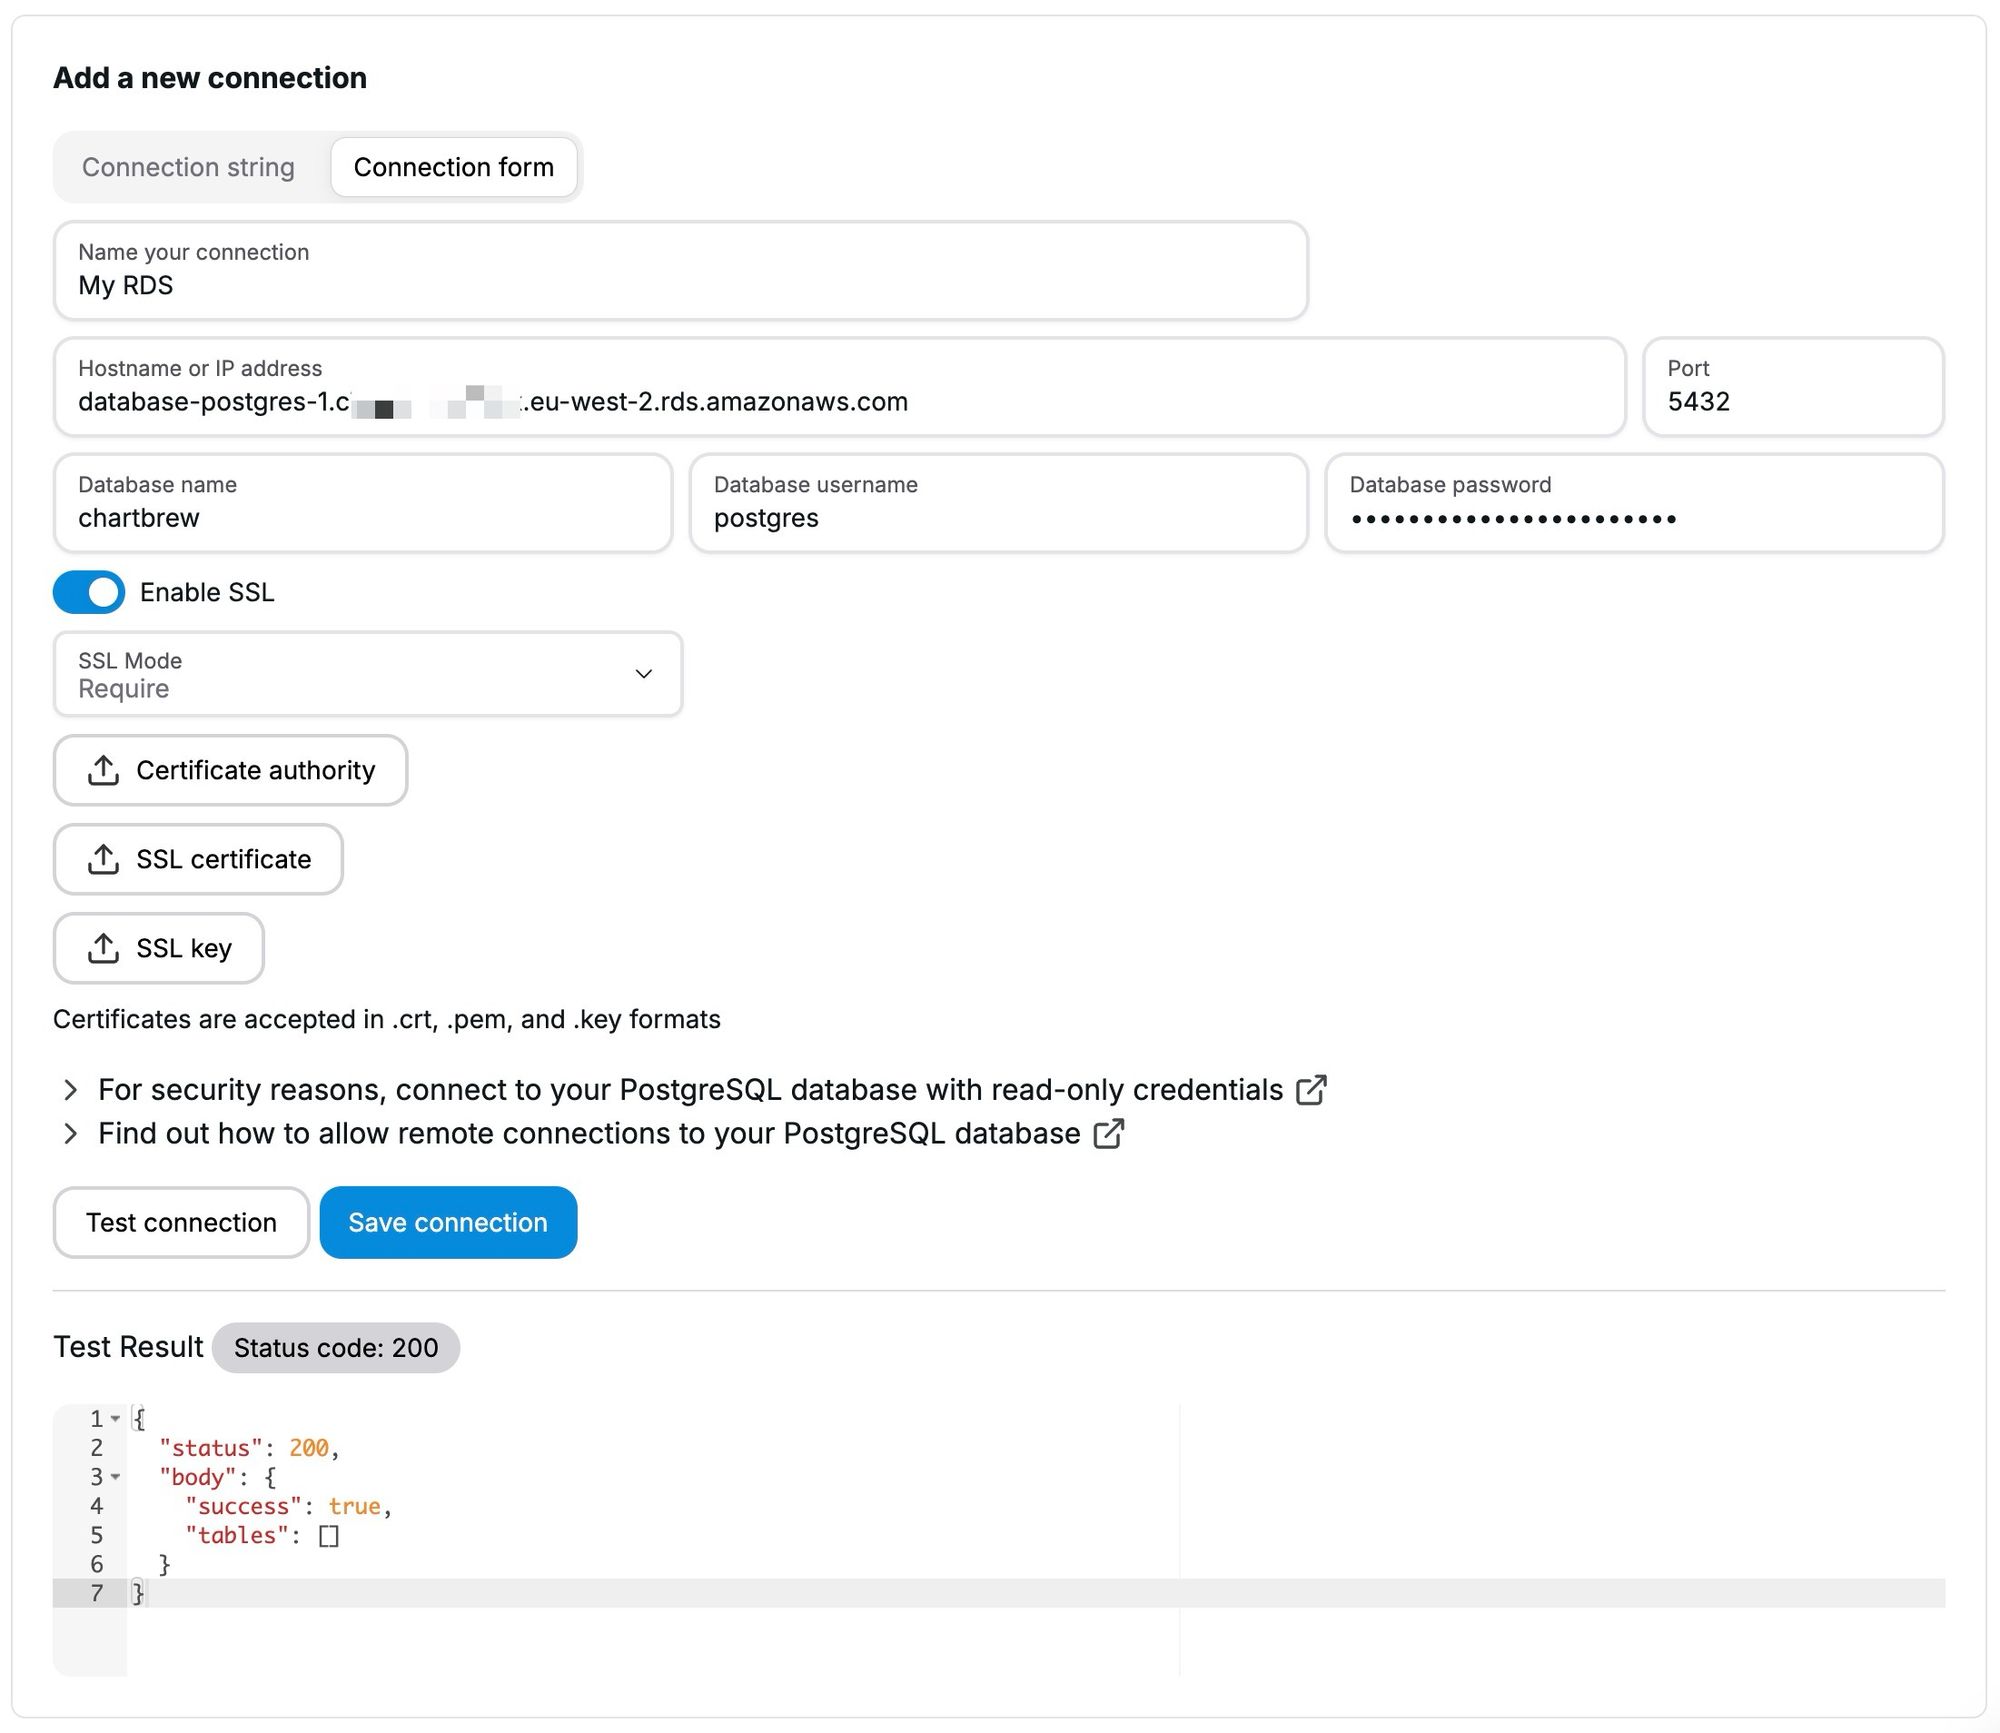
Chartbrew's UI will allow both connection strings and a connection form. Use the instance details to fill the forms, test to see if the connection is successful, and then save the final connection for creating datasets.
Connection string example:
Connection form example:
Next steps - Visualize your Amazon RDS data
Once your Amazon RDS database is connected to Chartbrew, you're all set to unleash the power of data visualization. While this guide has walked you through the process of connecting your RDS database, creating impactful and insightful visualizations is a journey of its own.
For those using PostgreSQL or MySQL, we've crafted detailed tutorials that dive deep into the nuances of visualizing data from these databases. These guides will provide you with step-by-step instructions on leveraging Chartbrew's features to the fullest, ensuring that your data not only informs but also engages.
PostgreSQL Users: Refer to our comprehensive guide on visualizing PostgreSQL data with Chartbrew for advanced tips and tricks.
MySQL Users: Our dedicated tutorial for MySQL data visualization in Chartbrew will help you unlock the full potential of your datasets.
Both resources are packed with valuable insights on customizing your charts, using filters effectively, and much more. They are designed to help you make the most out of your Chartbrew experience, enabling you to create visual representations that are not just informative but also visually appealing.
Start exploring now and transform your data into compelling stories!
If you don't already have a Chartbrew account or are self-hosting the platform, you can get started by following the links below:
