Creating a time series chart from API data - Tutorial
EDIT 2nd of November 2020: This tutorial was edited for Beta.13
In this tutorial we are going to create a chart out of Chartbrew's GitHub repository data by connecting to GitHub's API. If you haven't yet done so, create a Chartbrew account and let's get started!
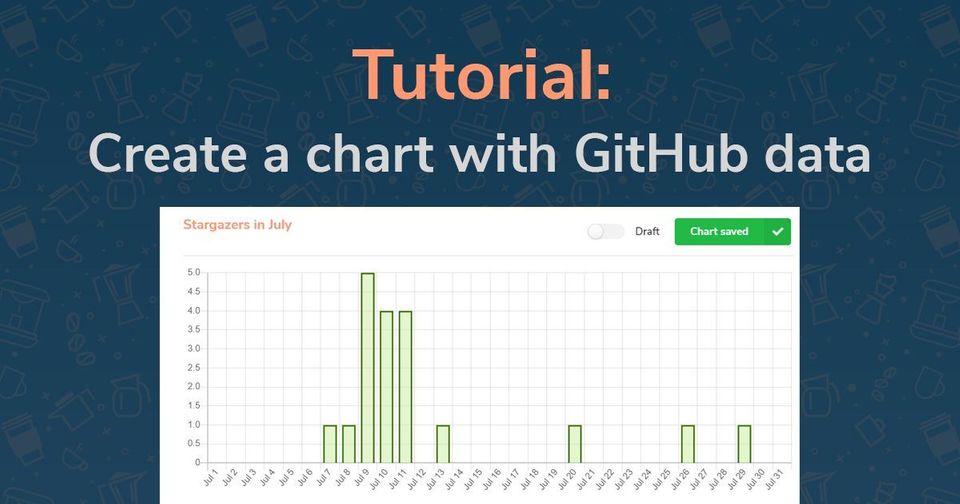
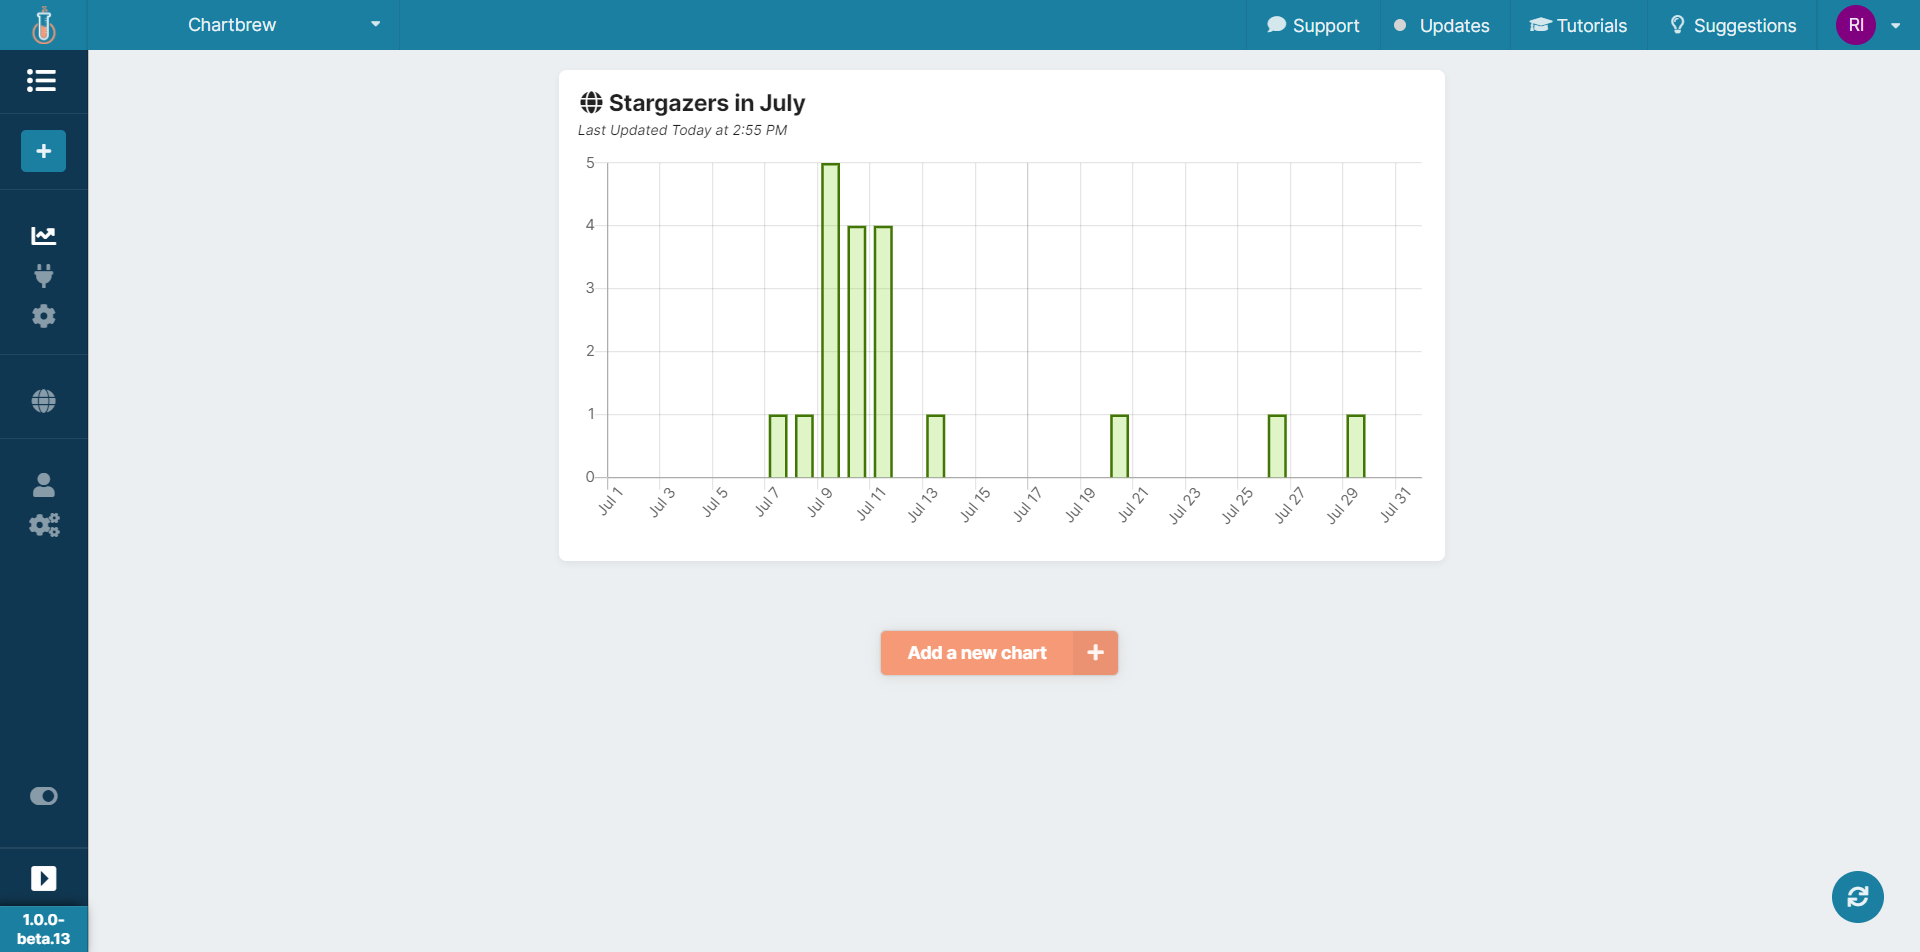
The final chart will look something like this:
Setting up the connection
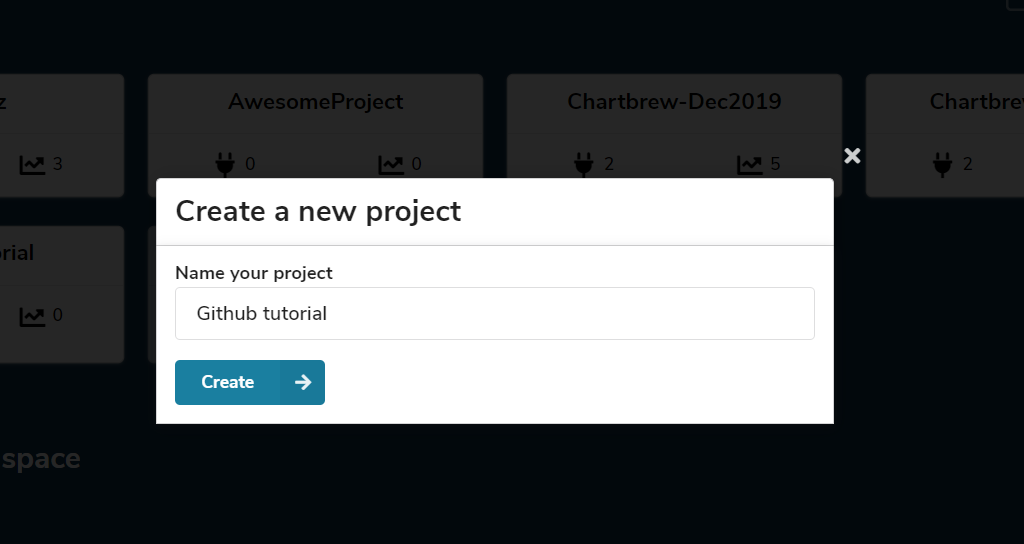
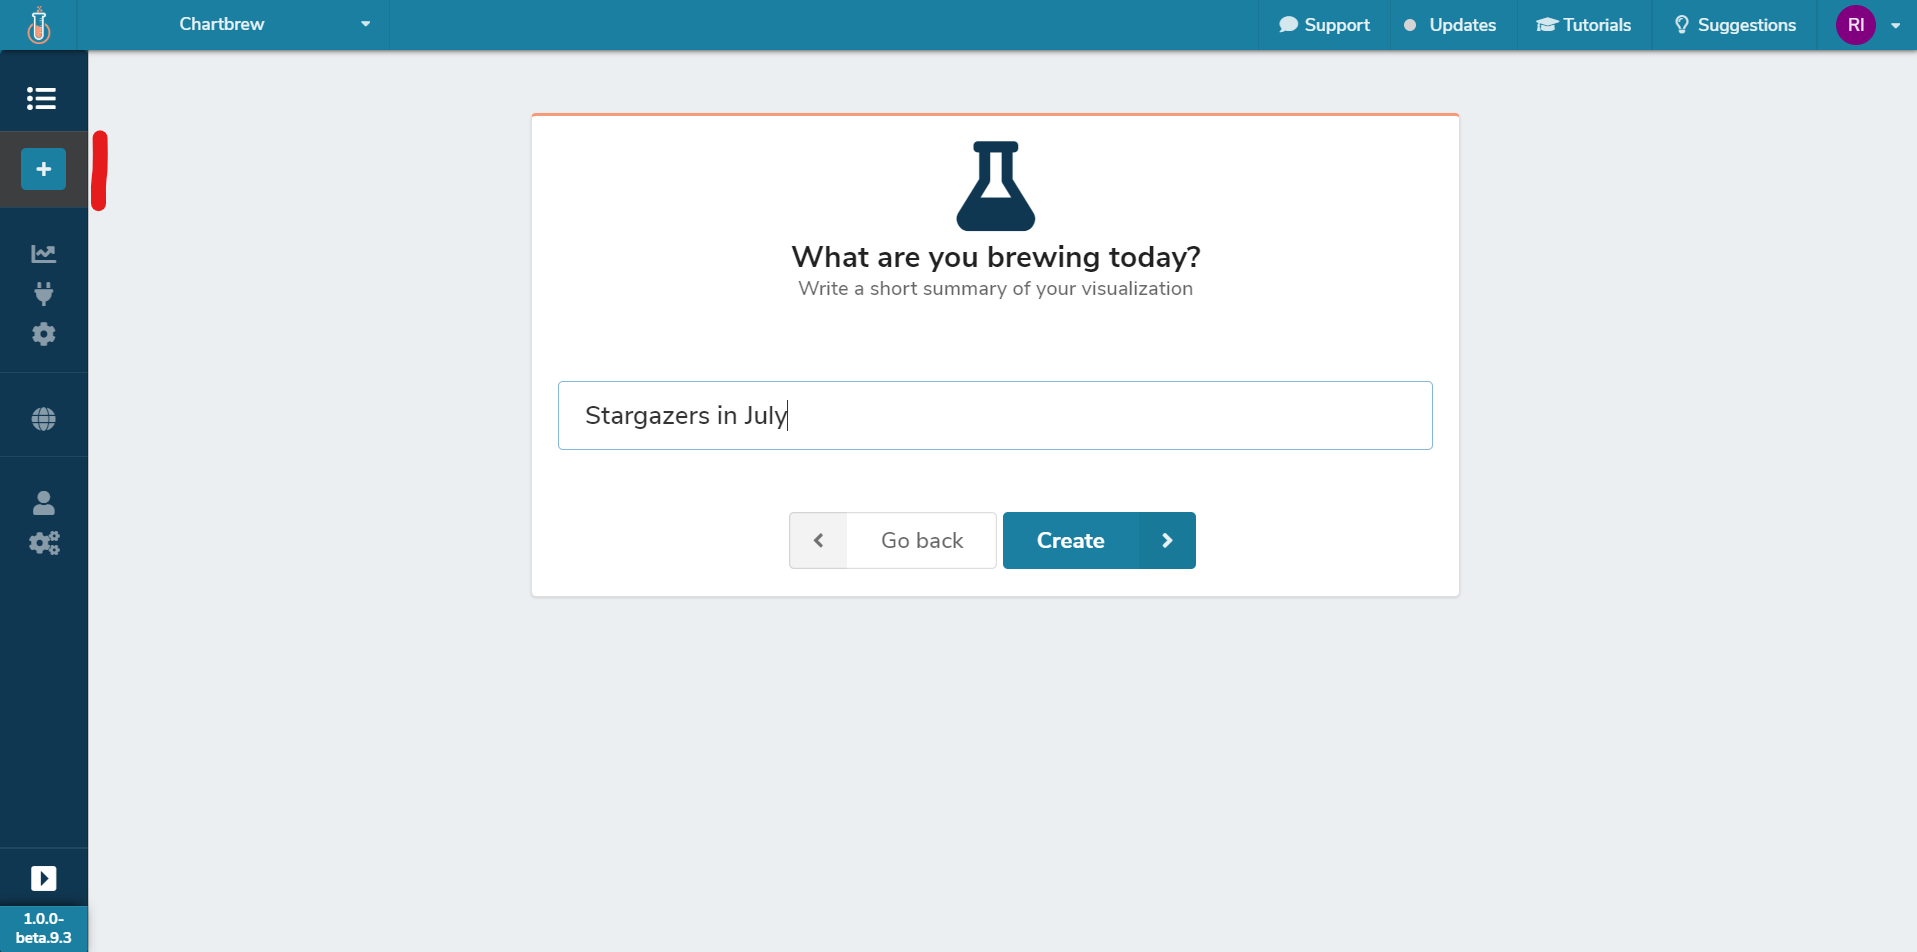
First, we need a project. You can create a new one or just use a project you have already:
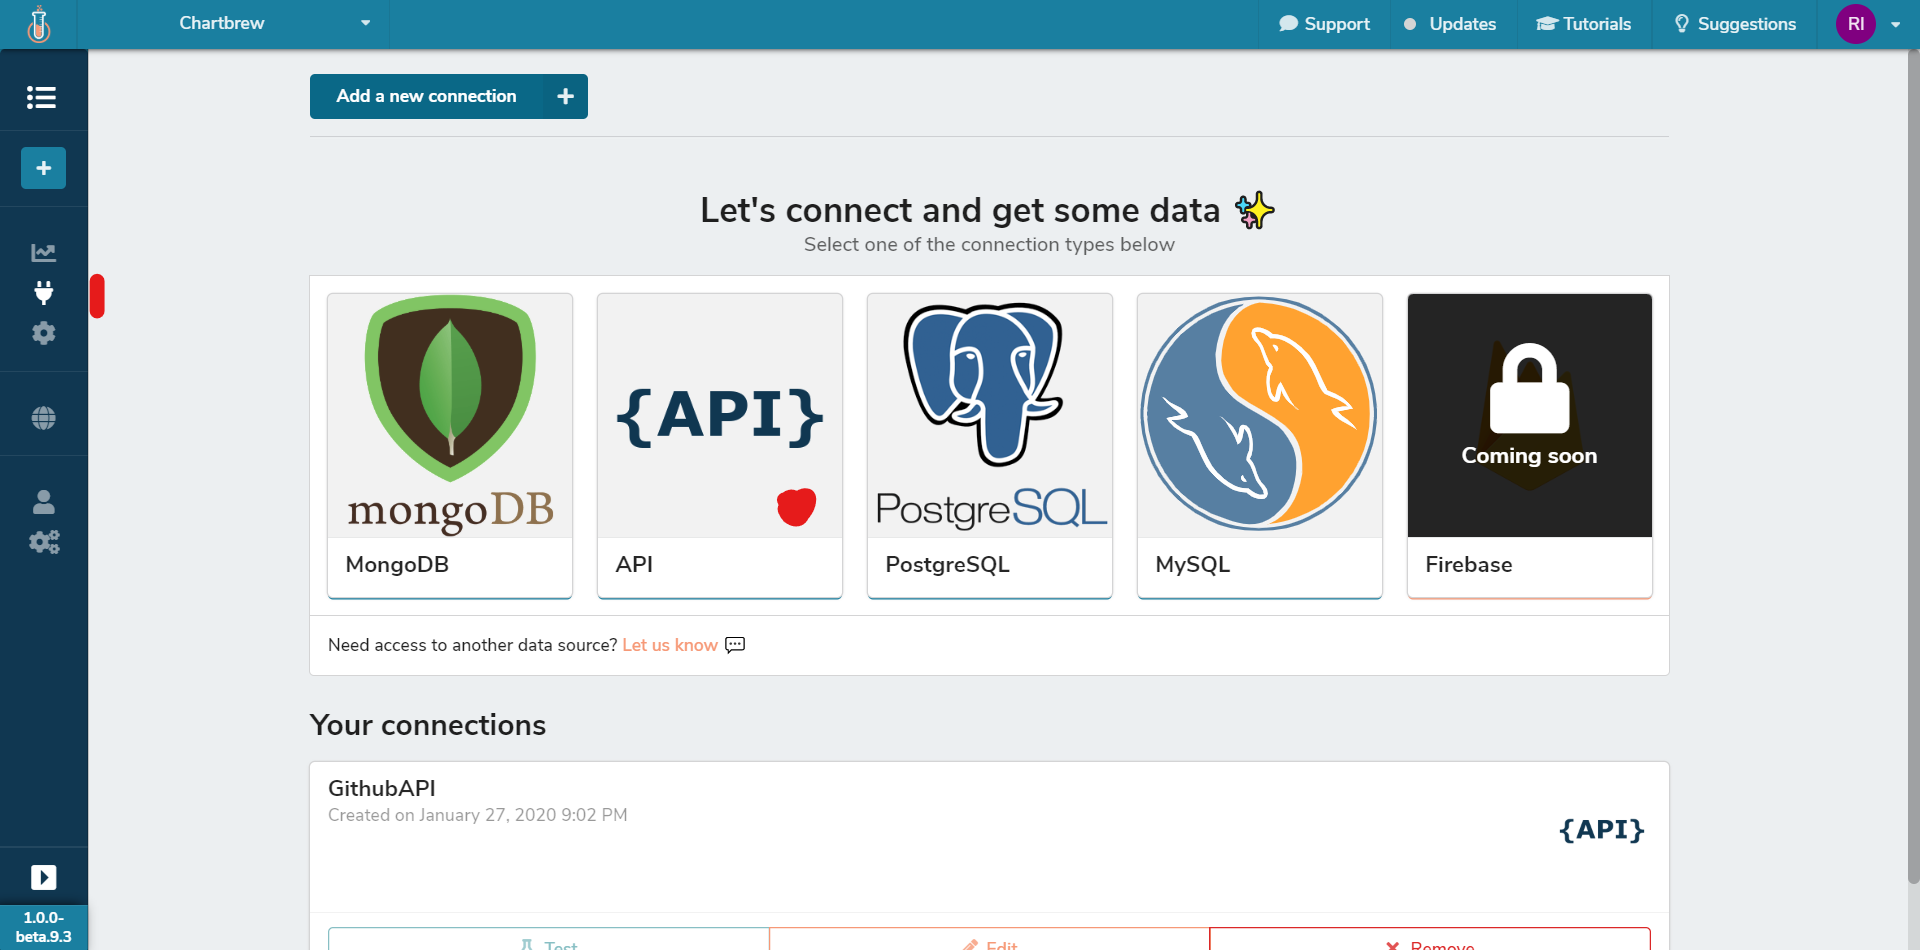
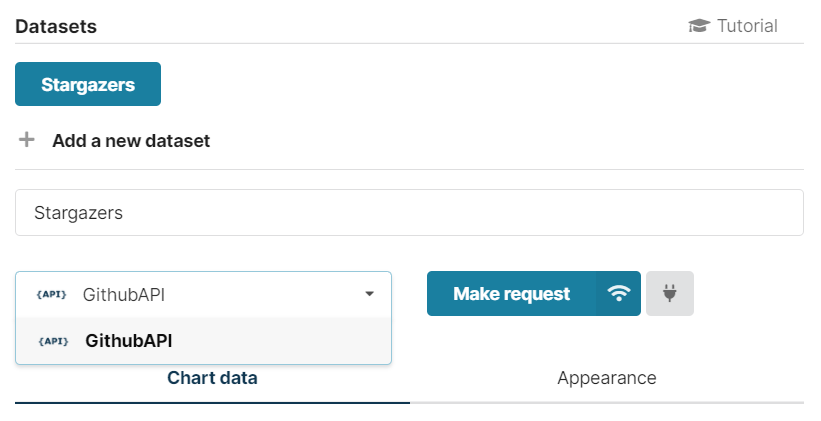
Next, we have to set up a connection to the Github's API. Click on the Connections menu option from the left navigation bar and then click on the API option to create the connection.
In this tutorial we are using Chartbrew's repository, but feel free to use any open-source one. Private repositories can be used as well, but you will need to authenticate the requests.
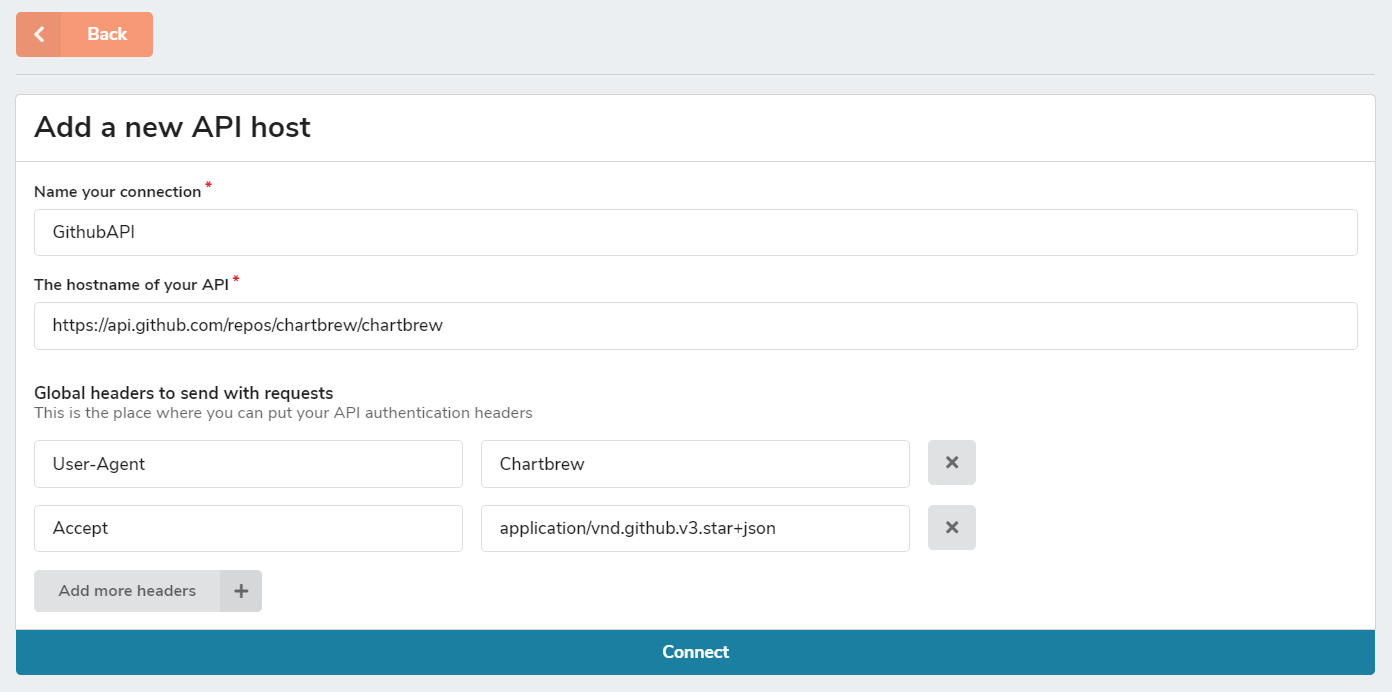
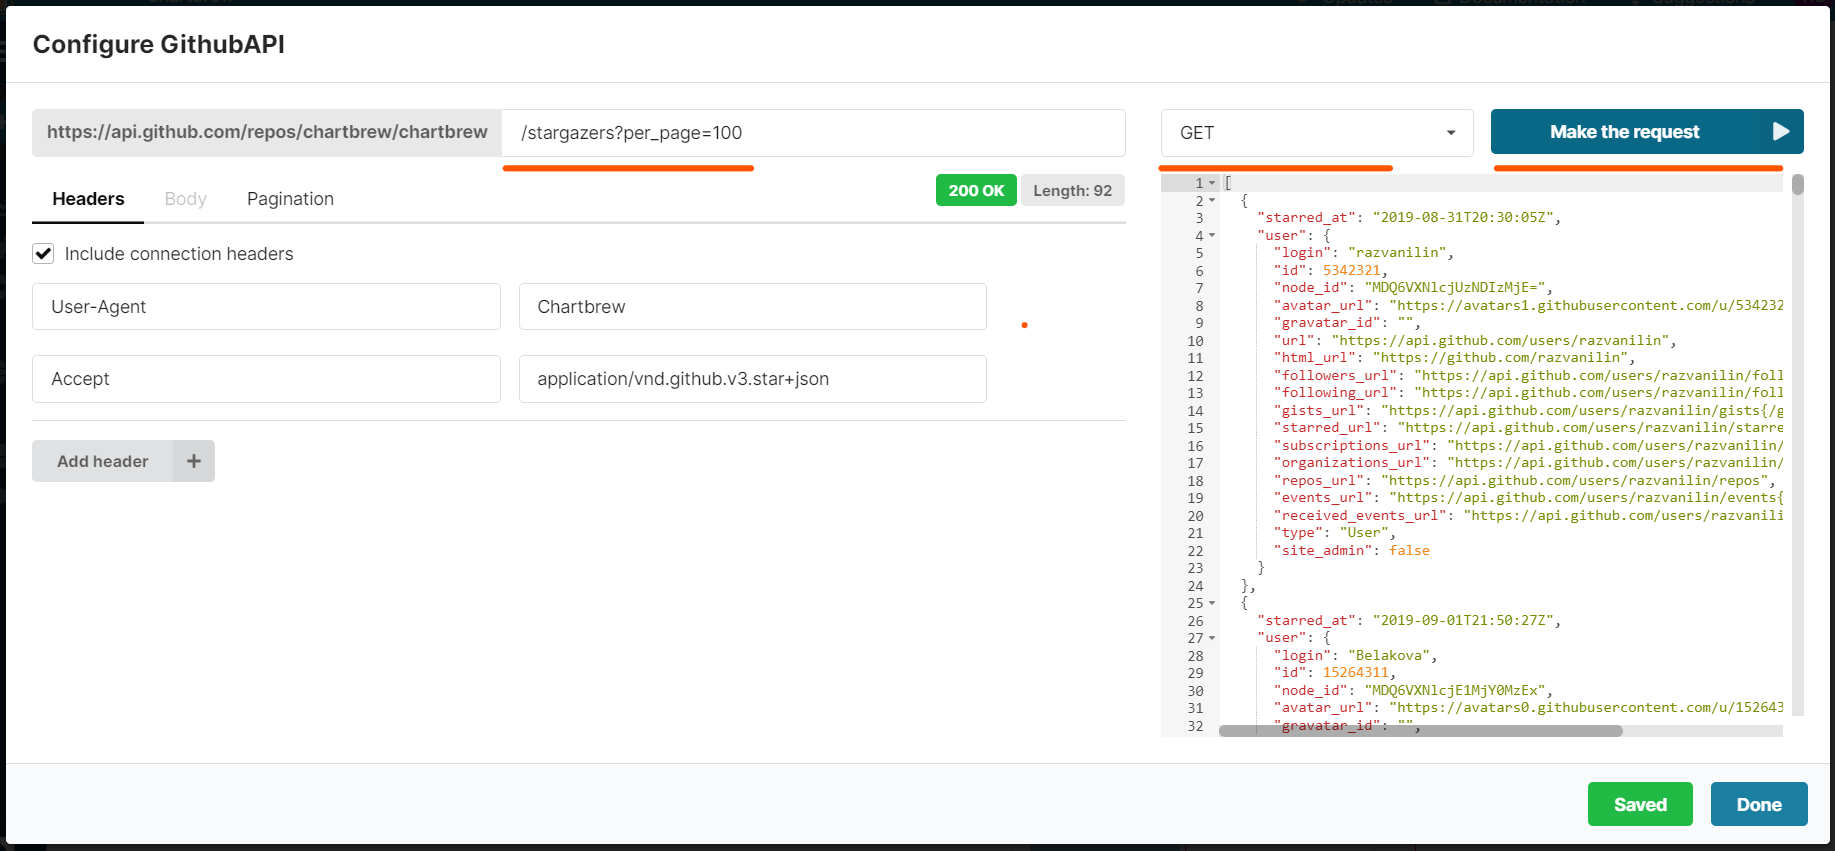
The name of the connection can be anything that makes it easier for you to remember what it stands for. The hostname is used all the time when you make a new request to get data. In this case I chose to go with the API endpoint plus the chartbrew repository path. The two headers I included are required by Github in order for the requests to succeed and get more detailed responses.
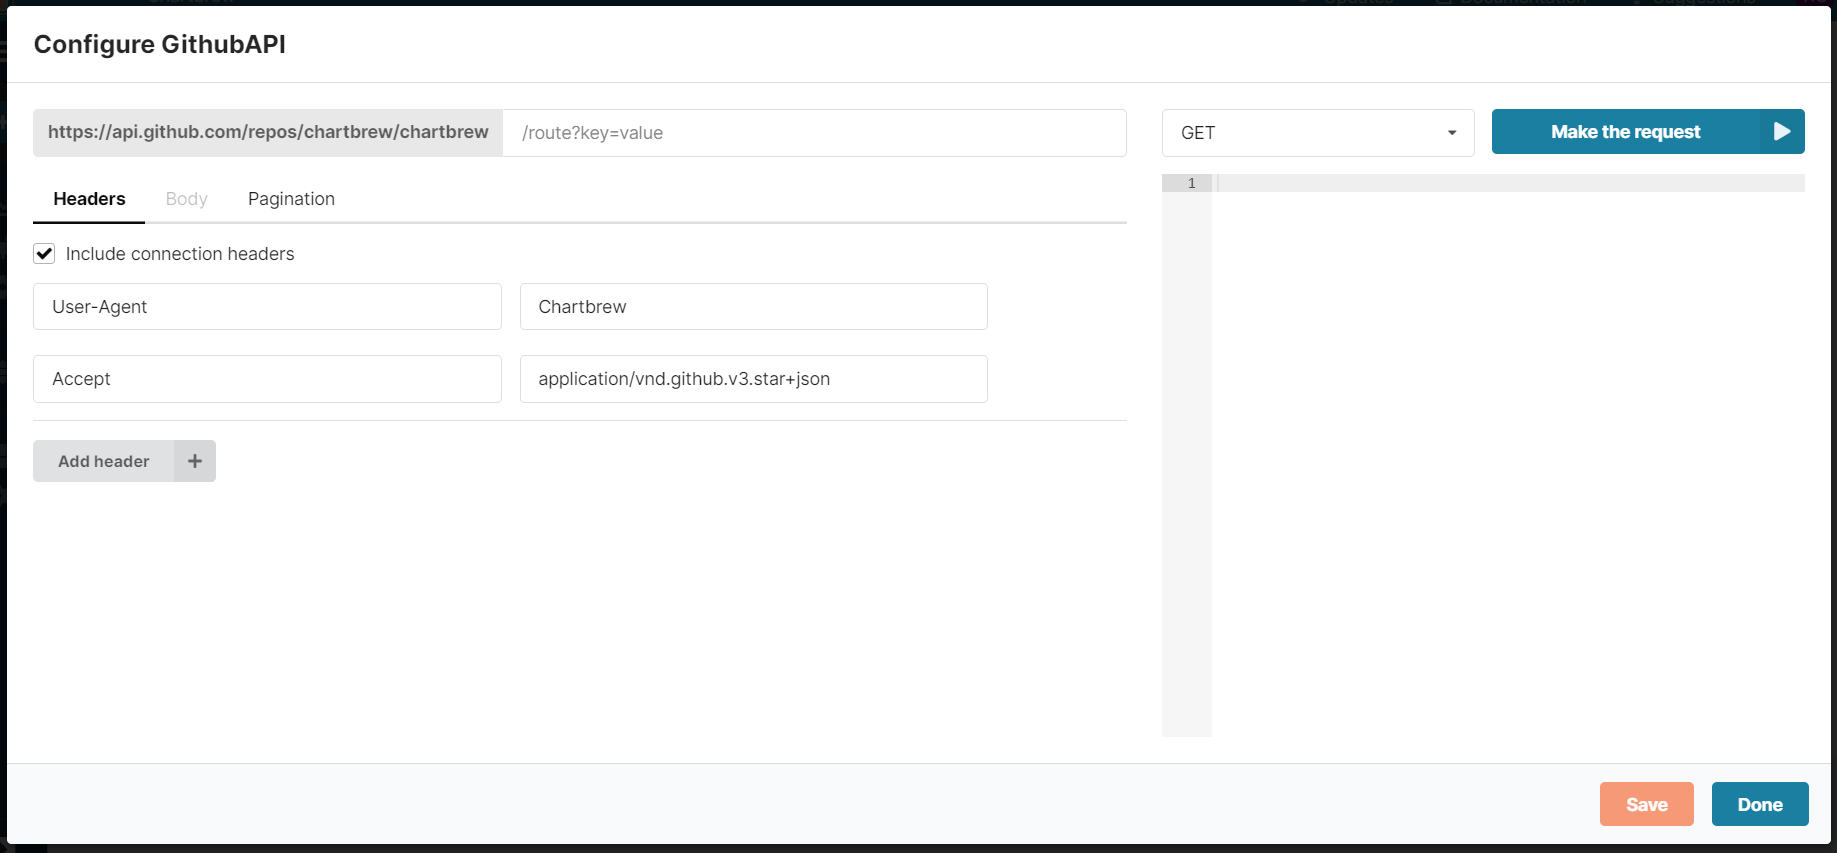
- Name:
GithubAPI - Hostname:
https://api.github.com/repos/chartbrew/chartbrew - Headers:
-
User-Agent: Chartbrew -
Accept: application/vnd.github.v3.star+json
Afterwards press Connect.
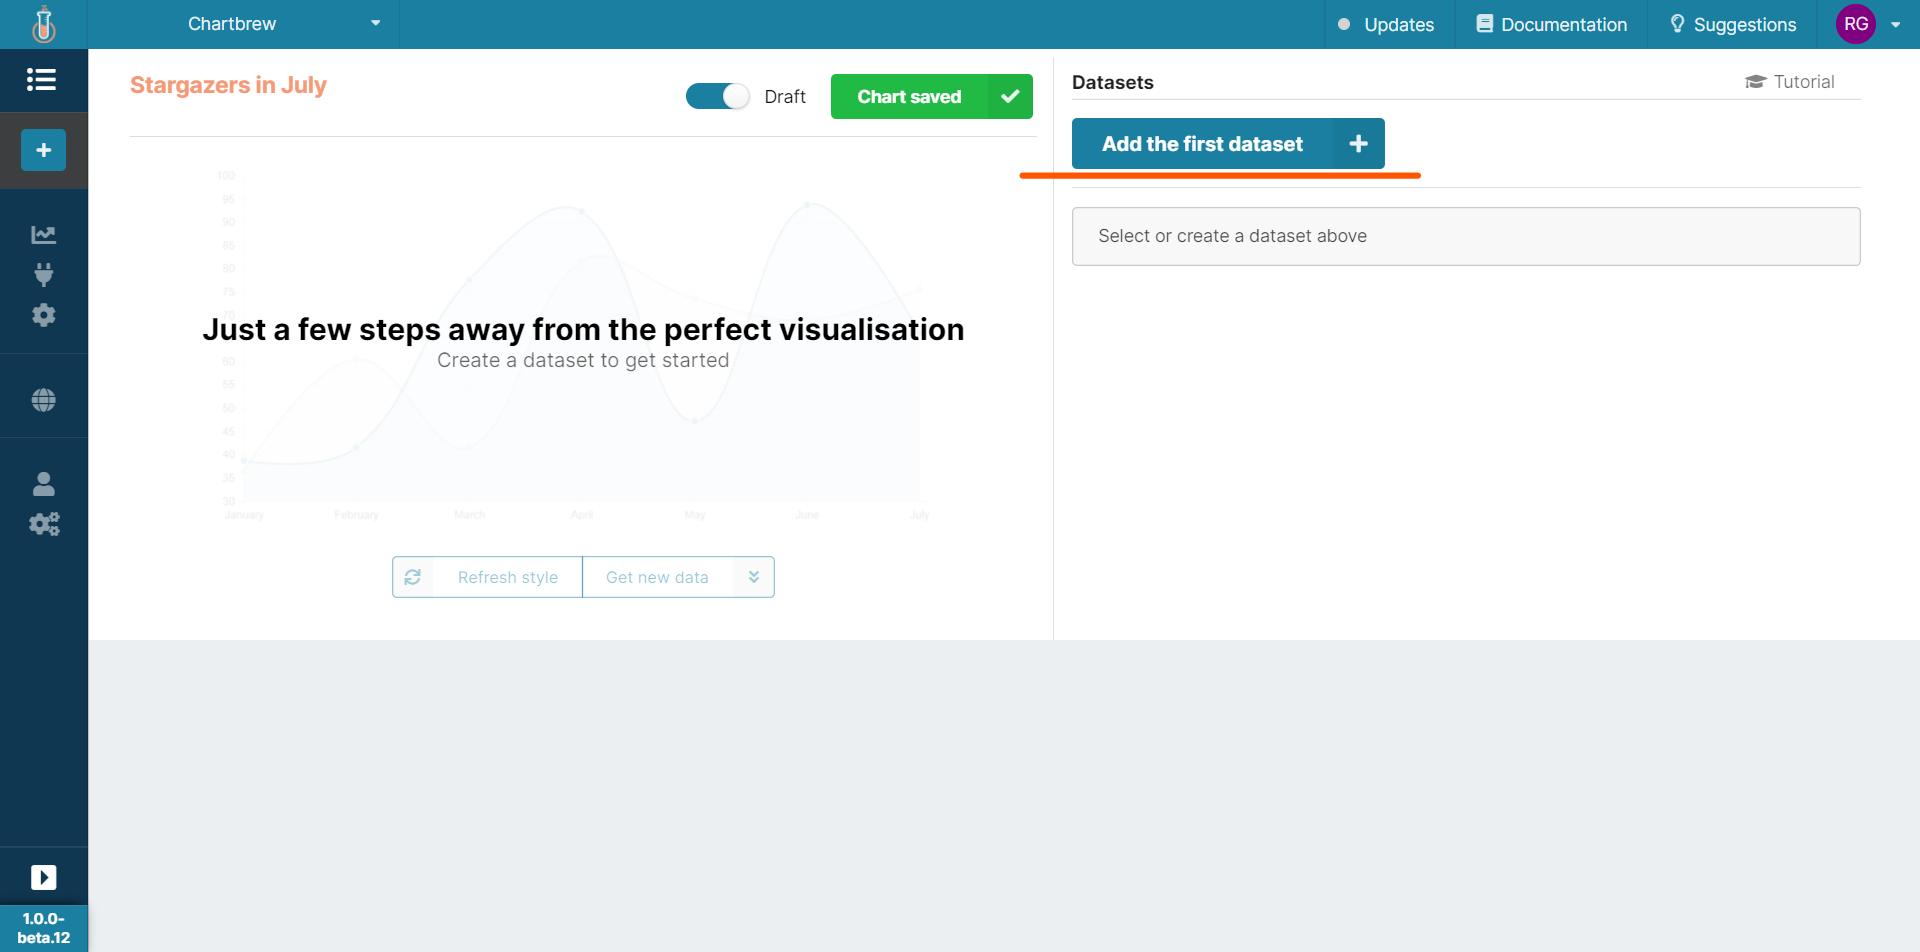
Creating the first chart
Now let's add our first chart by clicking on Add new chart in the left navigation bar. Our plan is to show the new stars received by the Chartbrew repository in July 2020. Follow the screenshots below to get this set up:
Next we are going to add the route in the text field at the top - "/stargazers". Github limits the number items fetched at once, so we also have to include the ?per_page=100 query parameter. That way we get all the stargazers in one go. Alternatively, you can also paginate the requests and get the data from multiple requests.
Press Done and you will be able to see your the chart in the preview section. The chart is automatically prepared for you because Chartbrew tries to auto-select optimal fields for your visualization. You can see which fields are auto-populated in the screenshot below.
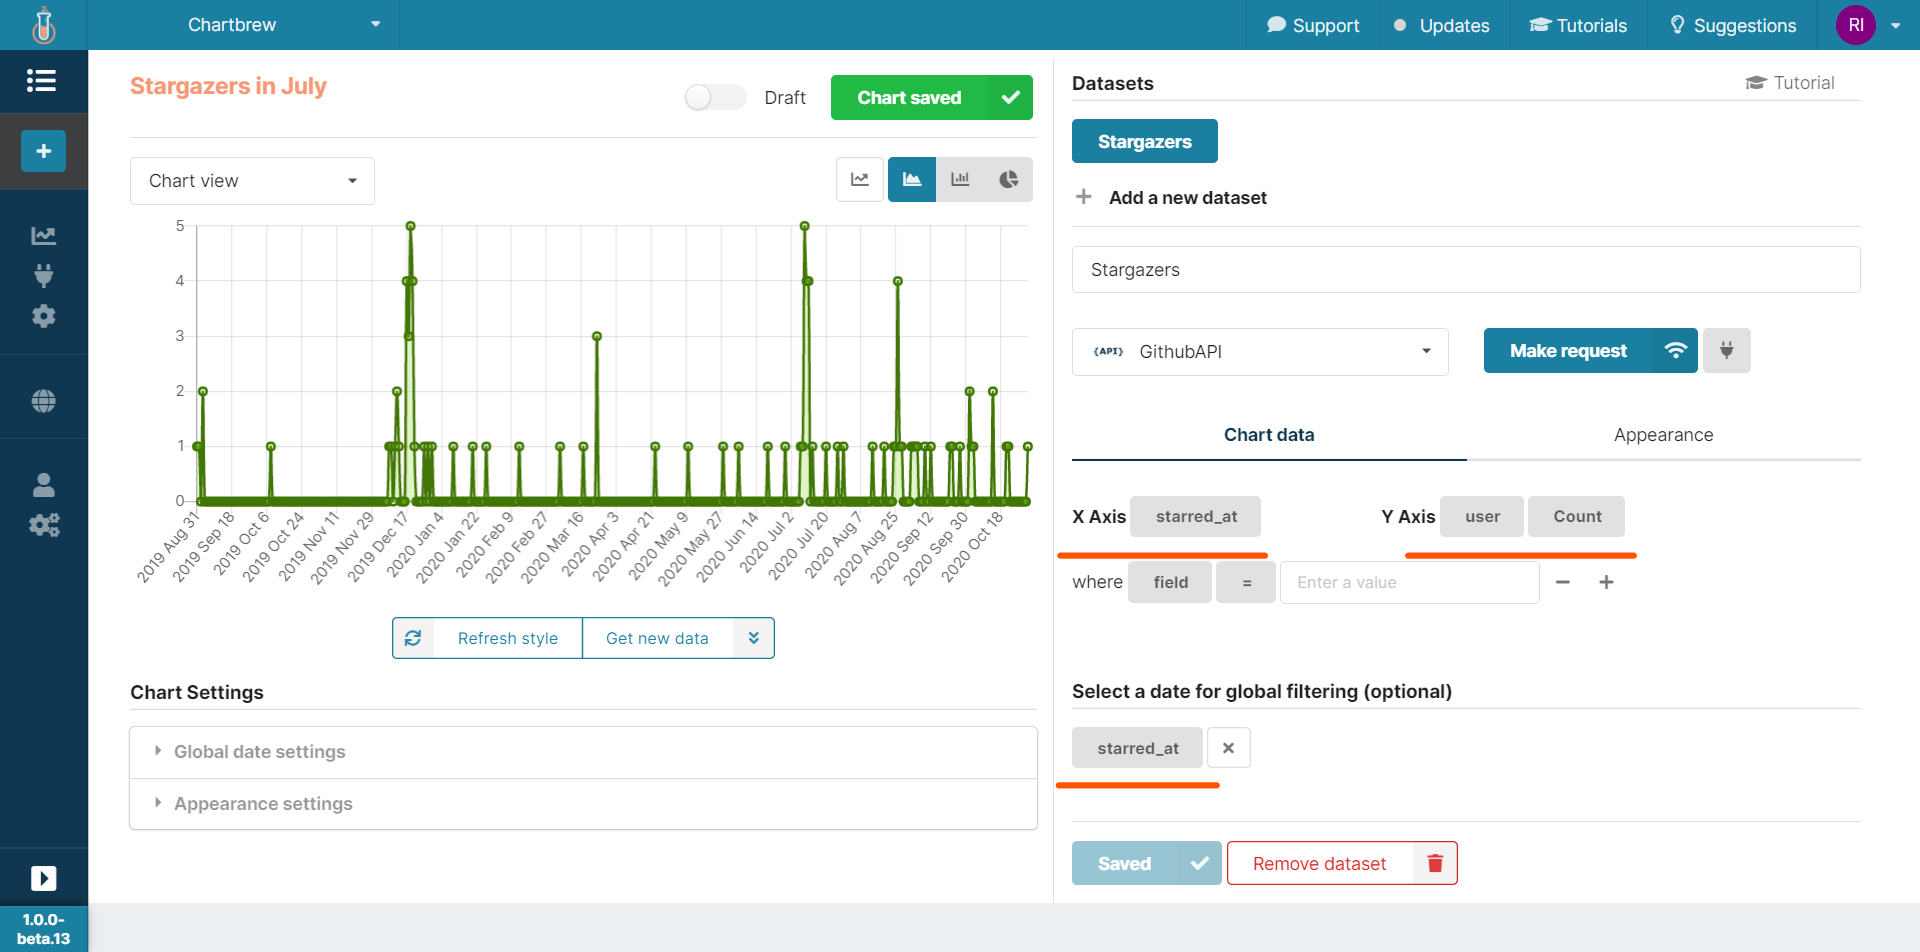
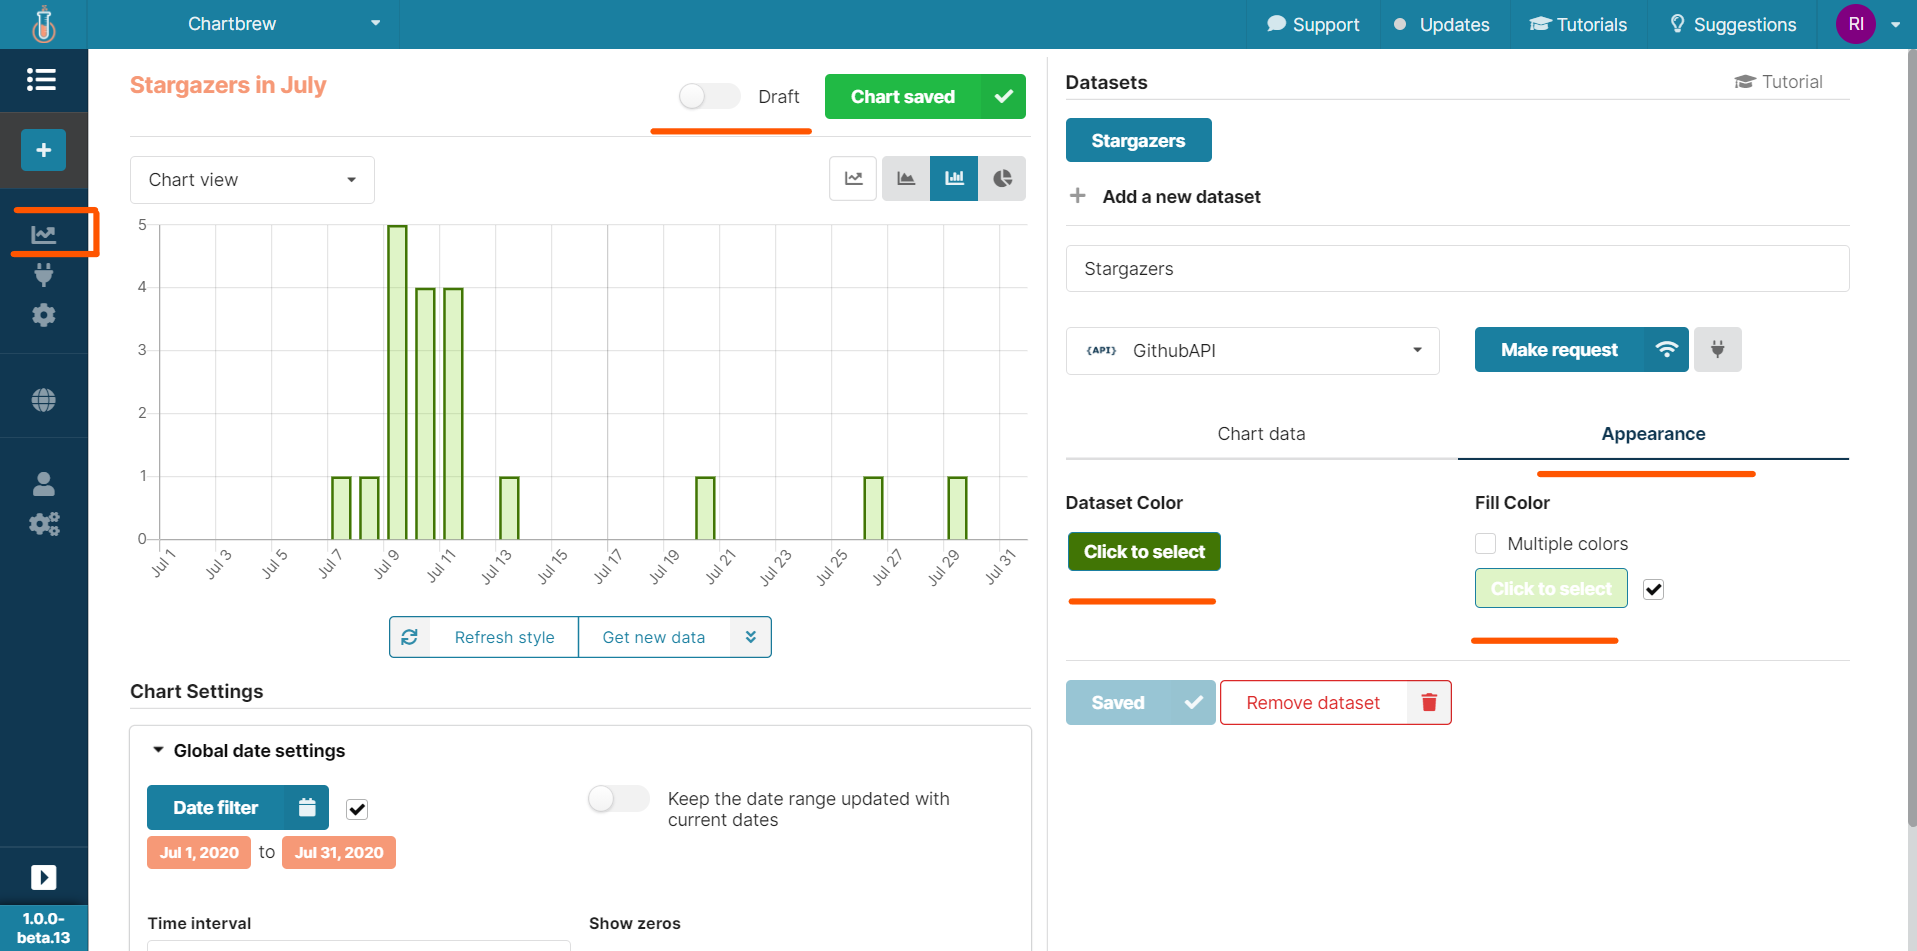
On the left side of the chart builder you can see the X & Y axes configuration and in this case they should already be populated.
Now it's time to select the type of the chart we want to generate. In this case, a bar chart could be more suitable, so click on the bar chart icon above the chart preview like in the screenshot below:
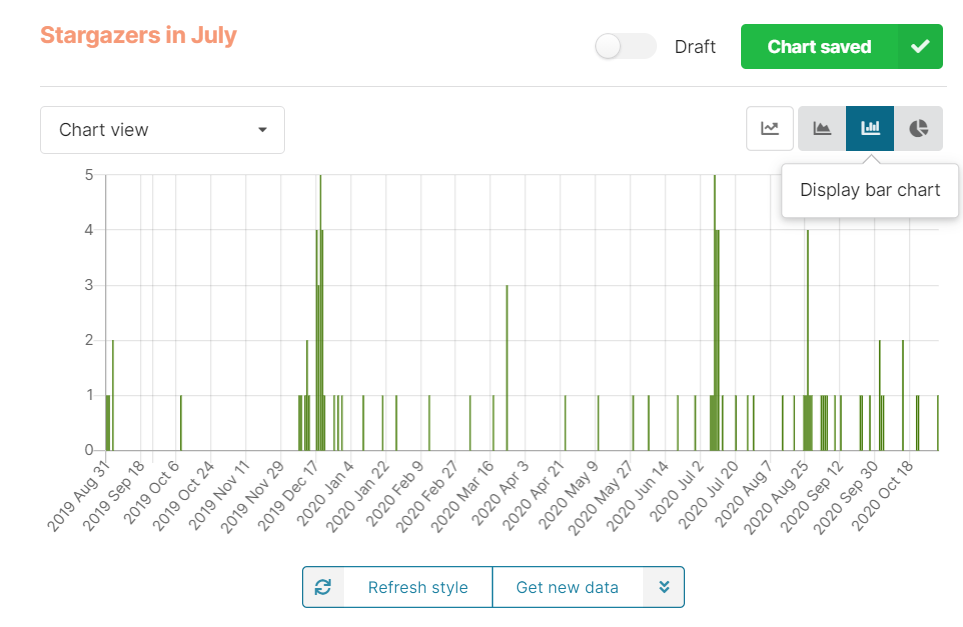
And now we have the time series bar chart showing in the chart preview section, but still looks quite messy.
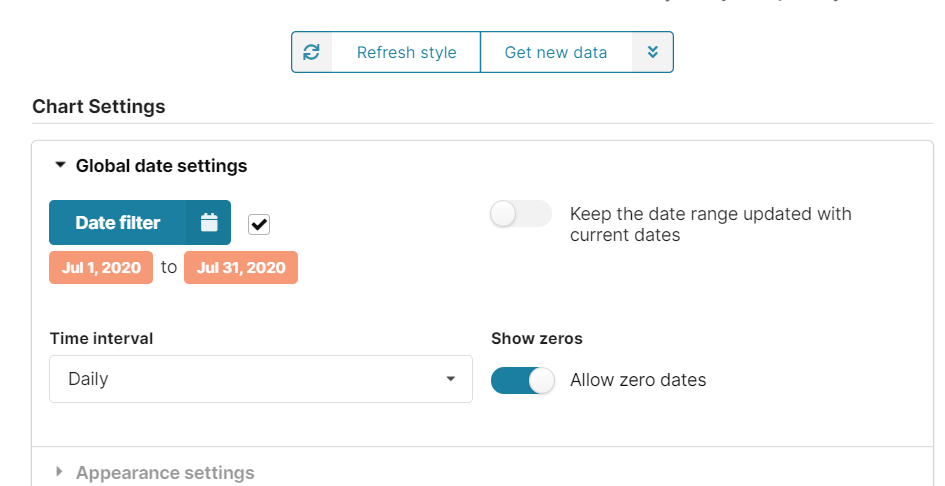
Remember that our goal was to display the stars accumulated in July 2020. At the moment the chart shows all the stars. Expand the Date Settings section to add a date range for our chart:
You can then play around with the colours if you wish and when you are want to finish the editing toggle the draft off and head over to the dashboard. The draft status is ON by default to be able to hide them easily from the dashboard if required.
Conclusion
And this is how you can use Chartbrew to chart data from different API sources. Note that this only works with APIs that return JSON data at the moment. Some API connections will need to be authenticated, so make sure you add any authentication headers or query parameters as requested by the API documentation you are using.
If you have further questions or suggestions, feel free to join our Discord or Slack communities and we can get back to you there.
Want to give it a go? Register for a Chartbrew account and try it now for free ?
Follow Chartbrew on Twitter for the latest news and tutorials!
