
Timescale is a great service where you can create PostgreSQL databases for high-performance analytics and time series. They have a handy cloud service where you can set up a database in a couple of minutes and you can use your new database right away.
For this tutorial, I went ahead and created a new database on Timescale Cloud, and seeded it with one of the sample datasets I could find in the documentation. Using this sample, I created a simple dashboard in Chartbrew with time series charts and metrics. Follow along to see how you can connect your very own TimeseriesDB to Chartbrew.
Prepare Timescale with a sample dataset
🙋
Feel free to skip this step if you want to connect your existing DB to Chartbrew and not use the sample dataset.
If you haven't already, create a new account for Timescale Cloud and proceed with creating a new instance of TimescaleDB or PostgreSQL database. When you create the first service, you will see a deployment window that includes the connection string for the database. Copy the part that starts with postgres:// but make sure you don't copy the quotes too.
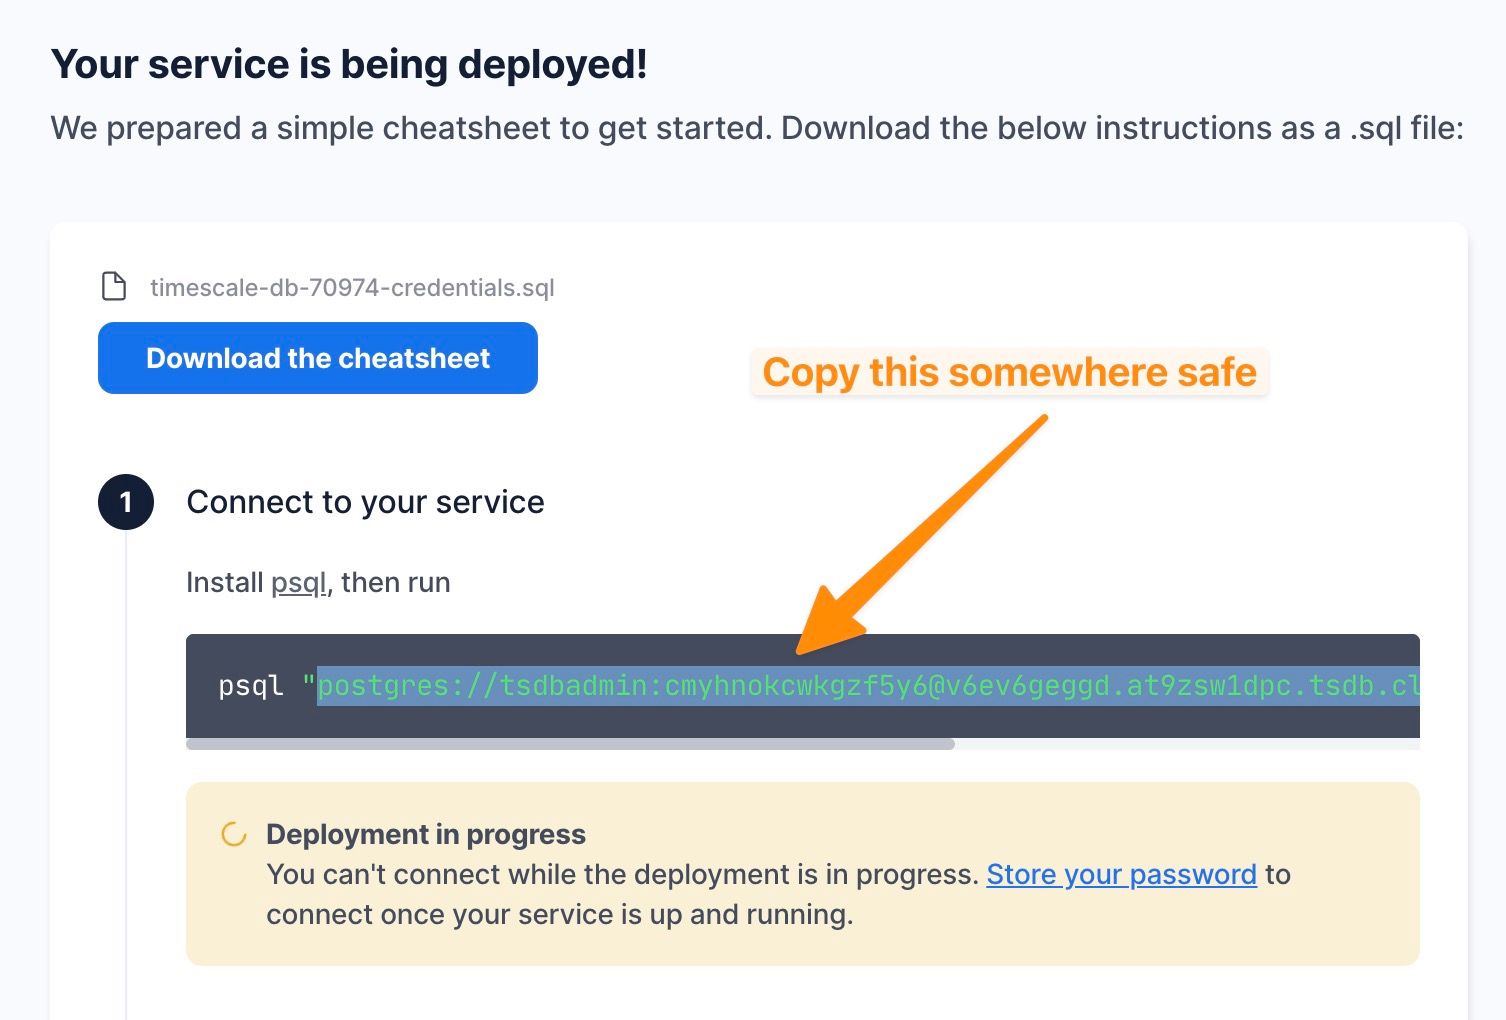
Alternatively, you can find the connection details when you head over to the "Services" tab in your Timescale dashboard. You can find more details about how to get the connection string over here: https://docs.timescale.com/use-timescale/latest/integrations/query-admin/about-connecting/
Now we can download the sample dataset that the Timescale team made available for testing. You can find this on the link below:
Timescale Documentation | Energy time-series data tutorial - set up dataset
Set up a dataset so you can query time-series data
TimescaleDB - Timeseries database for PostgreSQL
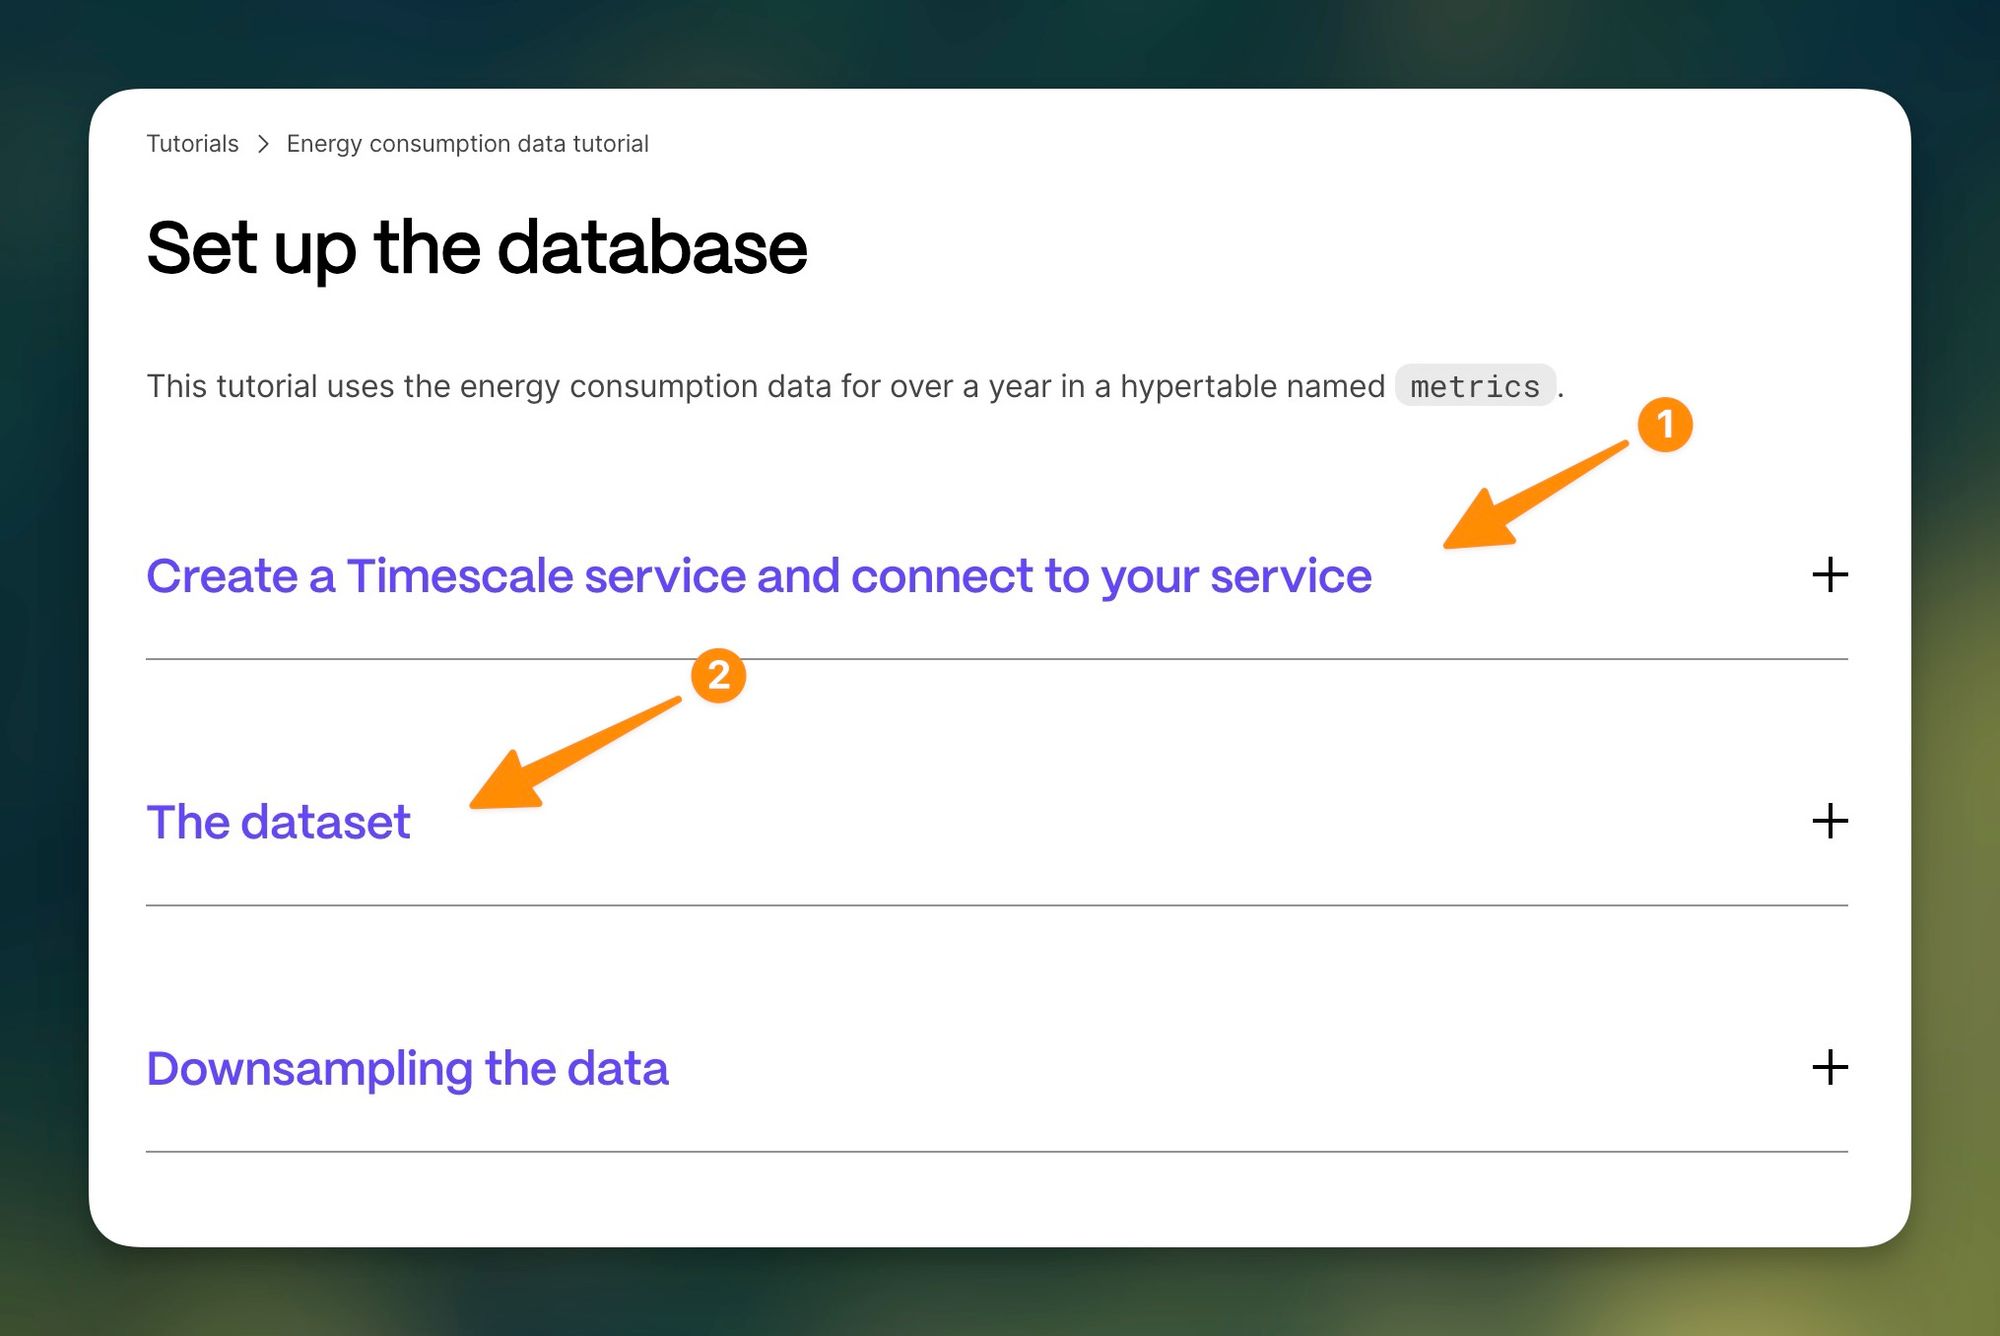
Follow the tutorial above to set up the dataset and your Timescale service. Once you have this ready, you can proceed to the next step to connect your new database with Chartbrew 🎉
Connect Timescale to Chartbrew
🙋
If you don't already have a Chartbrew account you can create one by going to
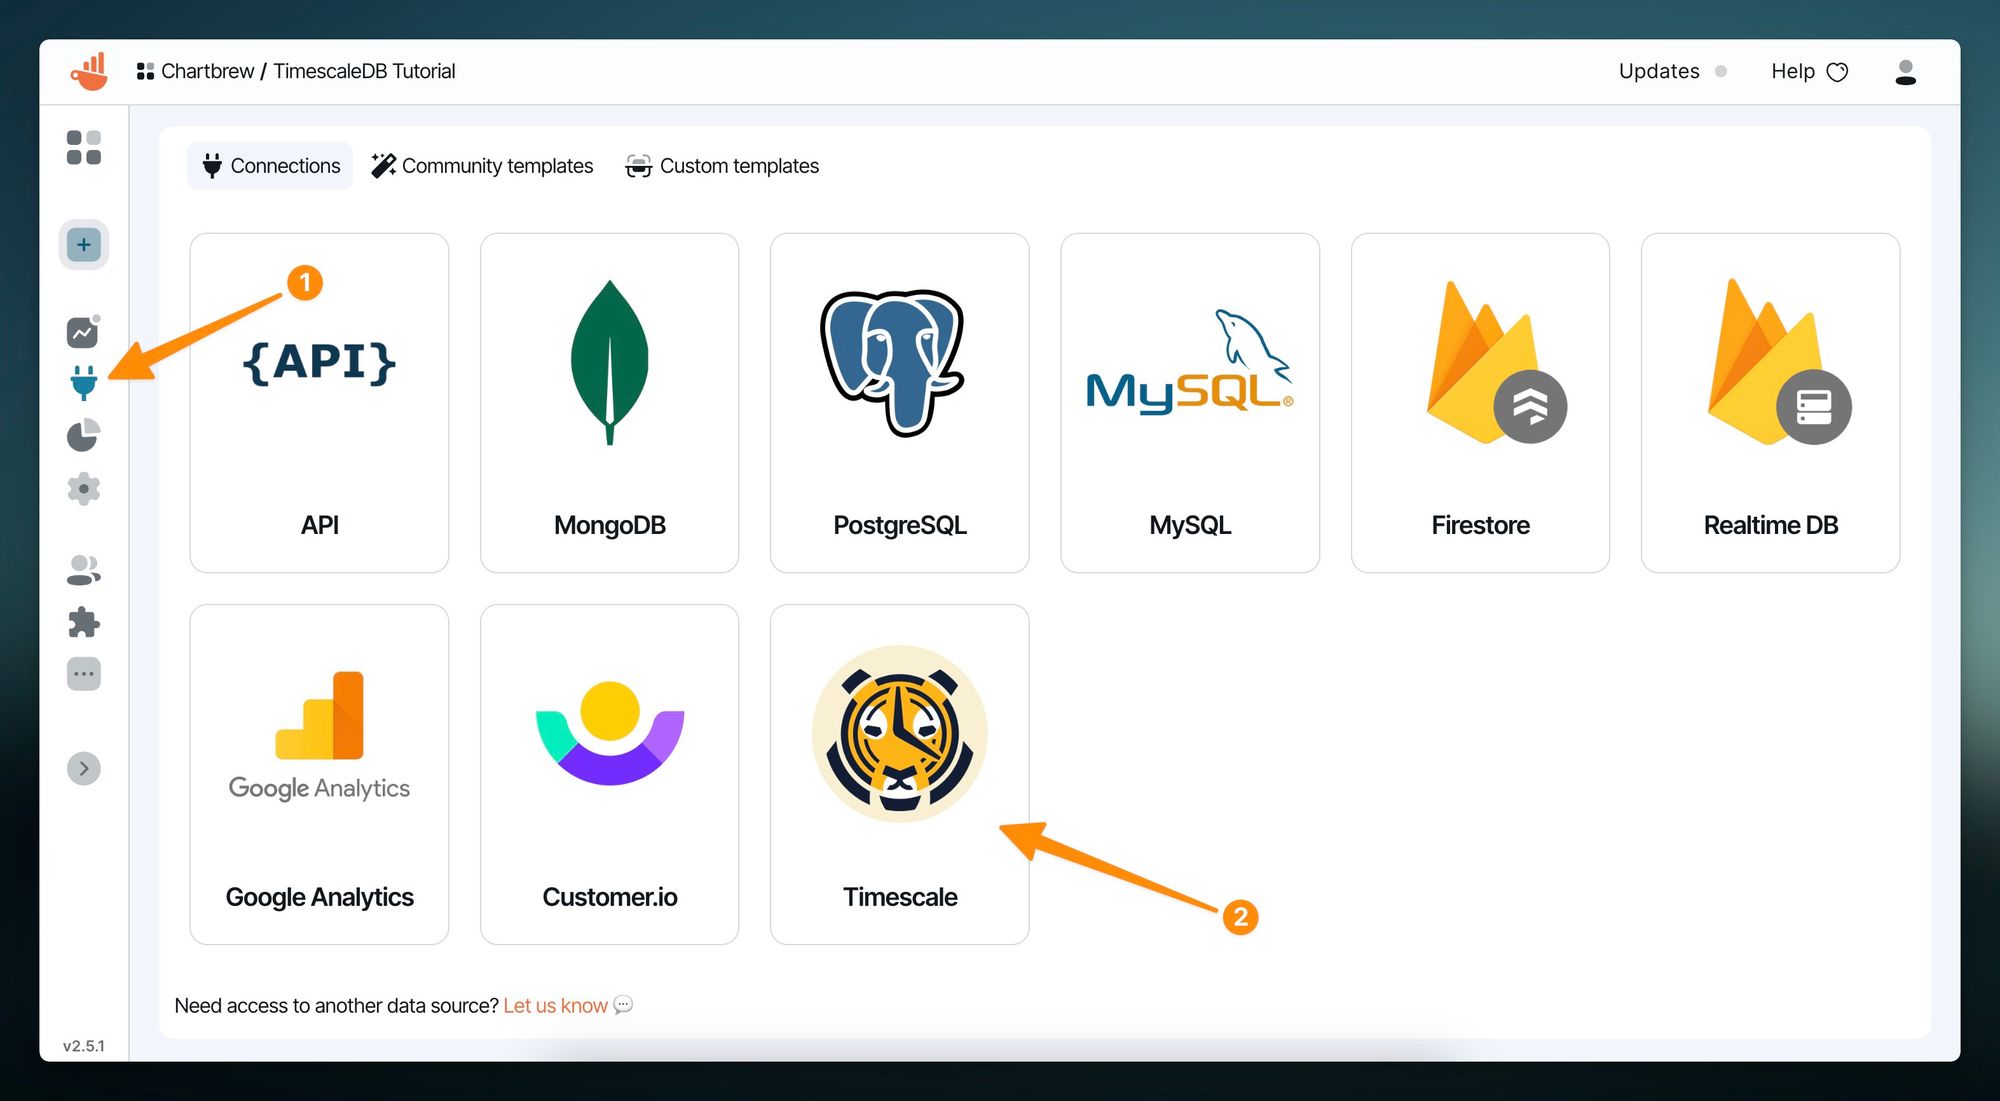
Create a new project in Chartbrew and choose the Timescale option in the Connections screen.
Copy your connection string in the field and give a name to your connection so that you can identify it later on when creating a chart.
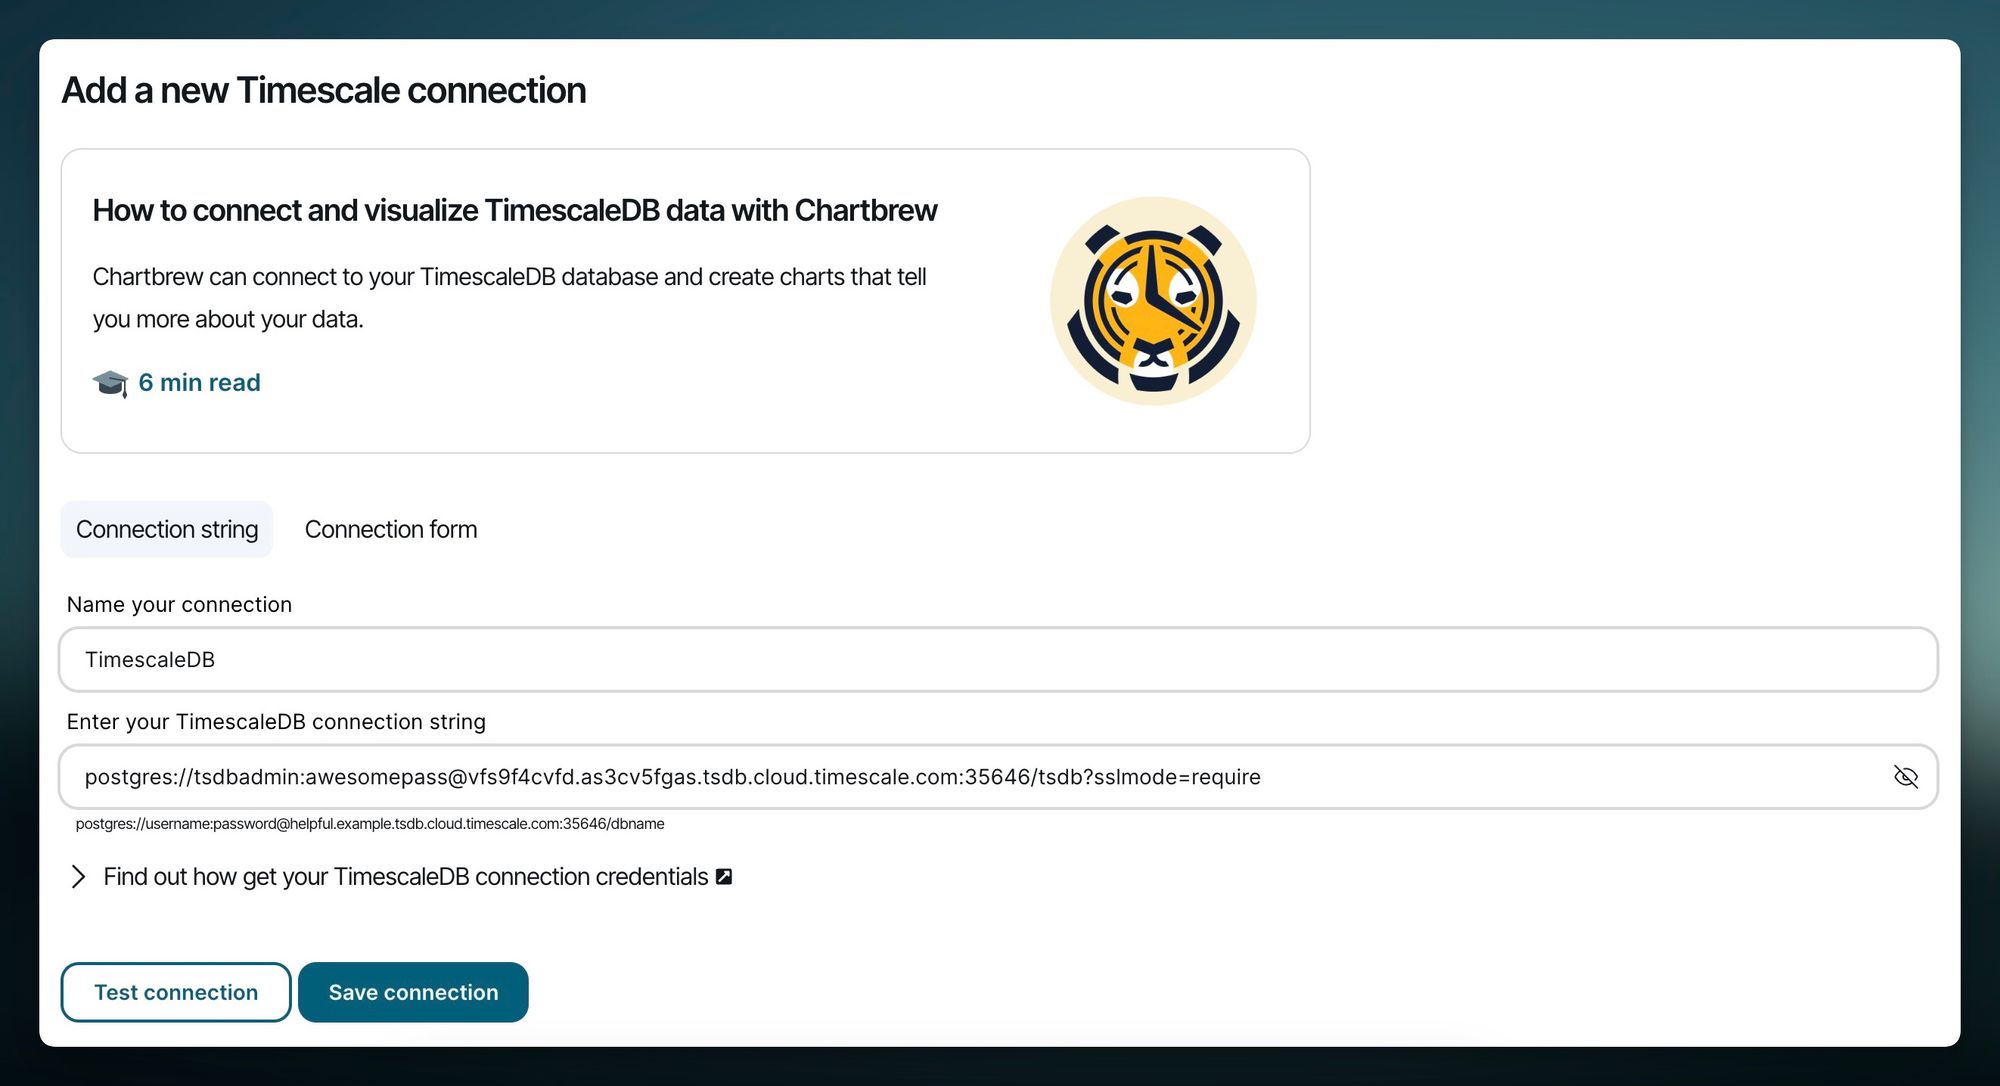
After you add the information, you can test the connection and you should be able to see a response with all the tables in the database. Save the connection and let's create a chart!
Create a time series chart with TimescaleDB and Chartbrew
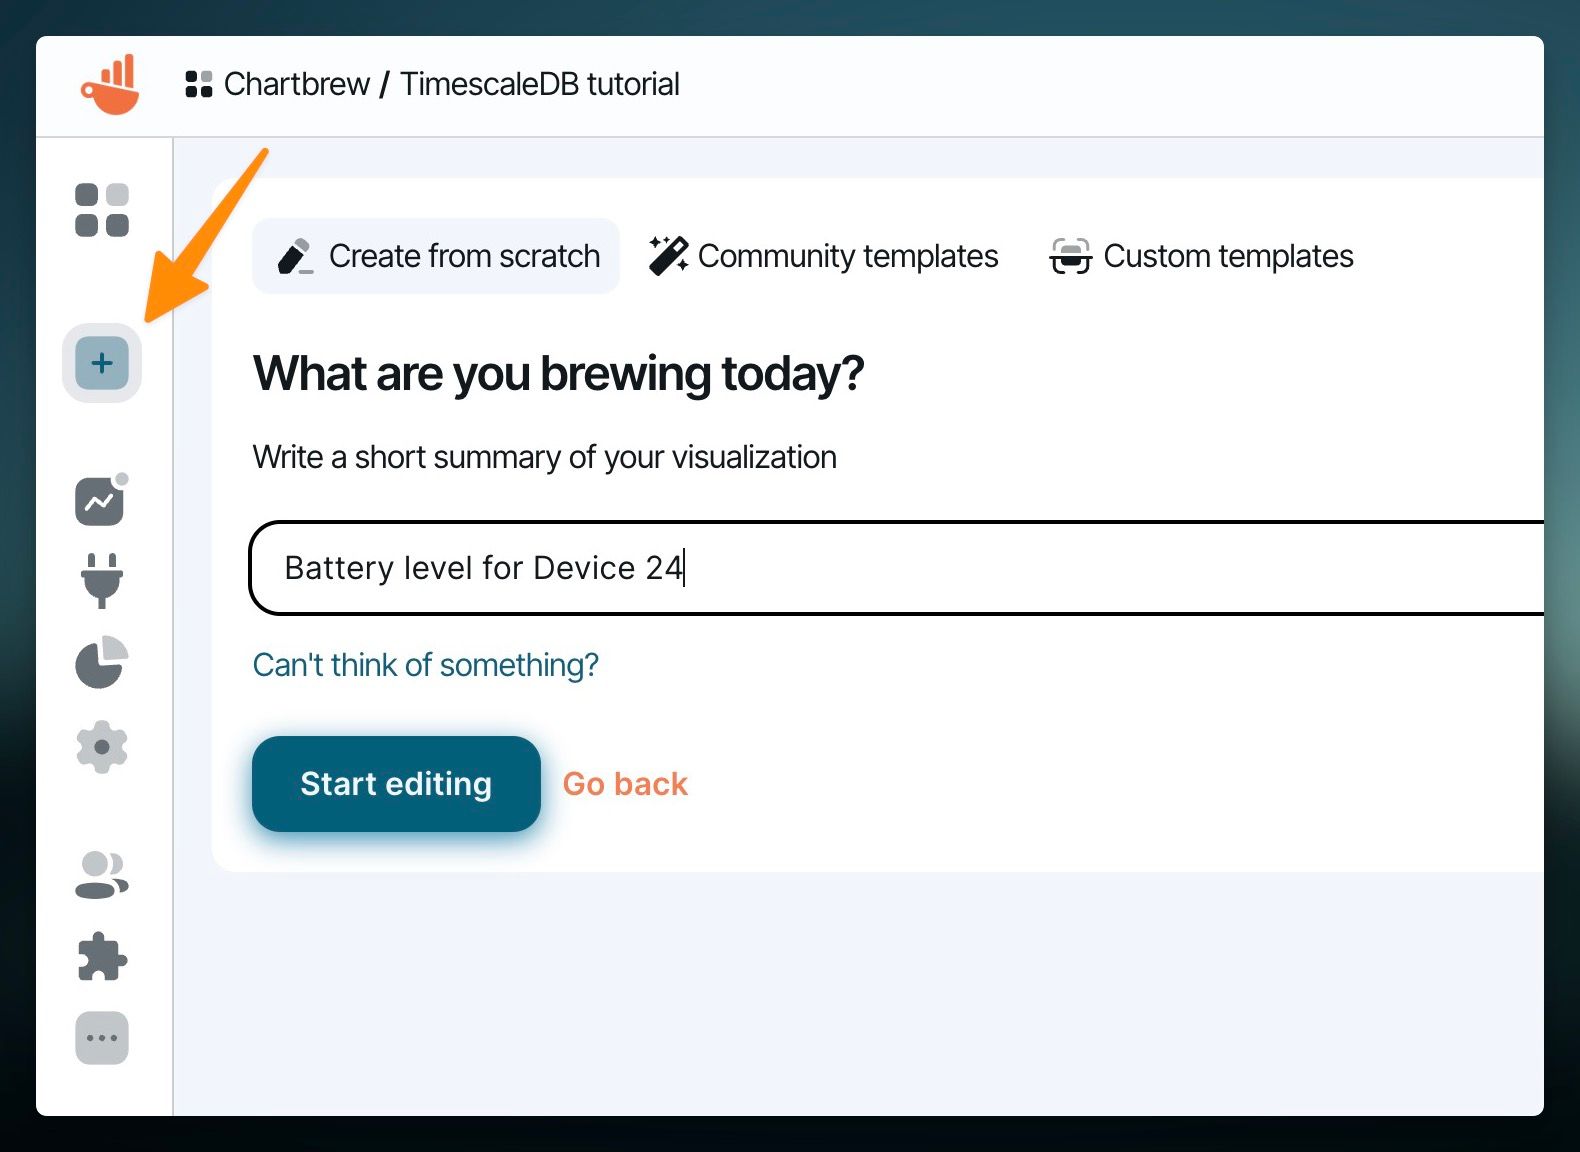
The first chart we are going to create is to monitor the battery level for one of the devices in the database. Click on the Plus button to create a new chart and name it accordingly.
In the new screen, create a new dataset, name it "Battery level" and press on the Get data button to write our first query.
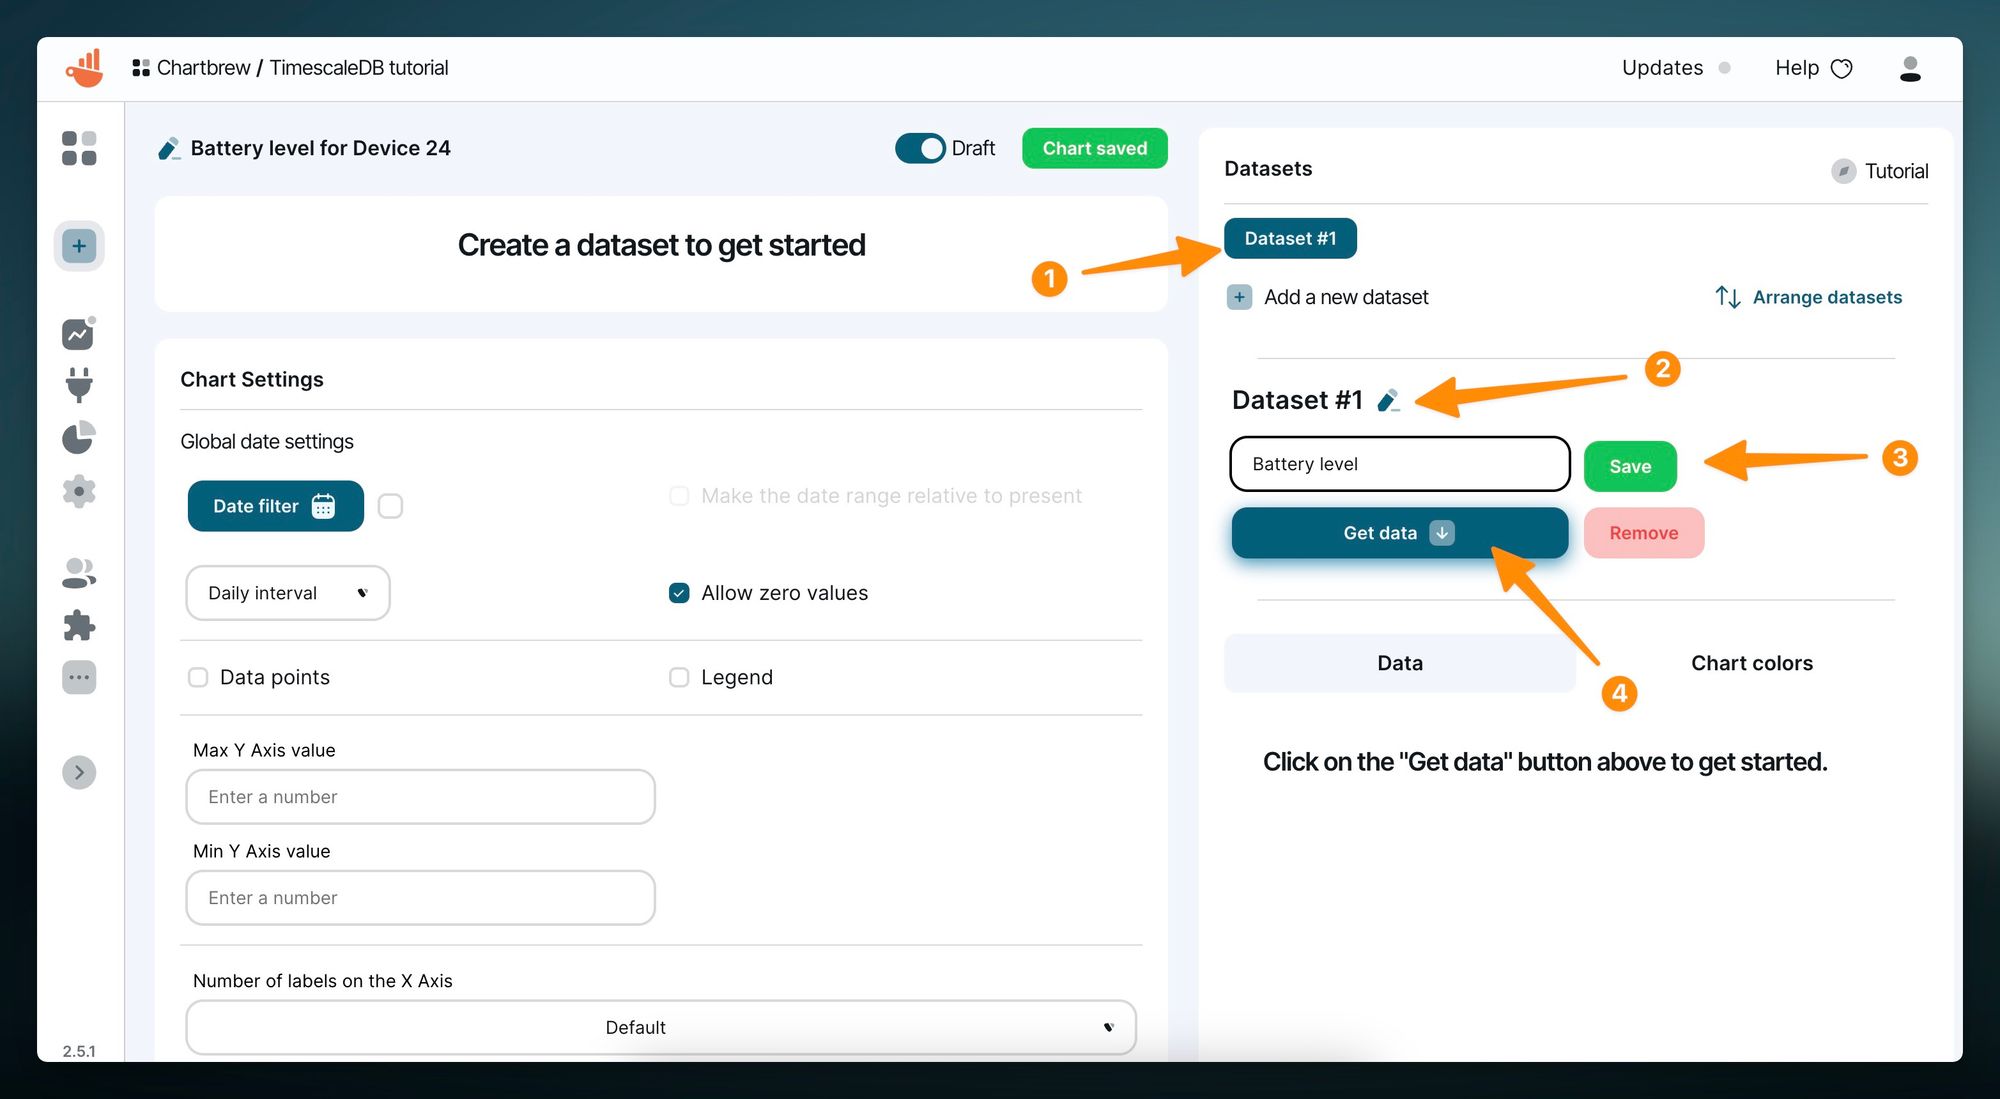
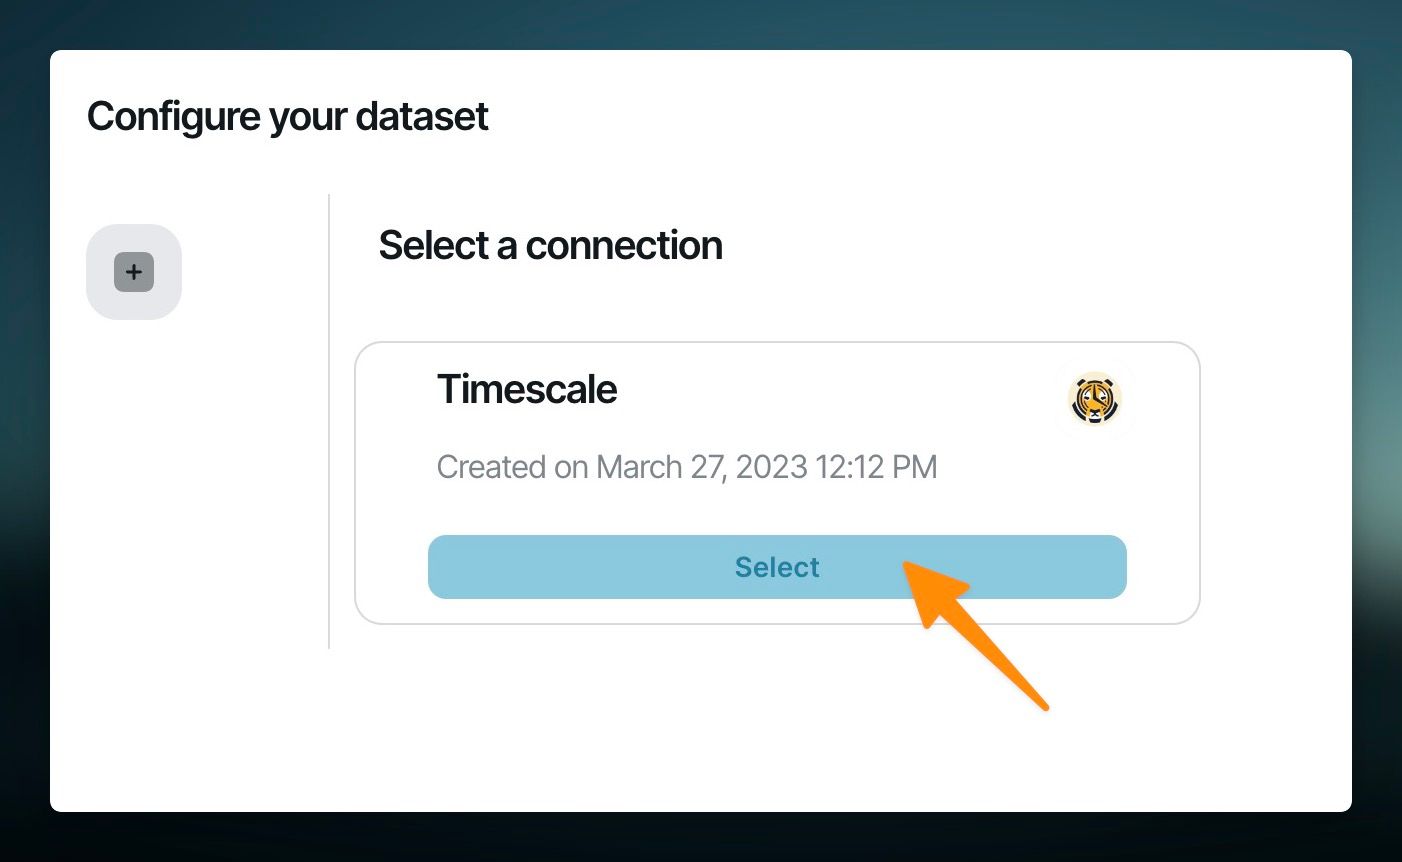
Pressing on the Get data button will prompt the list of connections. In Chartbrew you can have multiple connections in the same project and you can even join multiple ones in the same dataset. For this example, we are just going to use the TimescaleDB connection we created before.
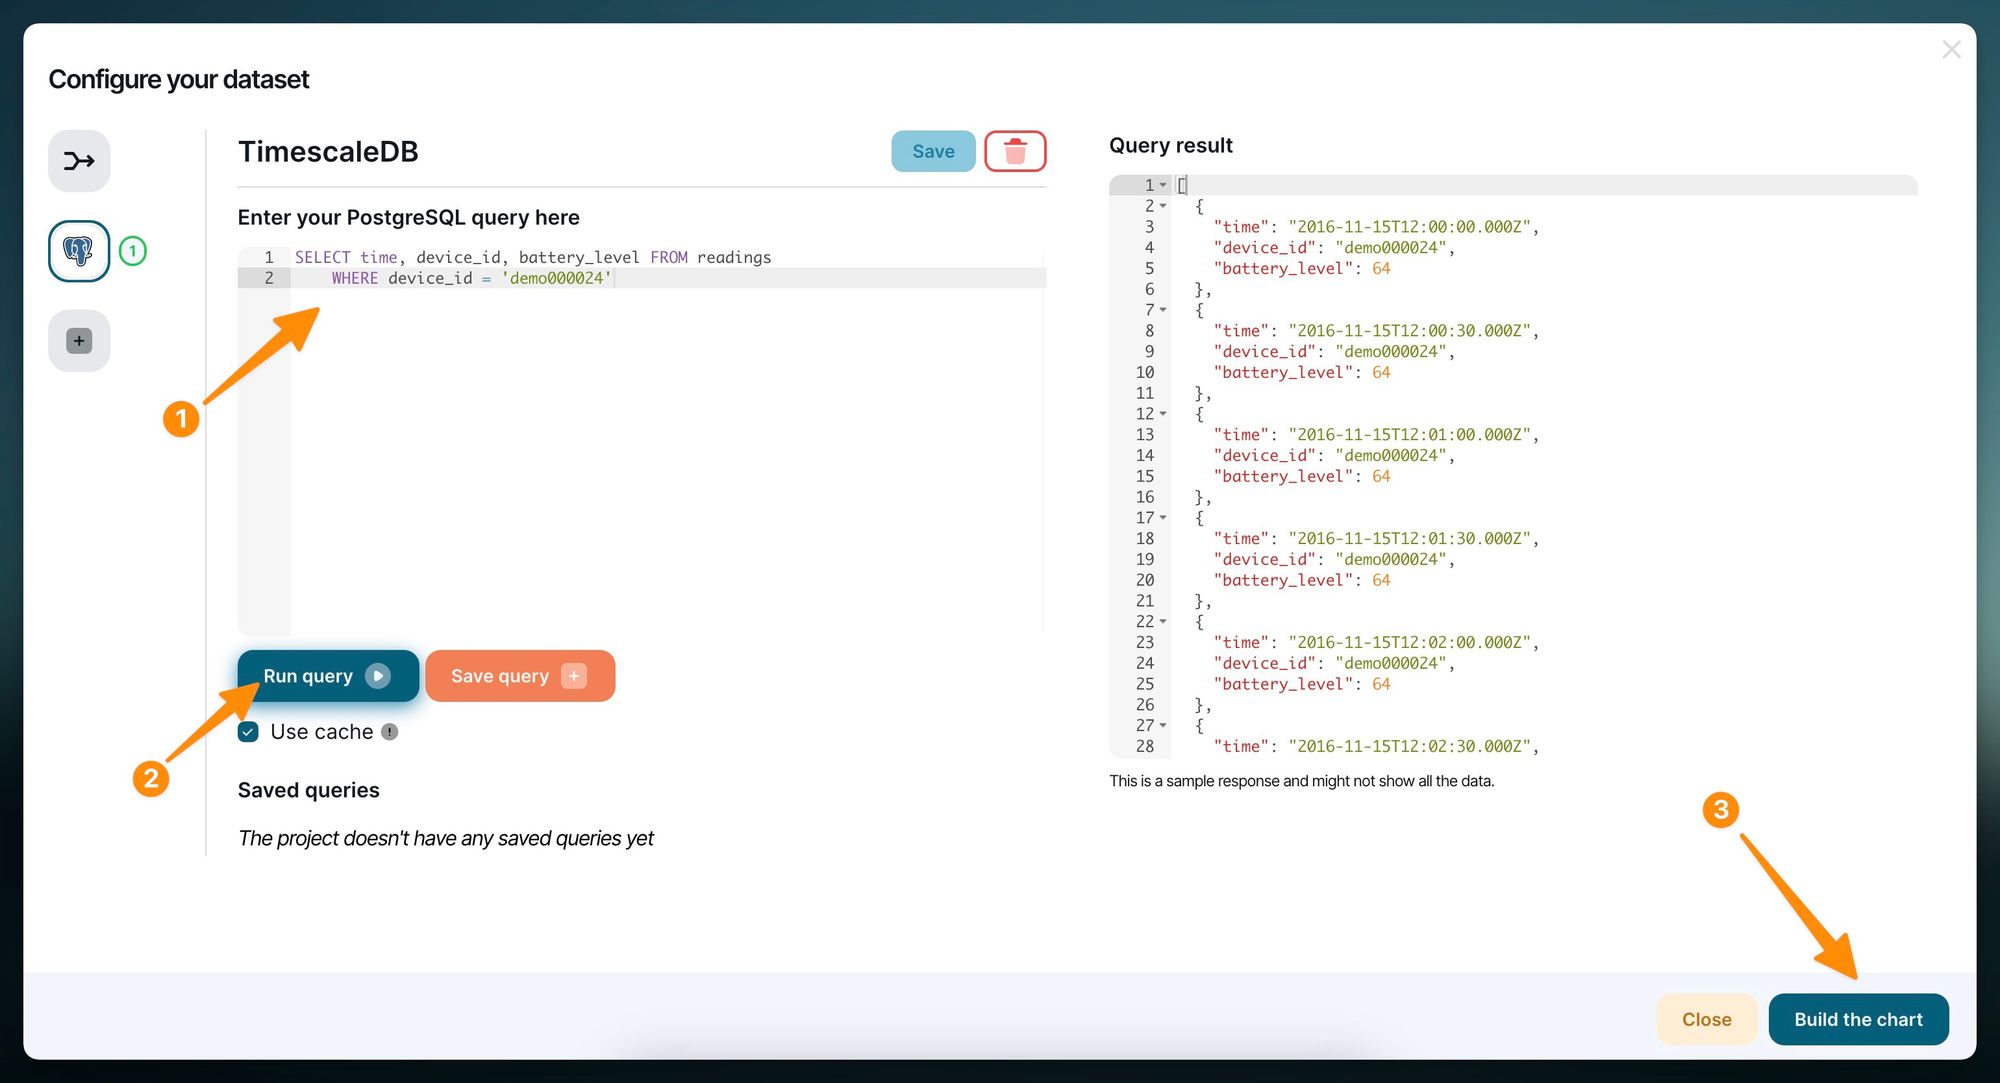
Selecting the connection will prompt us to configure the query. You can write the query below to get the battery level for Device #24. On the right side of the screen, we can preview some of the data that comes back from the query.
SELECT time, device_id, battery_level FROM readings
    WHERE device_id = 'demo000024'
After successfully fetching the data, we can click on the Build the chart button and we will be greeted with the chart builder that already has some fields selected based on the dataset. The chart will most likely be empty at first and we need to configure it a little. The operation on the Y-Axis needs to be set to No operation (1) in this case, and since the sample dataset is based on a sensor, we should set the date interval to be in minutes (2).
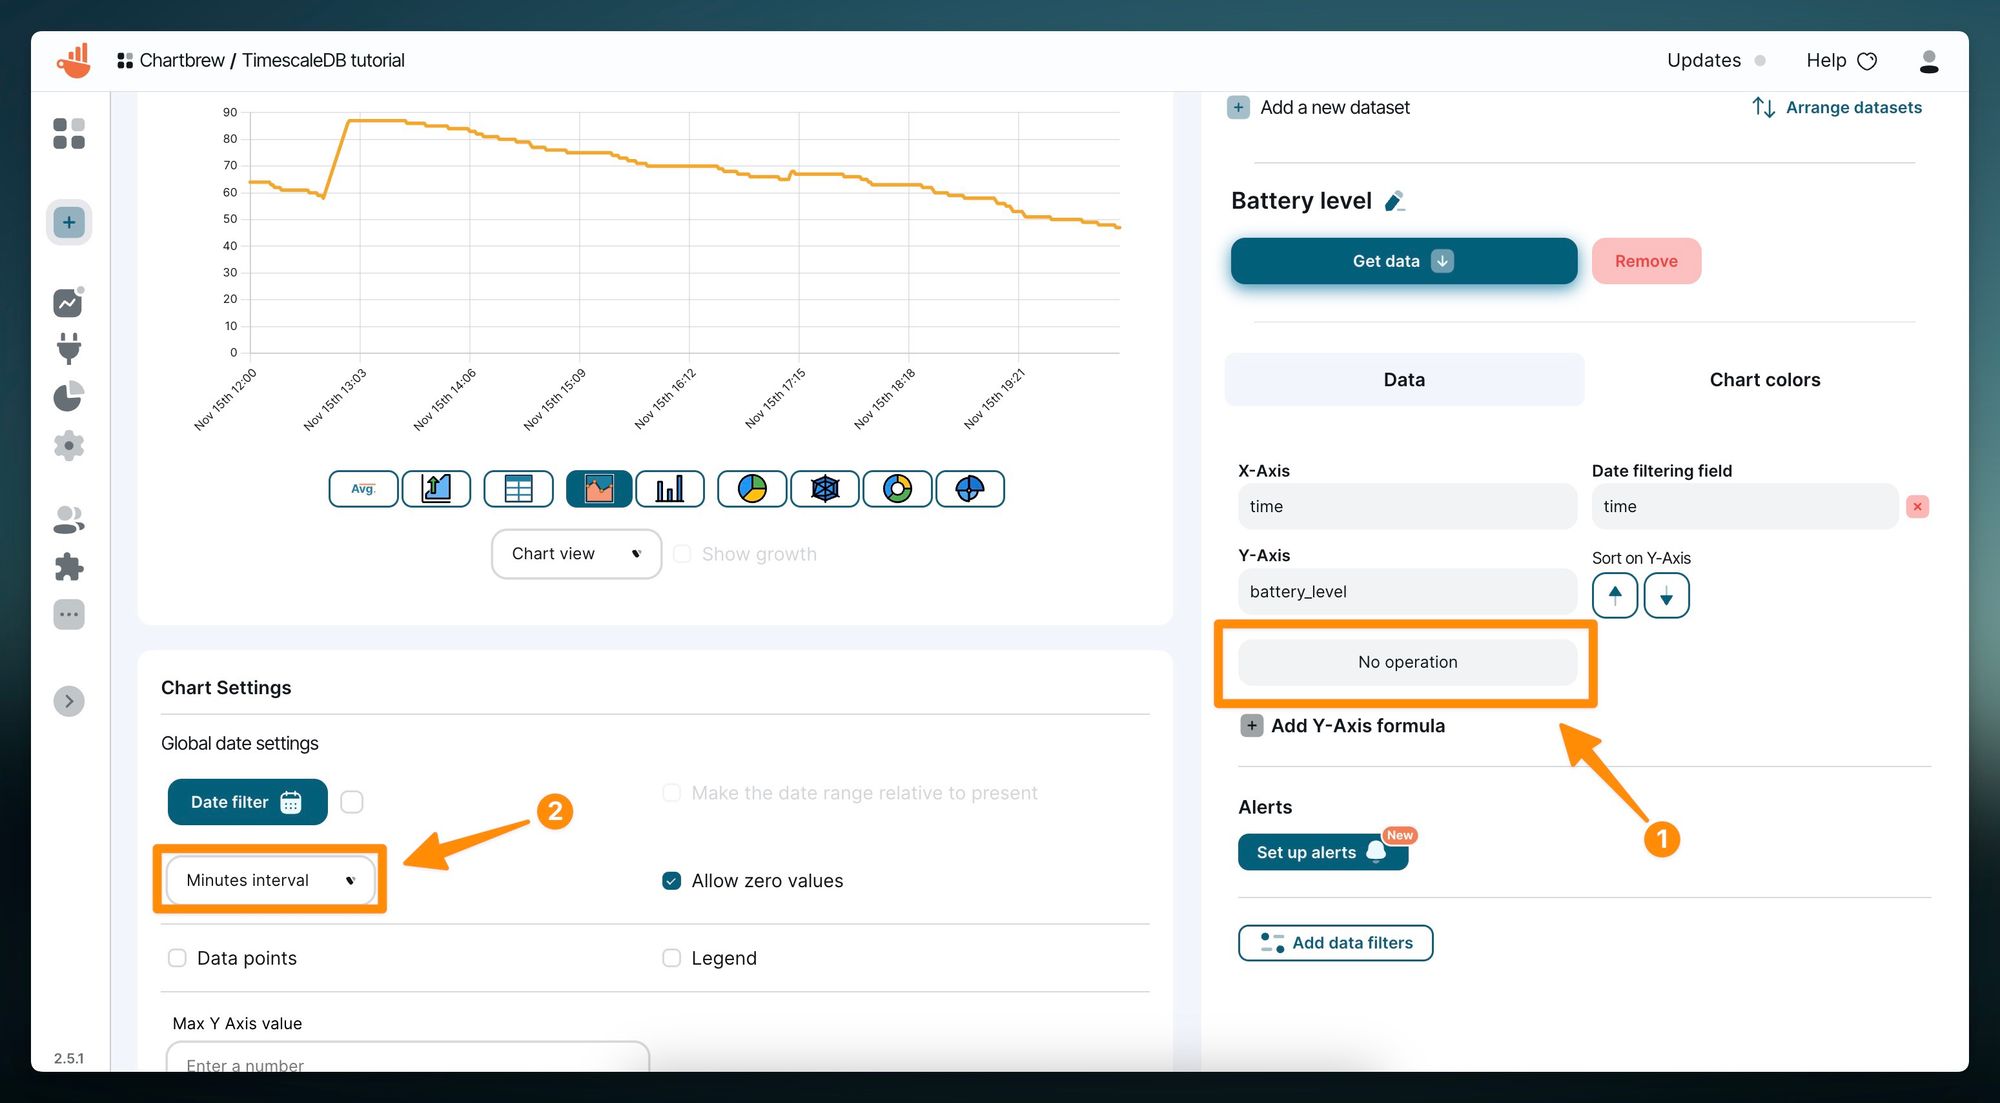
ℹ️
If you still can't see the chart after setting those two settings like in the screenshot, scroll up and disable the cache next to the Refresh button, then press the button again.
A few other query examples for time series charts
To create a time series showing CPU usage over time, you can use the following query for a new chart:
SELECT time, cpu_avg_1min FROM readings
    WHERE device_id = 'demo000024'
Another useful chart would be one for showing memory usage. The query can be written as follows:
SELECT time, mem_used FROM readings
    WHERE device_id = 'demo000024'
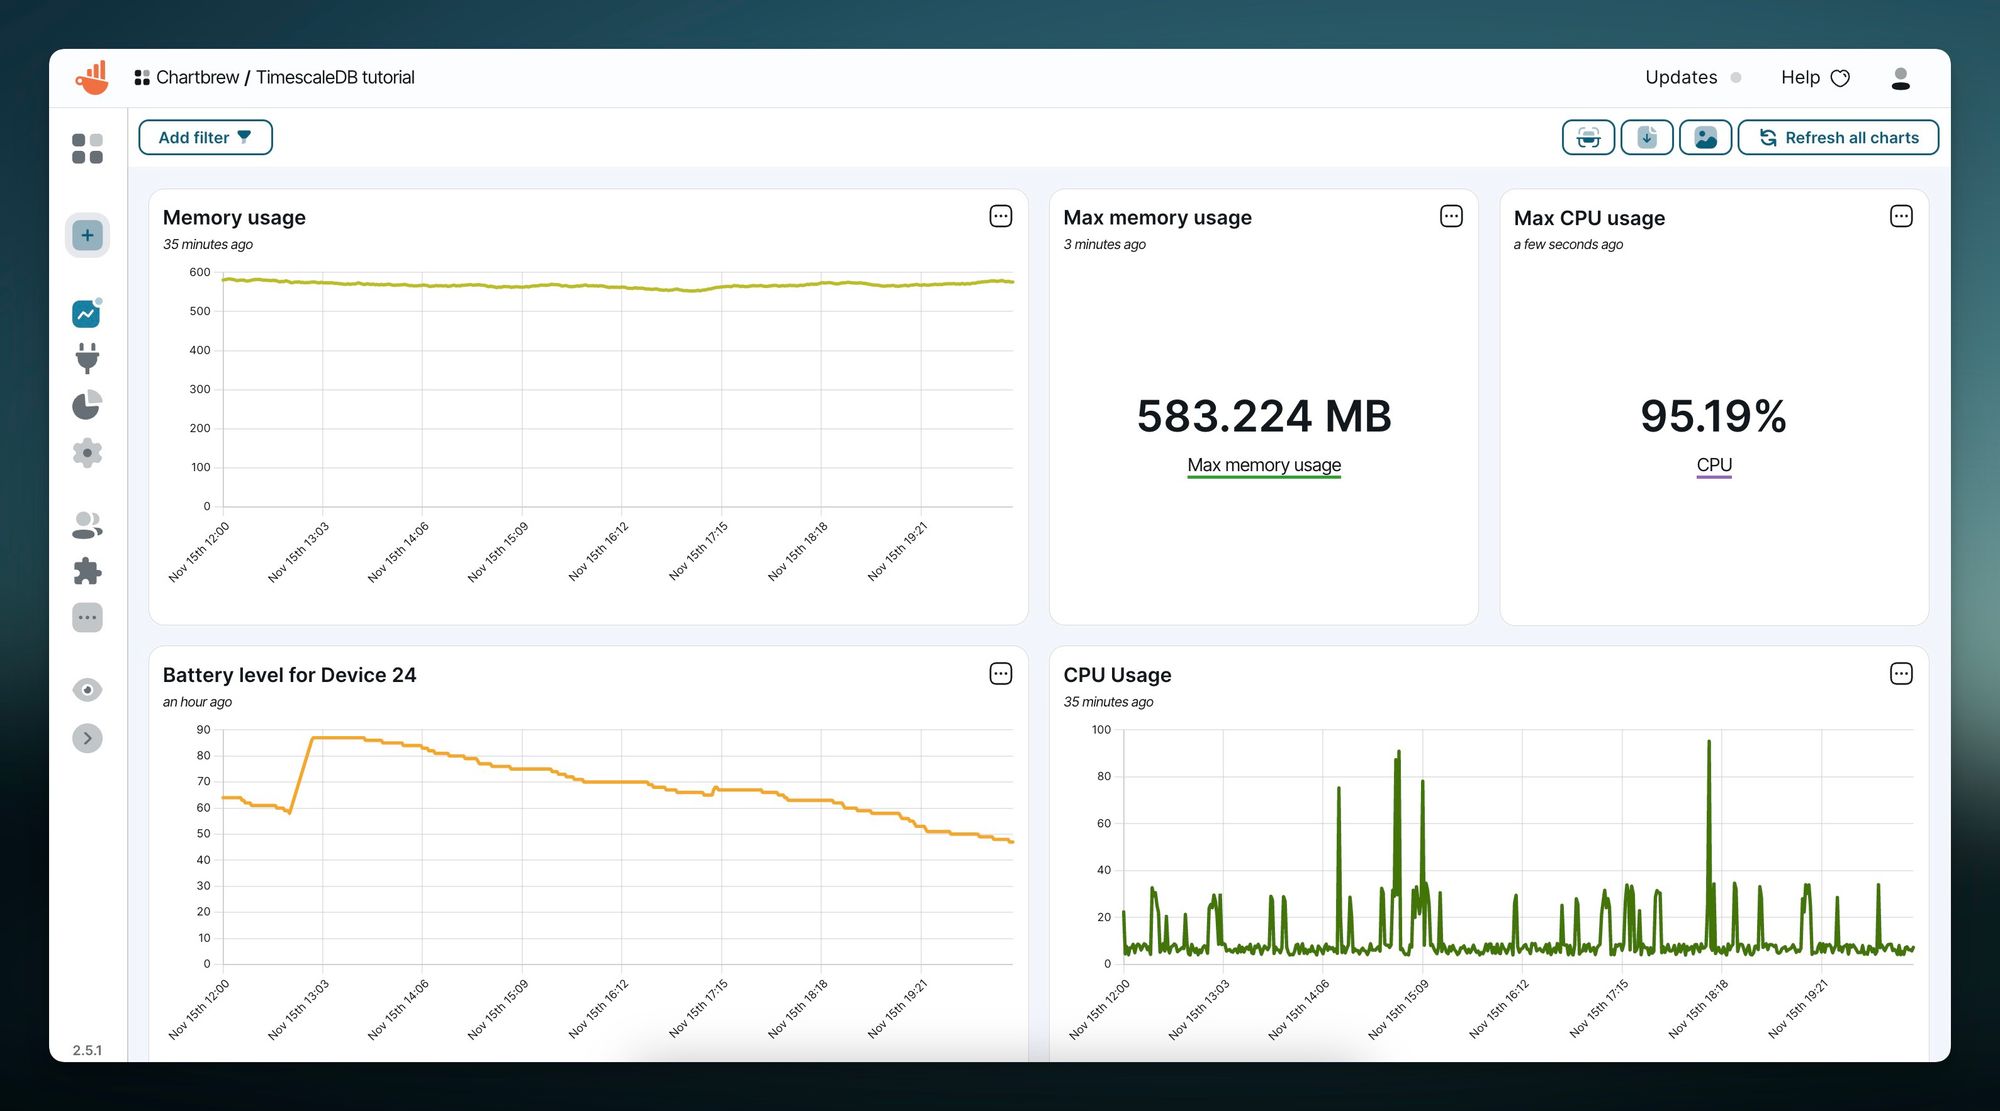
The dashboard will then look like this:
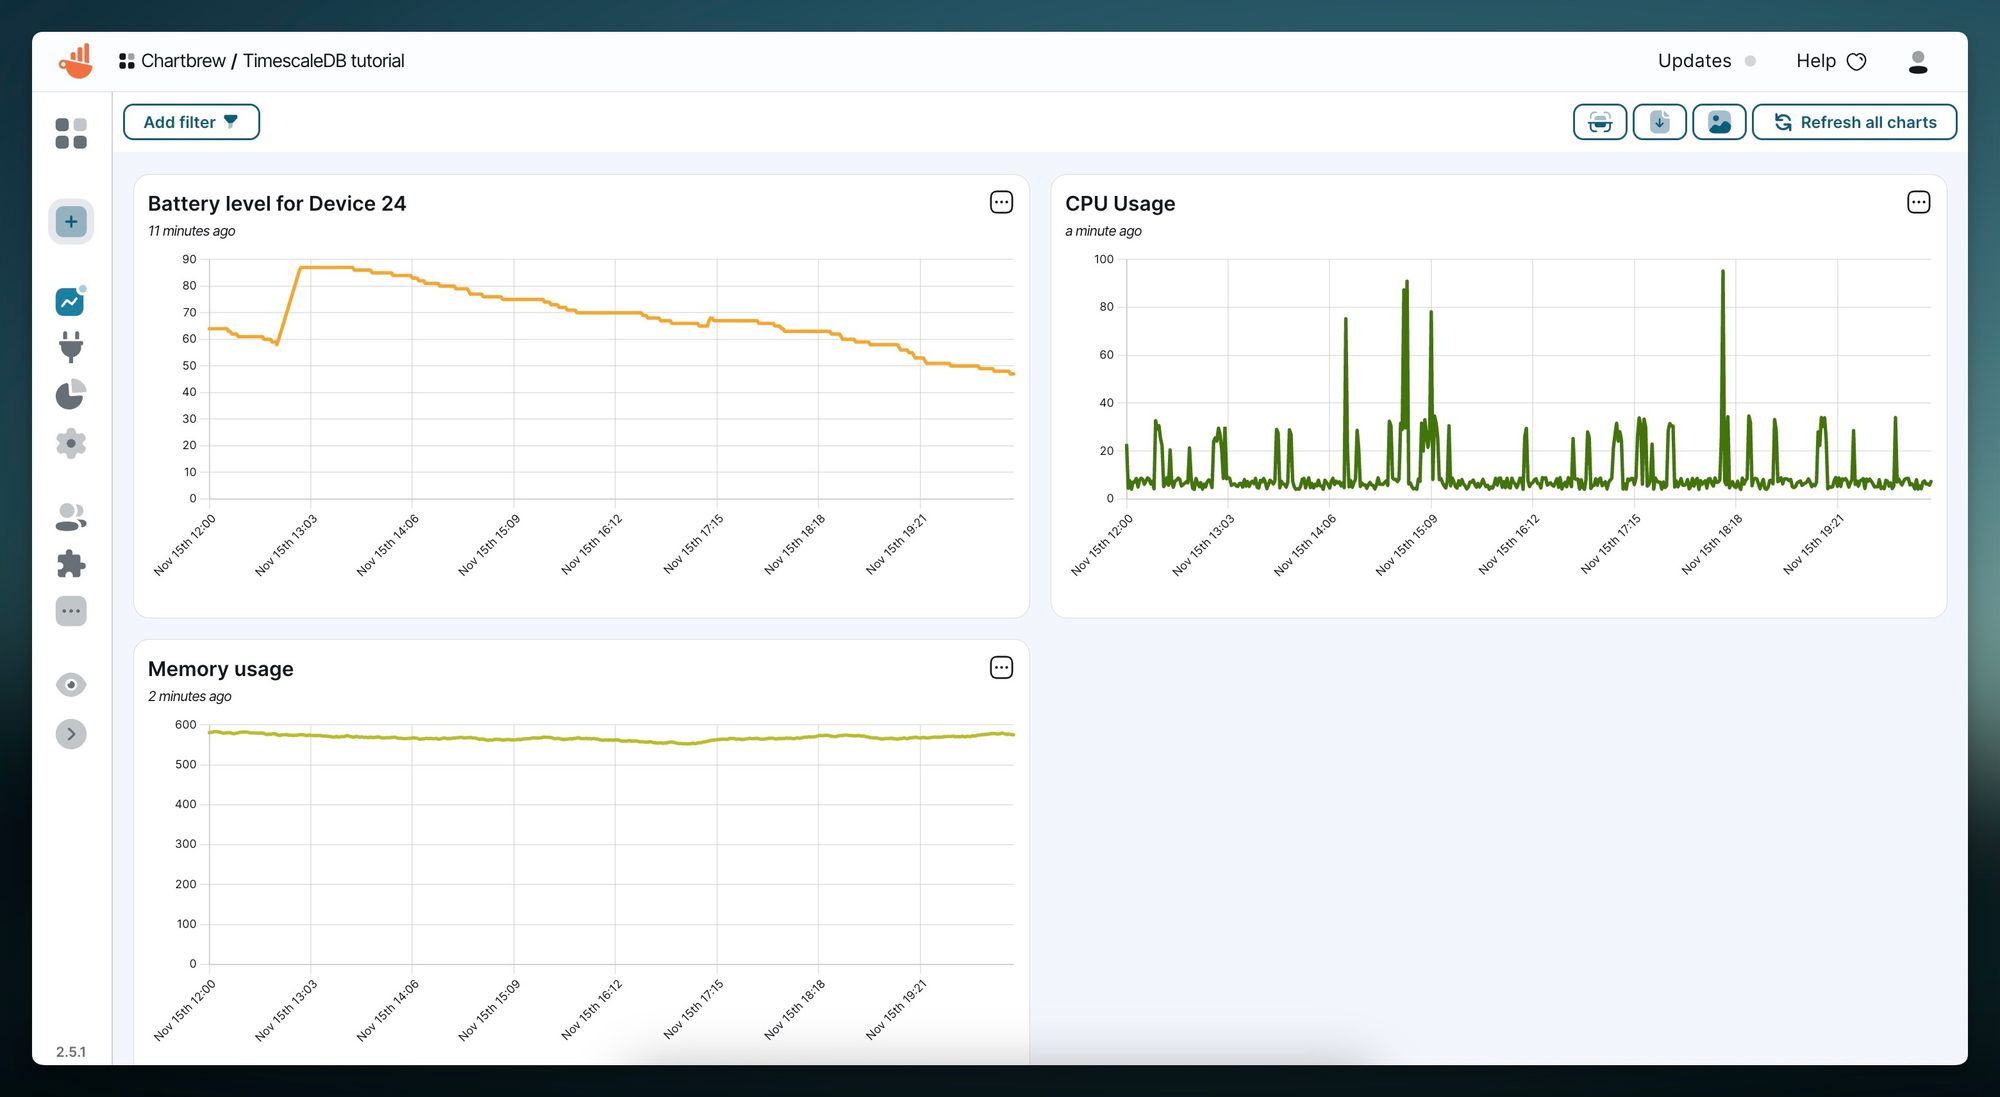
Visualizing metrics from TimescaleDB in Chartbrew
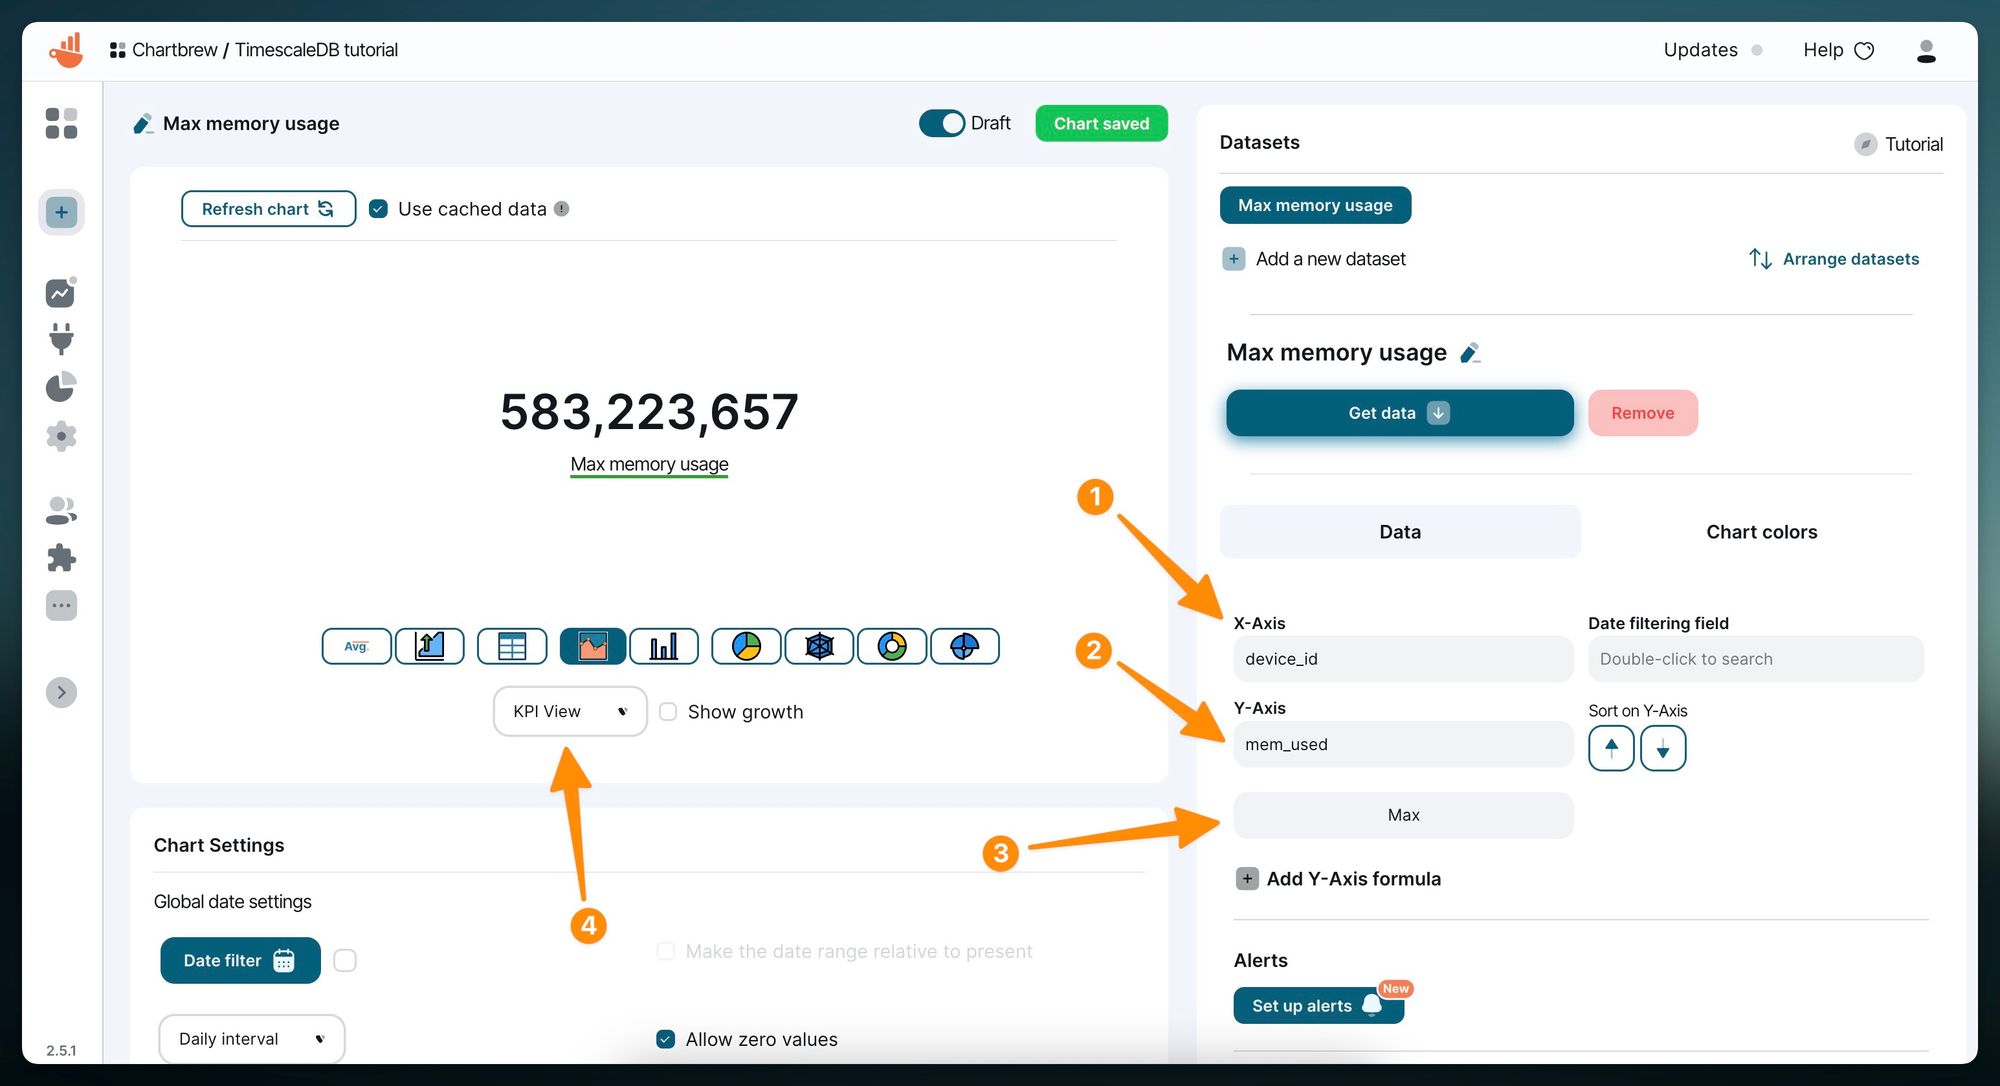
Chartbrew can also visualize clear metrics that show a plain number. A potential use case would be to show the maximum memory usage in a given time range or show the total number of devices in the network. In our example, we are going to create a KPI chart that shows the max memory usage.
Create a new chart and connect it to the TimescaleDB connection as before. In the query box, we are going to write a query that gets the memory usage for Device #24:
SELECT device_id, mem_used FROM readings
    WHERE device_id = 'demo000024'
When dealing with big numbers like the memory in bytes or currency in cents, we can further format the value on the Y-Axis by clicking on the Add Y-Axis formula:
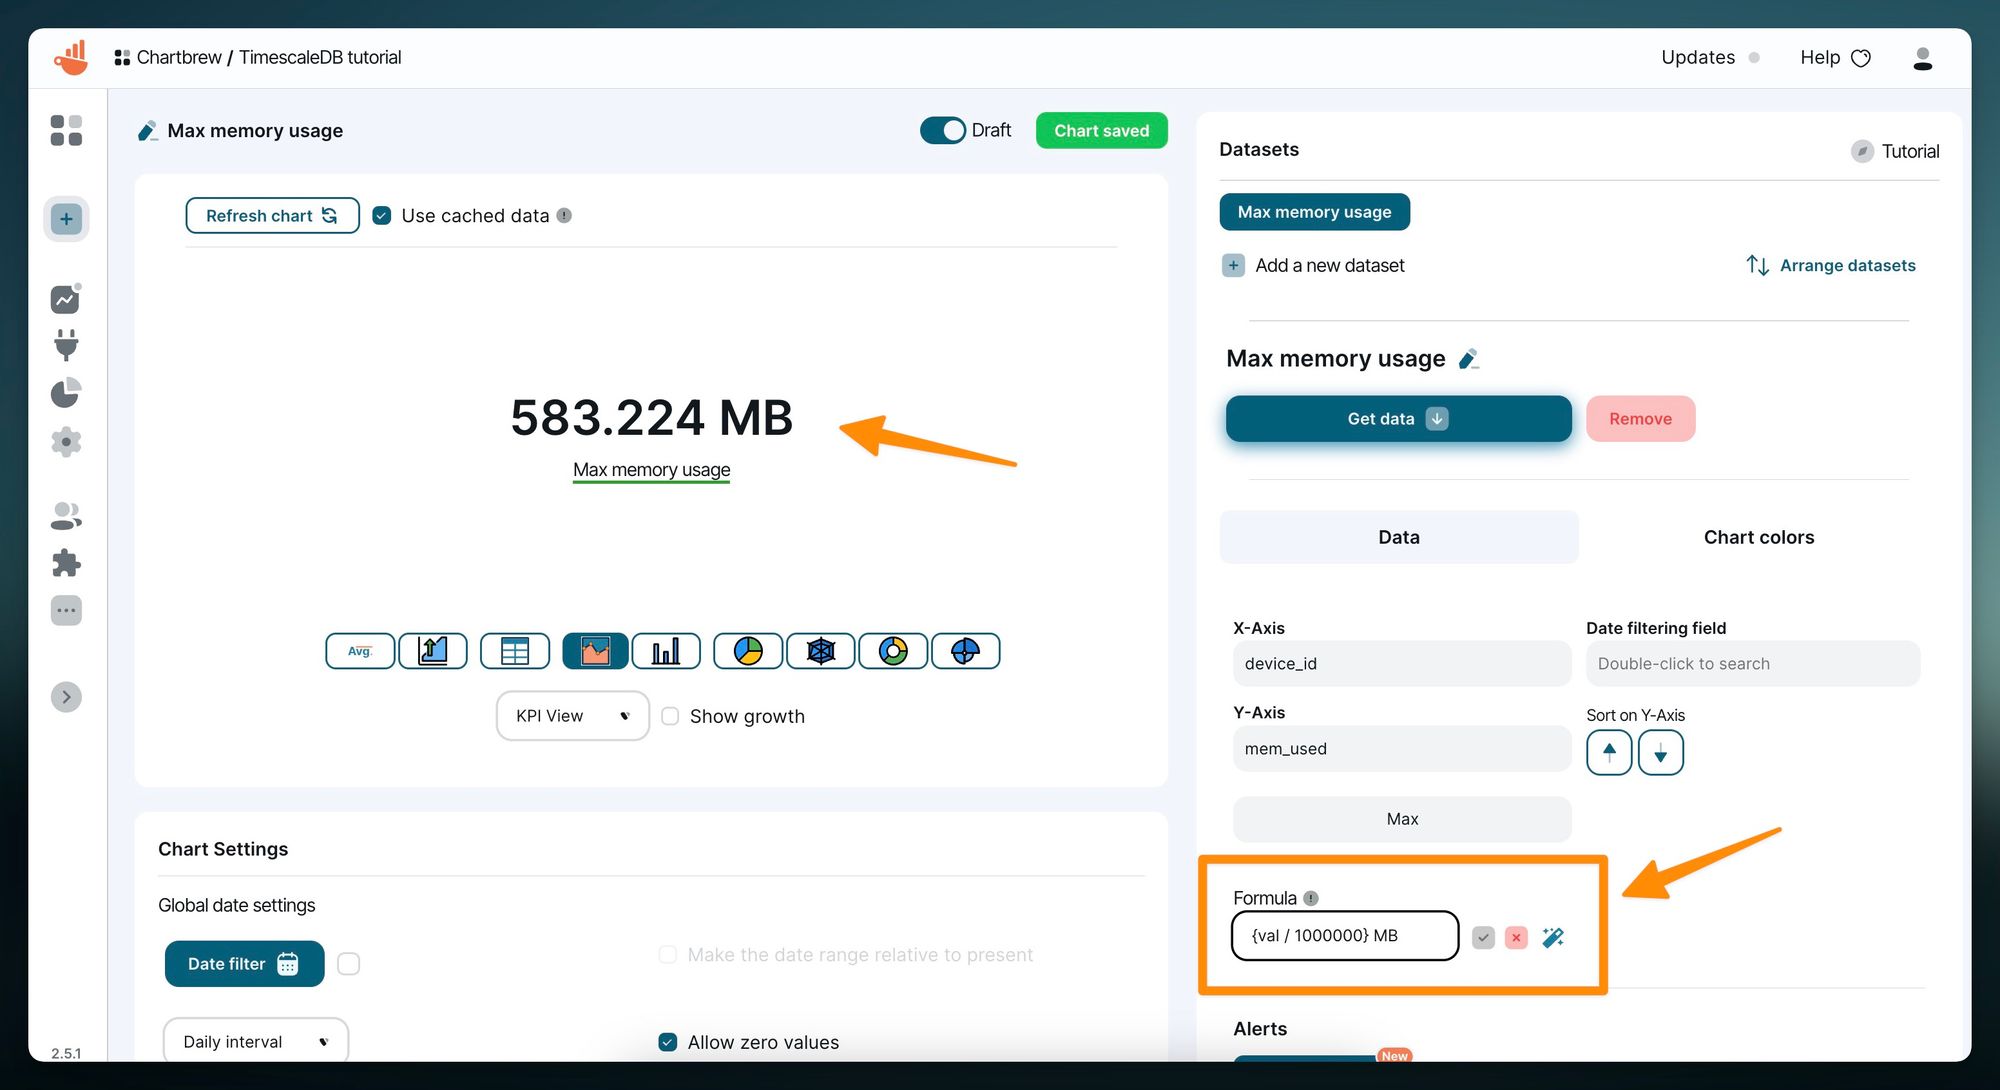
And now our final dashboard can look something like this:
Next steps
There are many more things you can do in Chartbrew to take full advantage of the platform. Take a look below for some inspiration:
- Set up alerts for your charts to get notified of thresholds, milestones, and anomalies. Take a look at this video to see how
- Create customized reports that can be shared with others. Check this tutorial for more details
- Check all the other integrations to see what other source you can connect to your dashboard
