Create your Strapi visualization dashboard with Chartbrew
This tutorial will guide you step-by-step on how you can connect to your Strapi project and create a few visualizations to monitor your data. Get started with Strapi by self-hosting the platform, or use the managed version at Strapi Cloud.
Check it out here
Set up your project
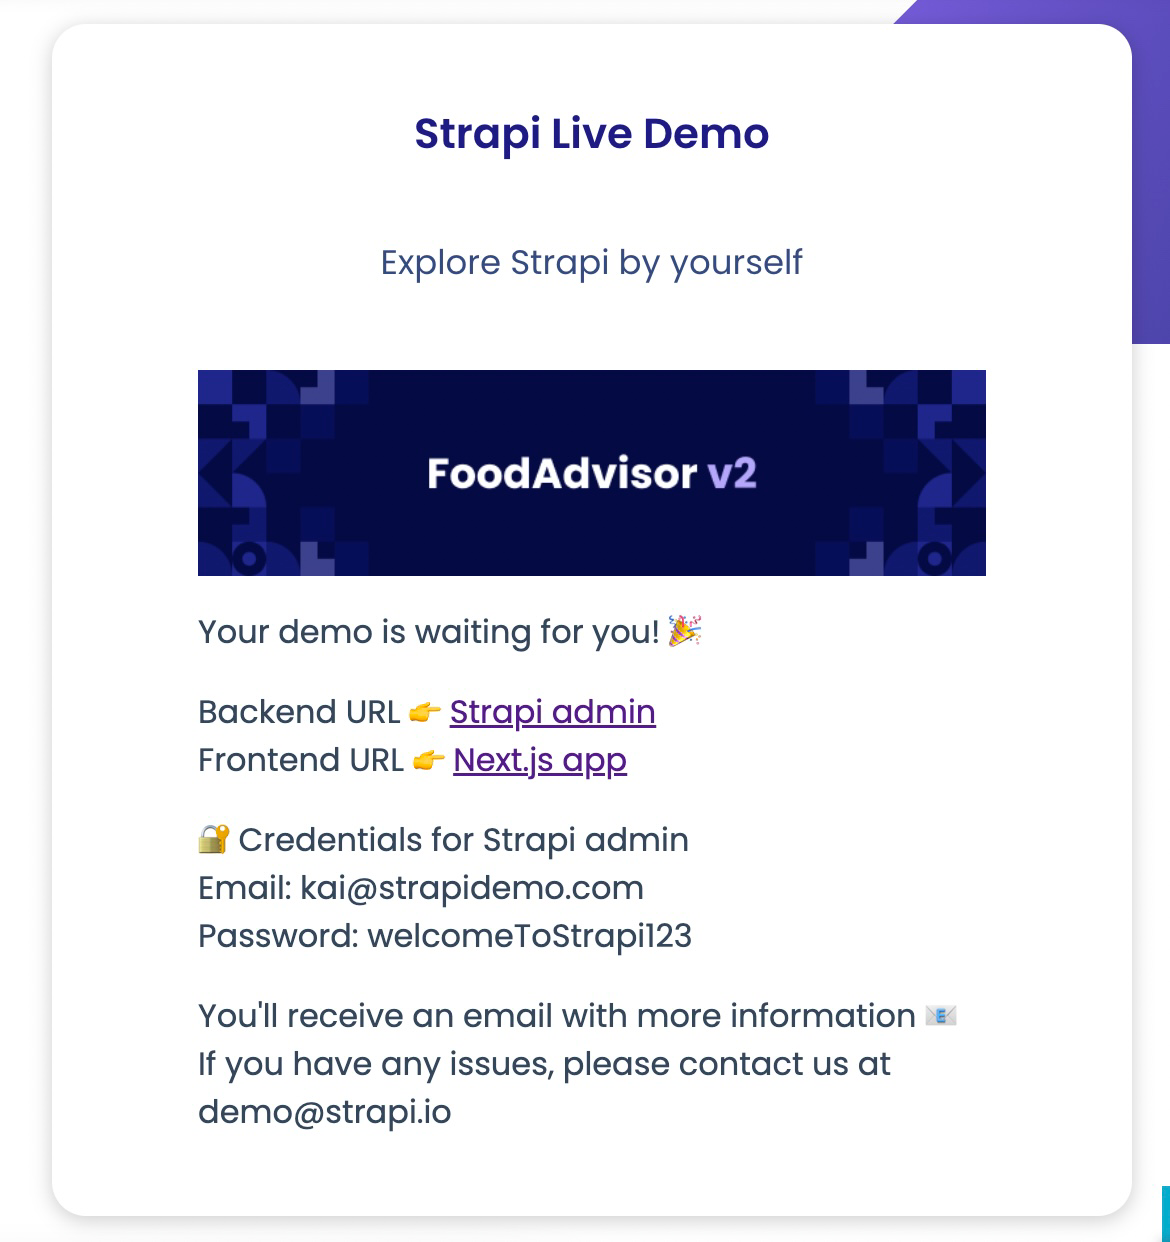
If you already have a Strapi project, feel free to use it and follow along with the tutorial. If you do not have a running instance of Strapi, you can access a demo application on the official website. Complete the form on that page to get access to your demo instance and Strapi will give you the credentials to log in as shown in the picture below:
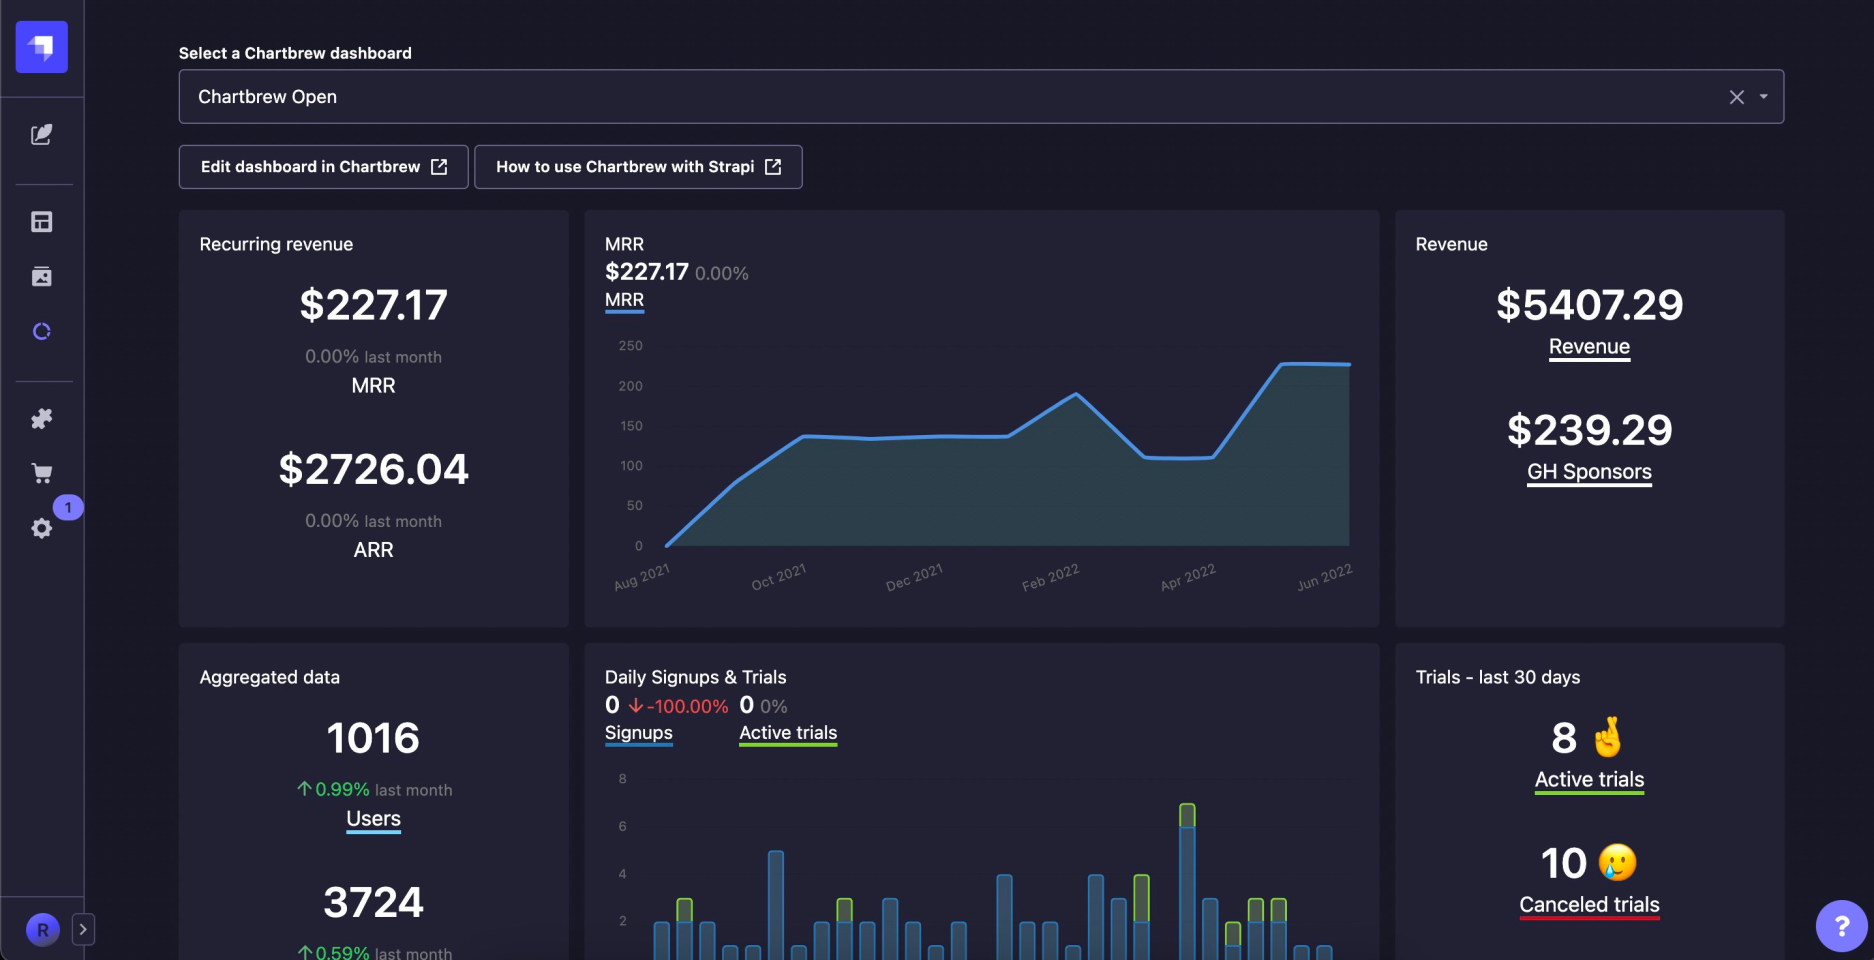
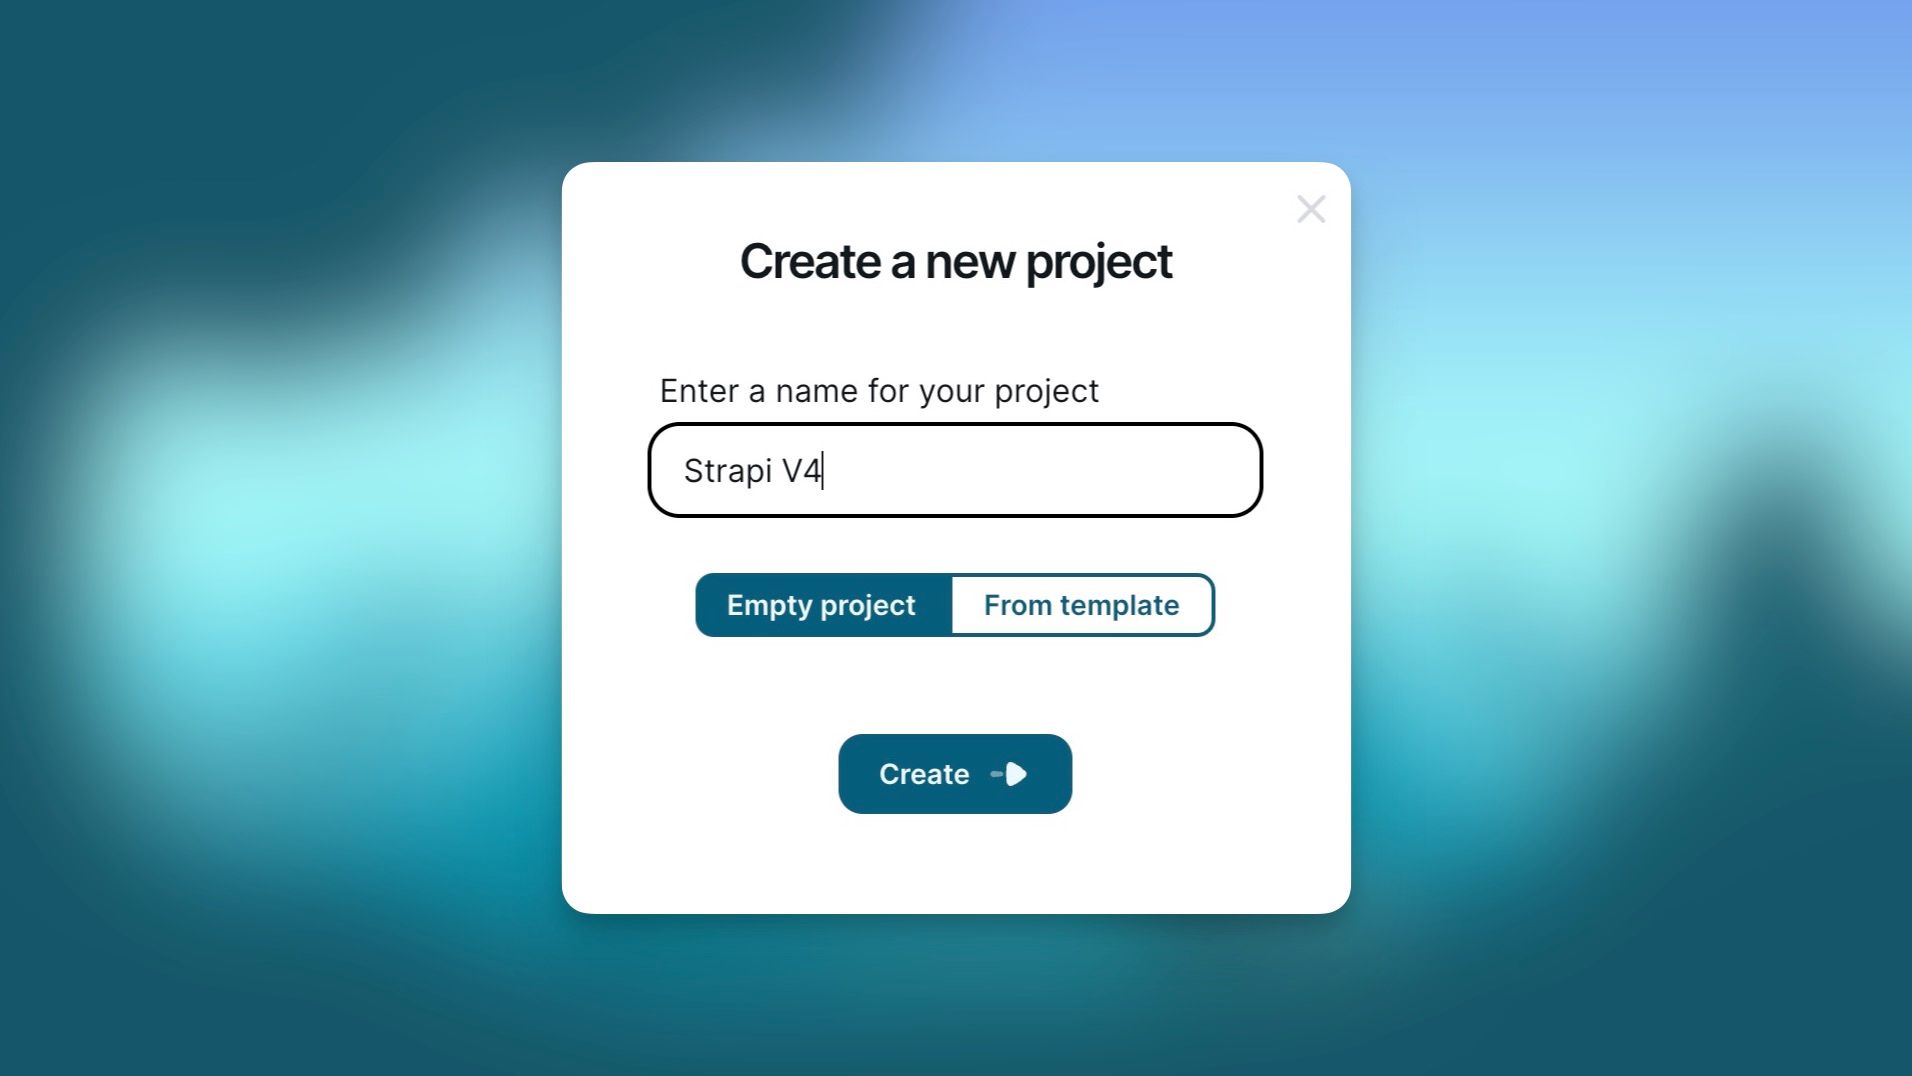
To get started with Chartbrew, you can sign up here for free or set up the project on your server by following the documentation. Once you have a Chartbrew account set up, create a new project, and let's get started!
Connecting Chartbrew to Strapi
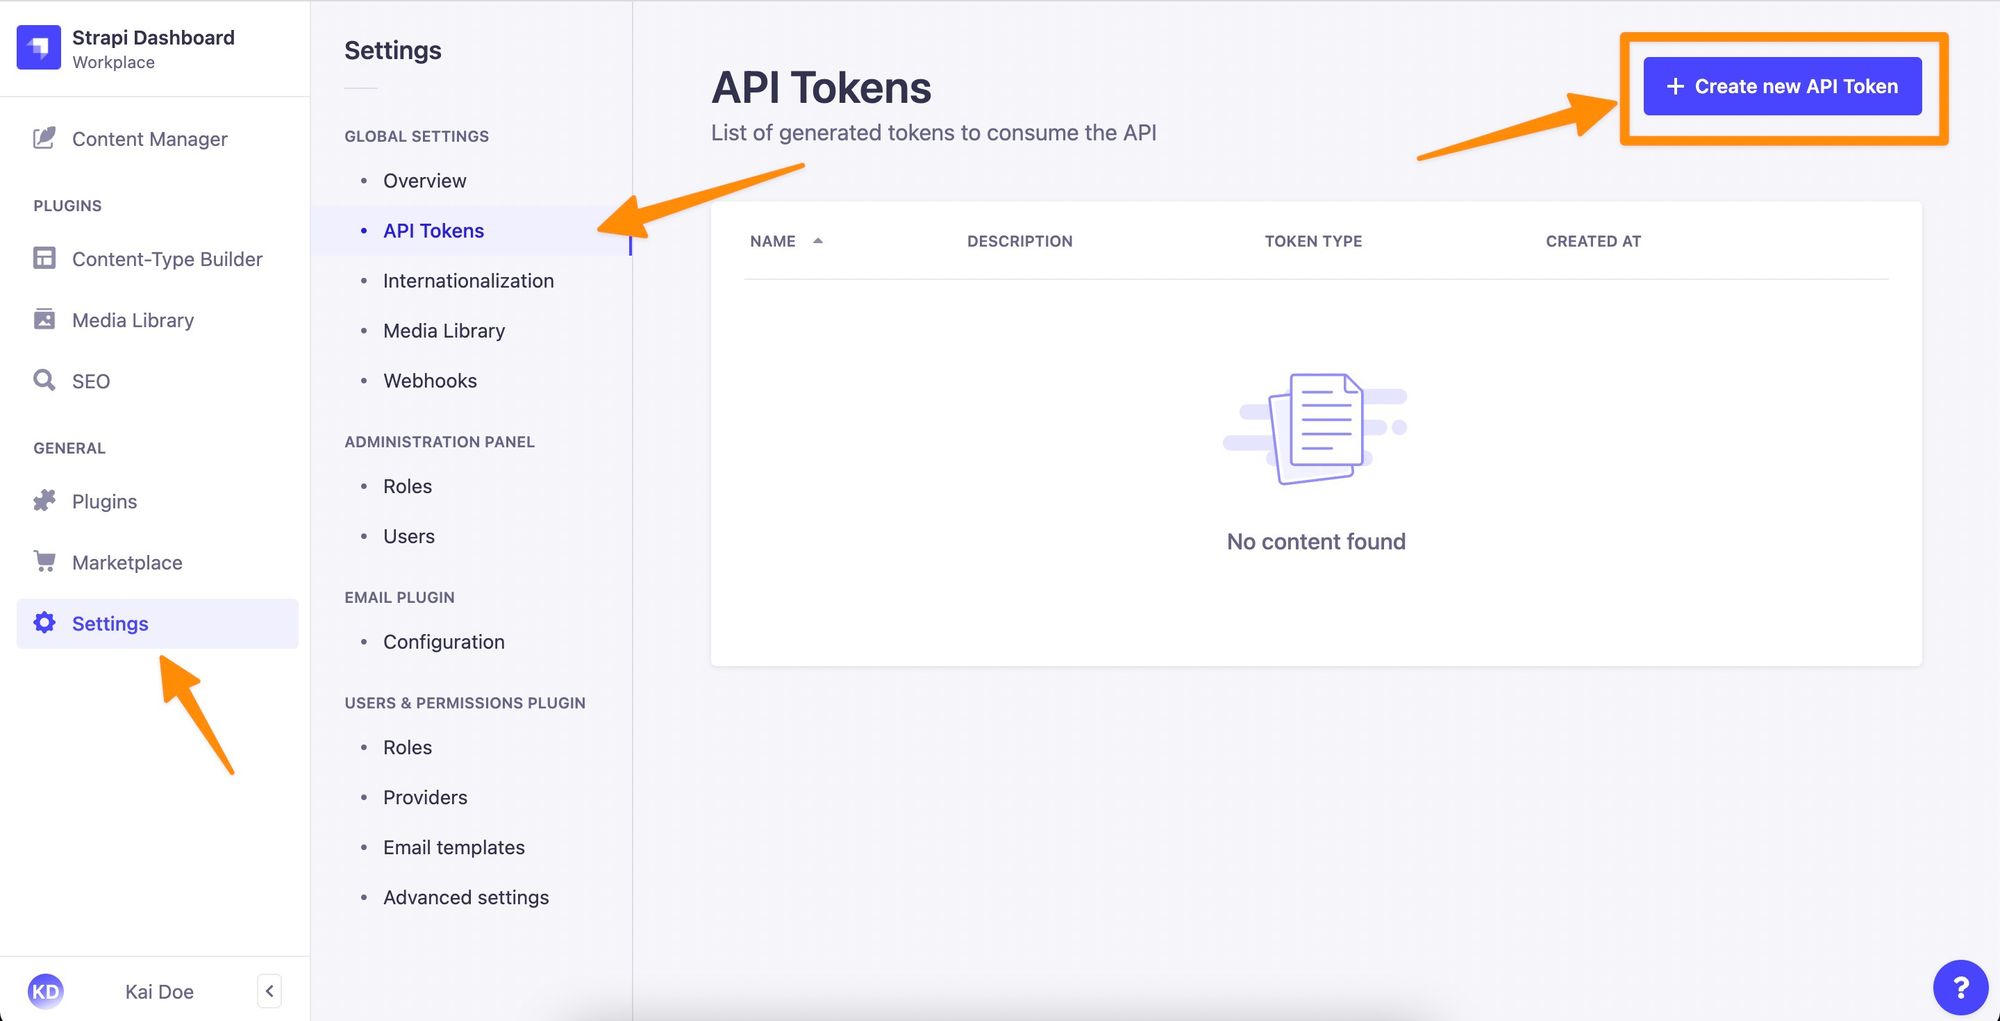
We first need to create a new Strapi API token that Chartbrew will use to get data for visualization. From our Strapi dashboard, we click on Settings then select API Tokens, and finally click on the Create new API Token button.
When you create the token, select Read-only to avoid modifying data by mistake. We recommend selecting the duration as "Unlimited" to avoid changing the token in Chartbrew later on. When the token is created, copy the code that is generated for you.
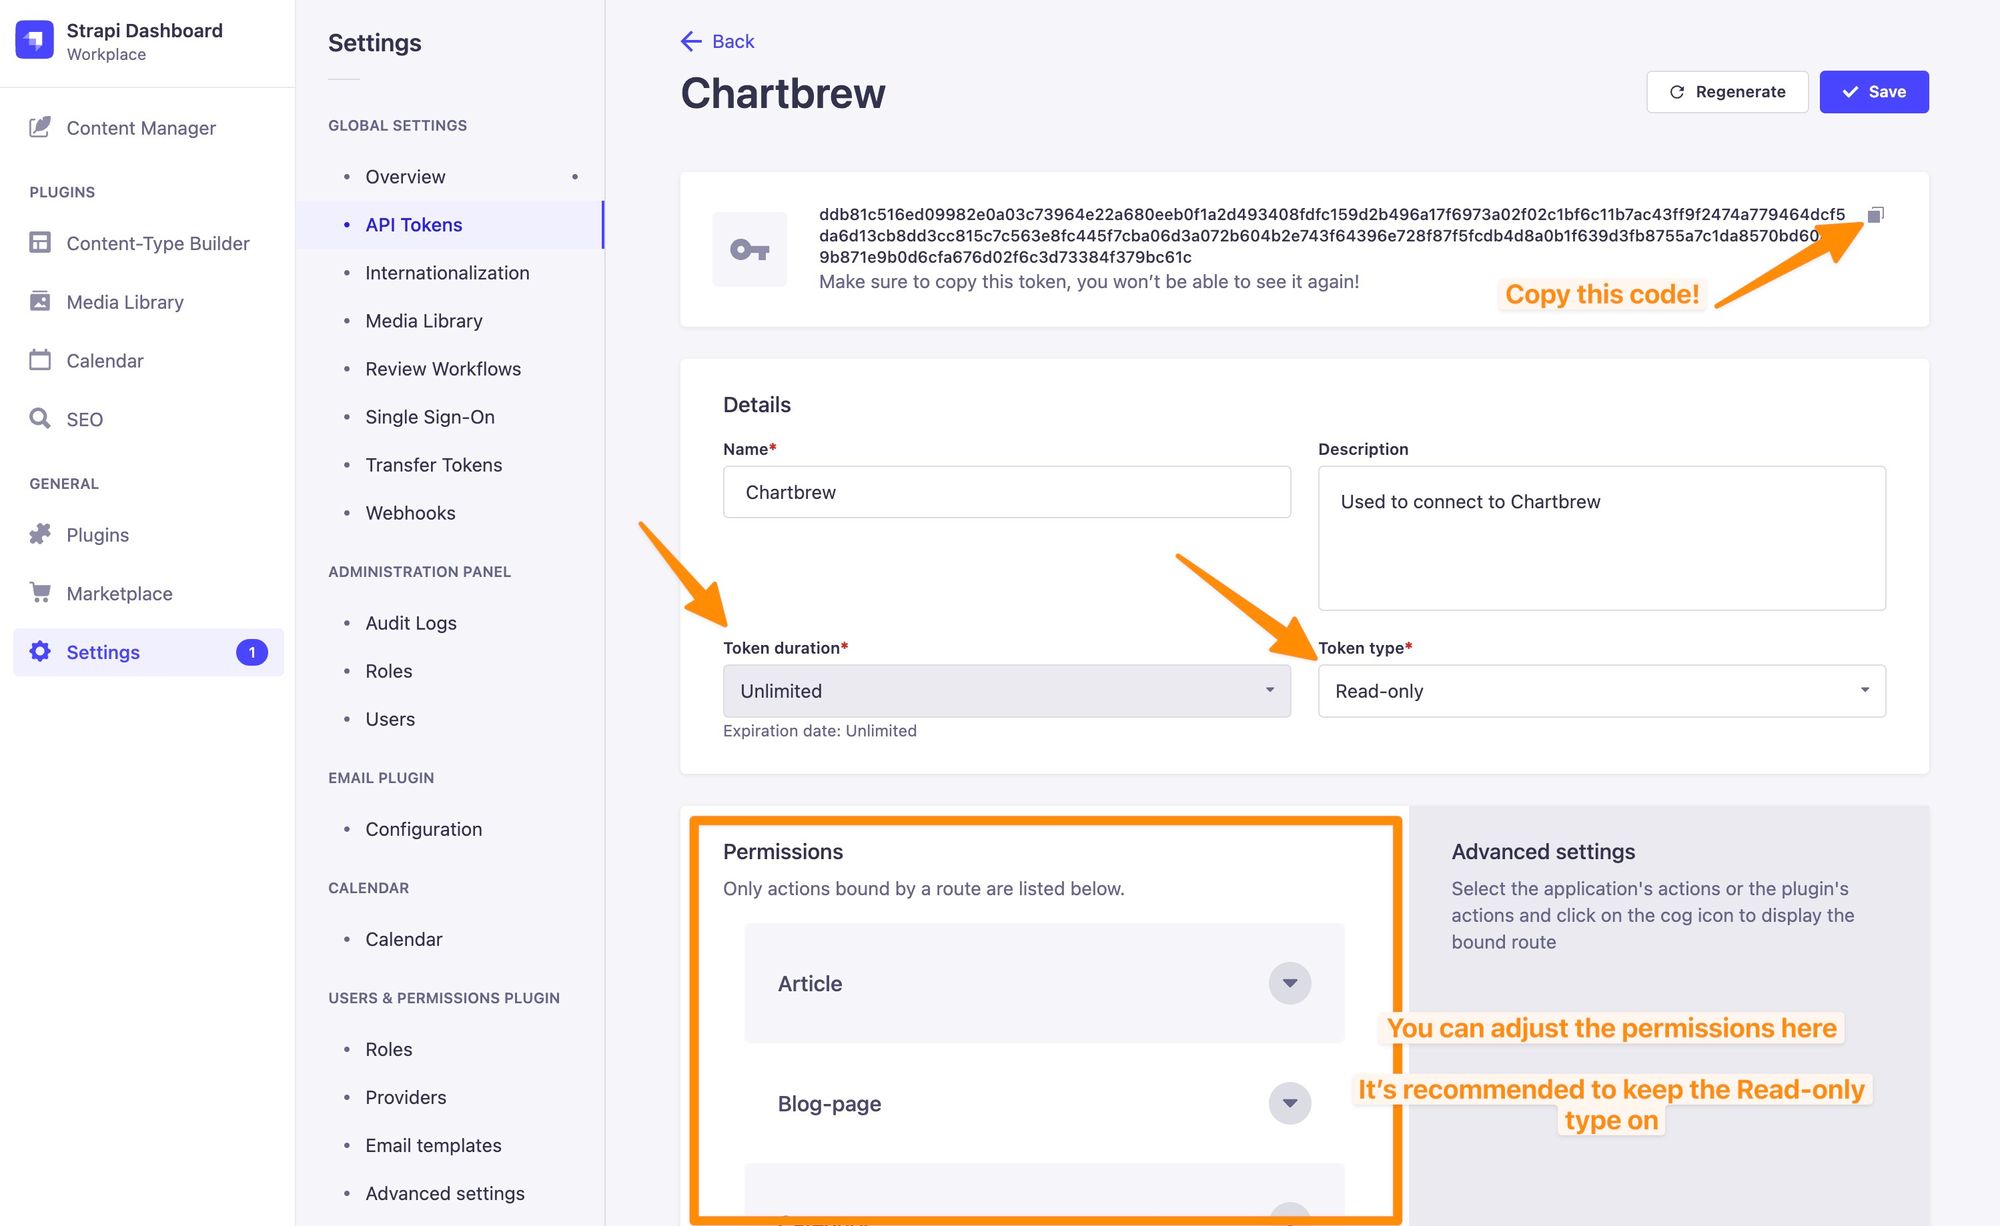
We will use this token to authenticate Chartbrew requests to the Strapi data. Now we are going to head back to Chartbrew and create a new API connection.
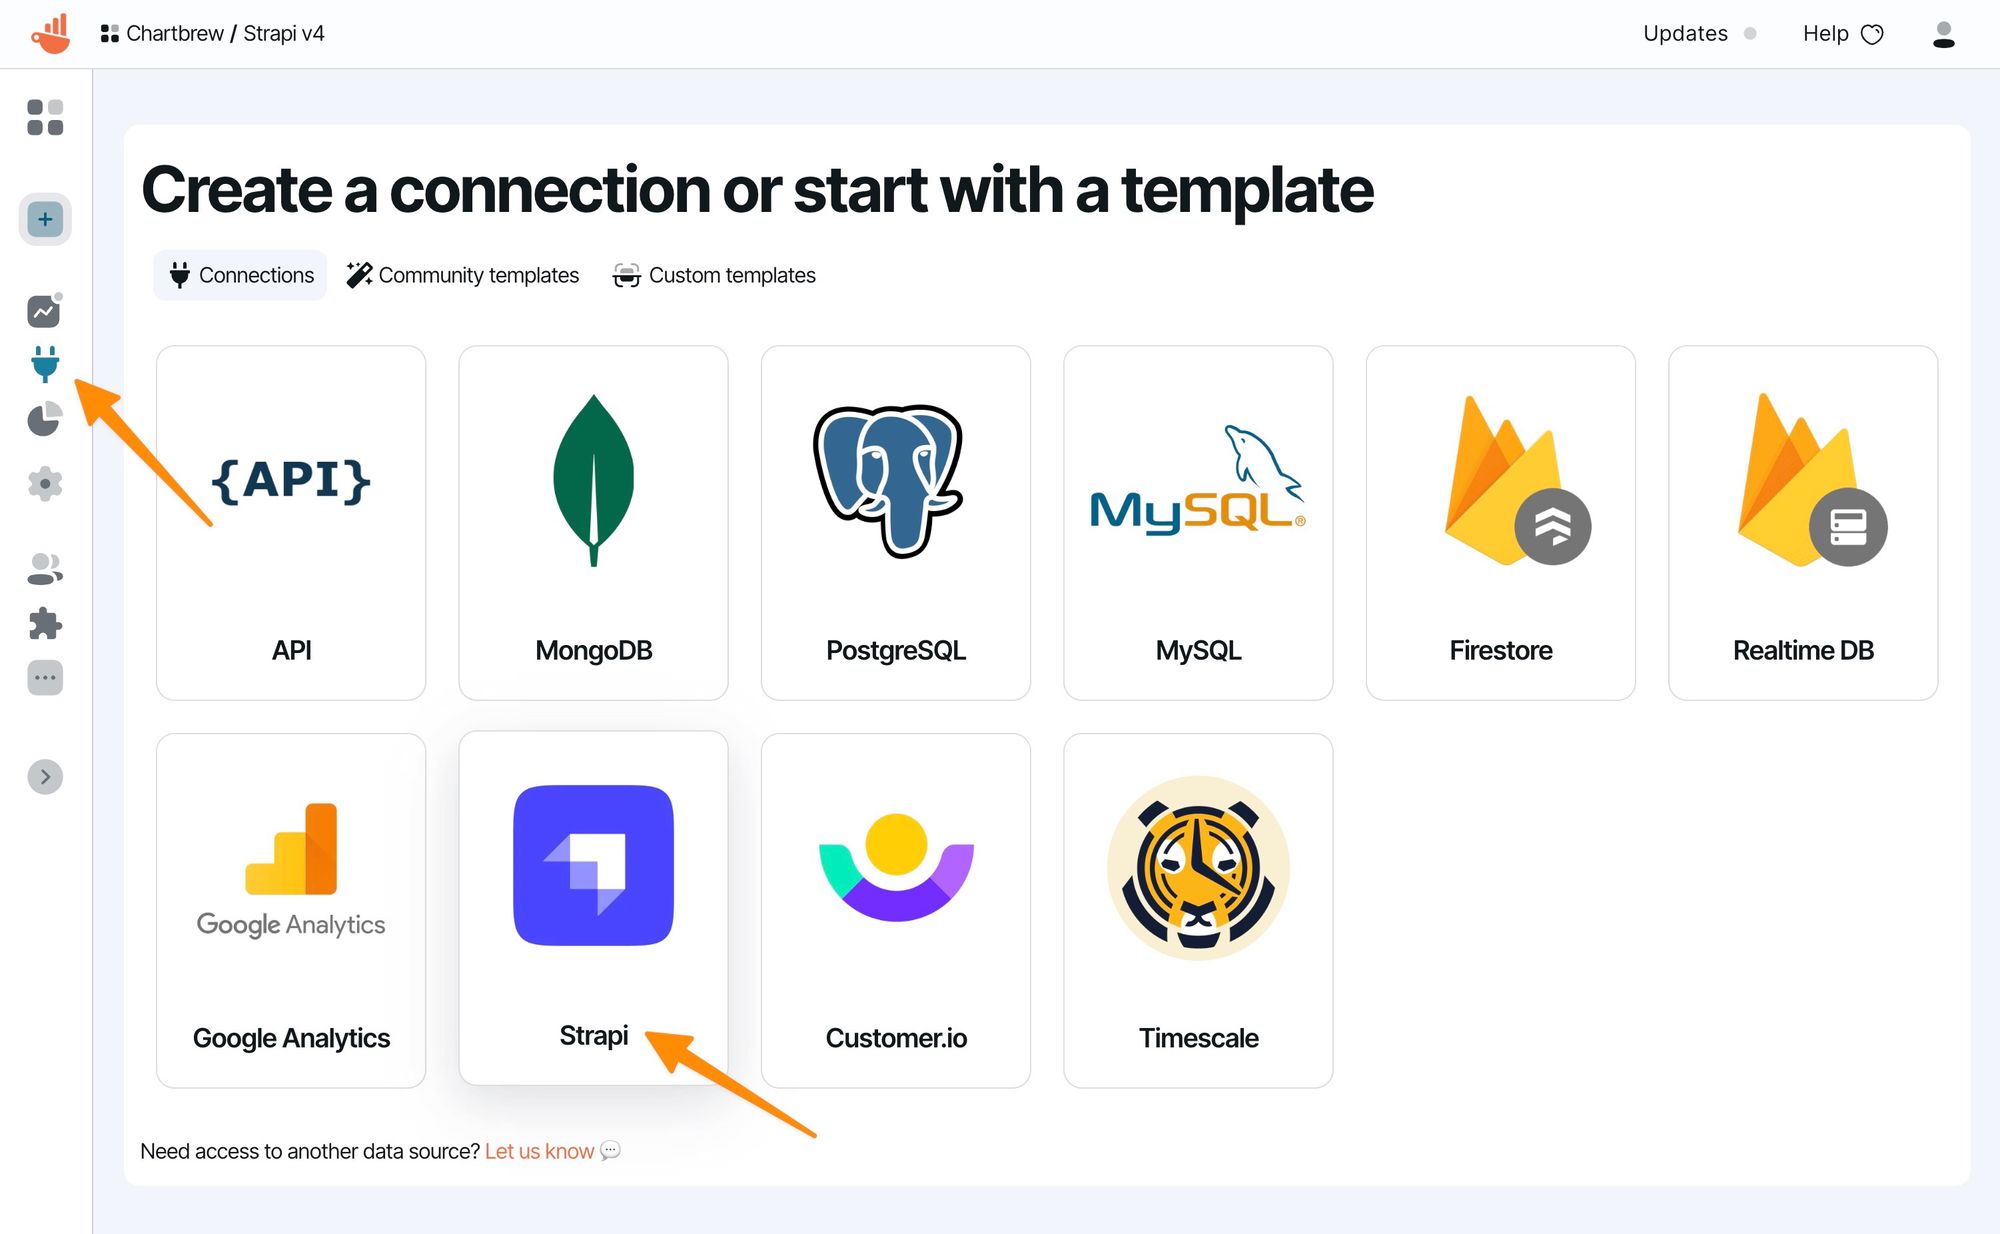
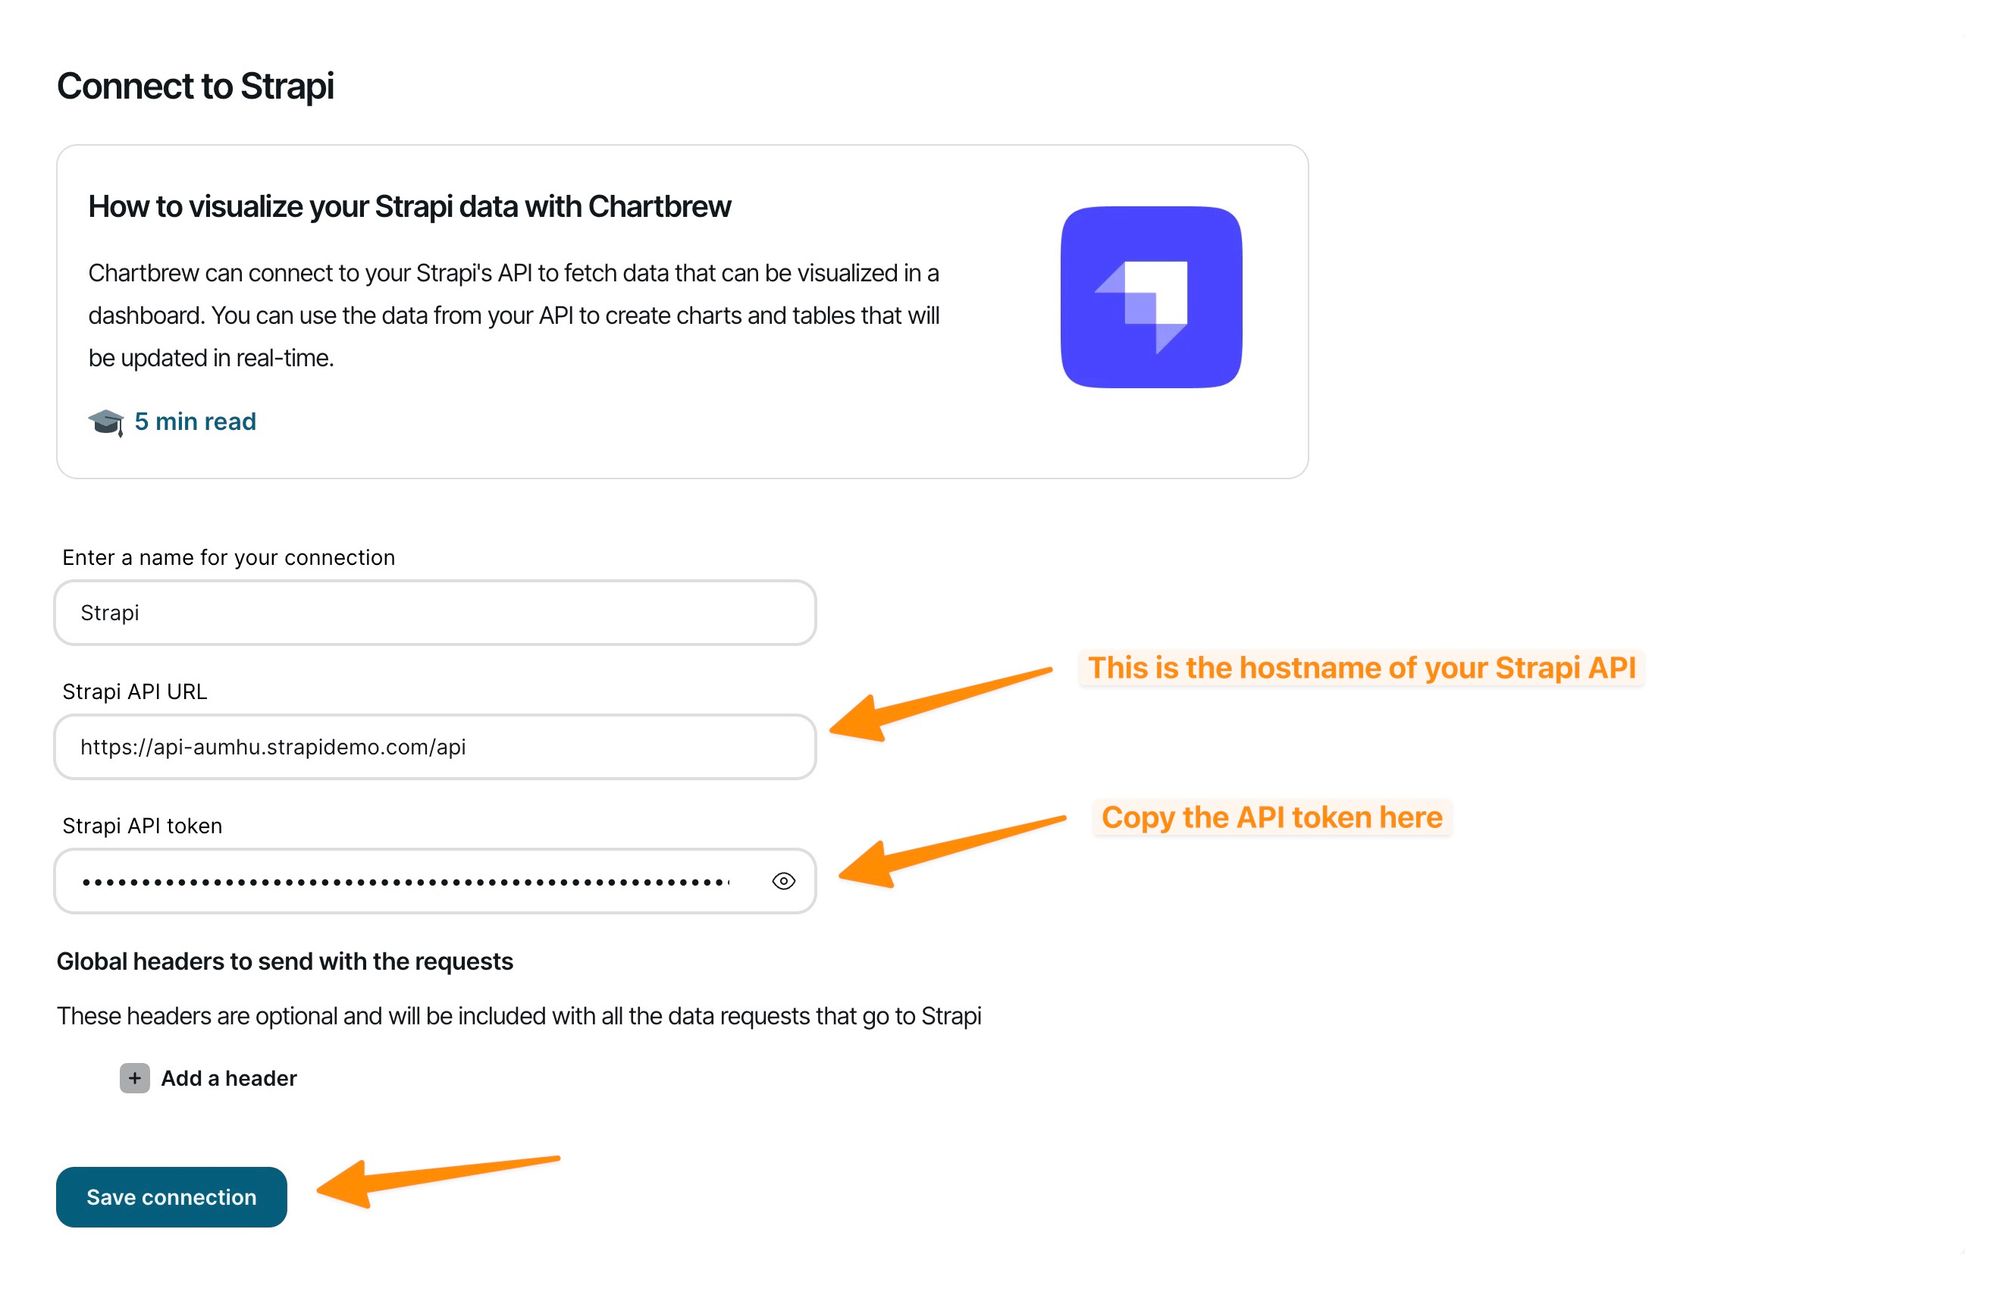
Now save the connection and we are set to create some visualizations.
Things to note here:
- Notice how the hostname ends with "/api". This will work with the default settings in Strapi, but if you changed your API endpoint, you need to change "/api" to match your configuration
- When testing the configuration will result in an error because Strapi returns an error when trying to get information from the root of the API. If you want to double-check that the connection is working, add the name of a content type at the end of your hostname (e.g. https://apixxxx.strapidemo.com/api/articles), but make sure you don't save the connection with the content type at the end.
Creating charts from Strapi data
We are going to create three charts to showcase the capabilities of Chartbrew:
- A doughnut chart showing how many restaurants are in each category
- A bar chart showing the restaurants in the order of their average reviews
- A KPI chart showing the total number of users registered with the site
Restaurant categories chart
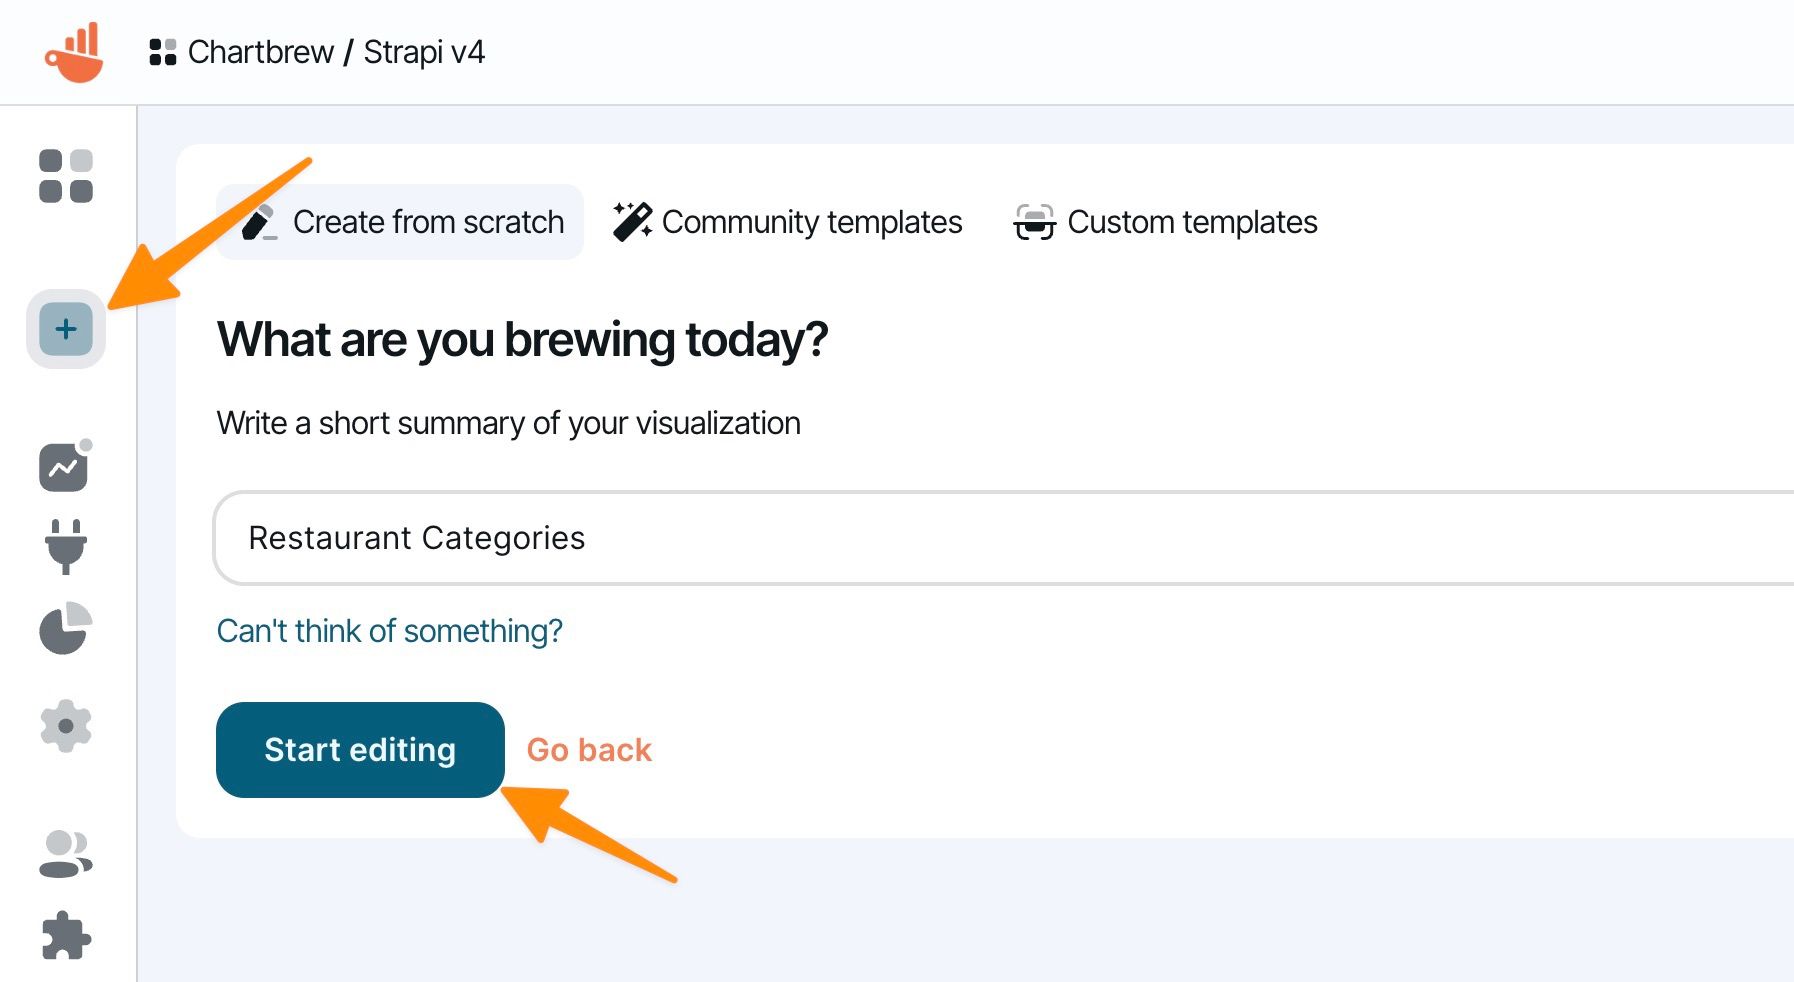
After creating the new empty visualization, we will be redirected to the chart editor page where we can configure the data request and chart settings.
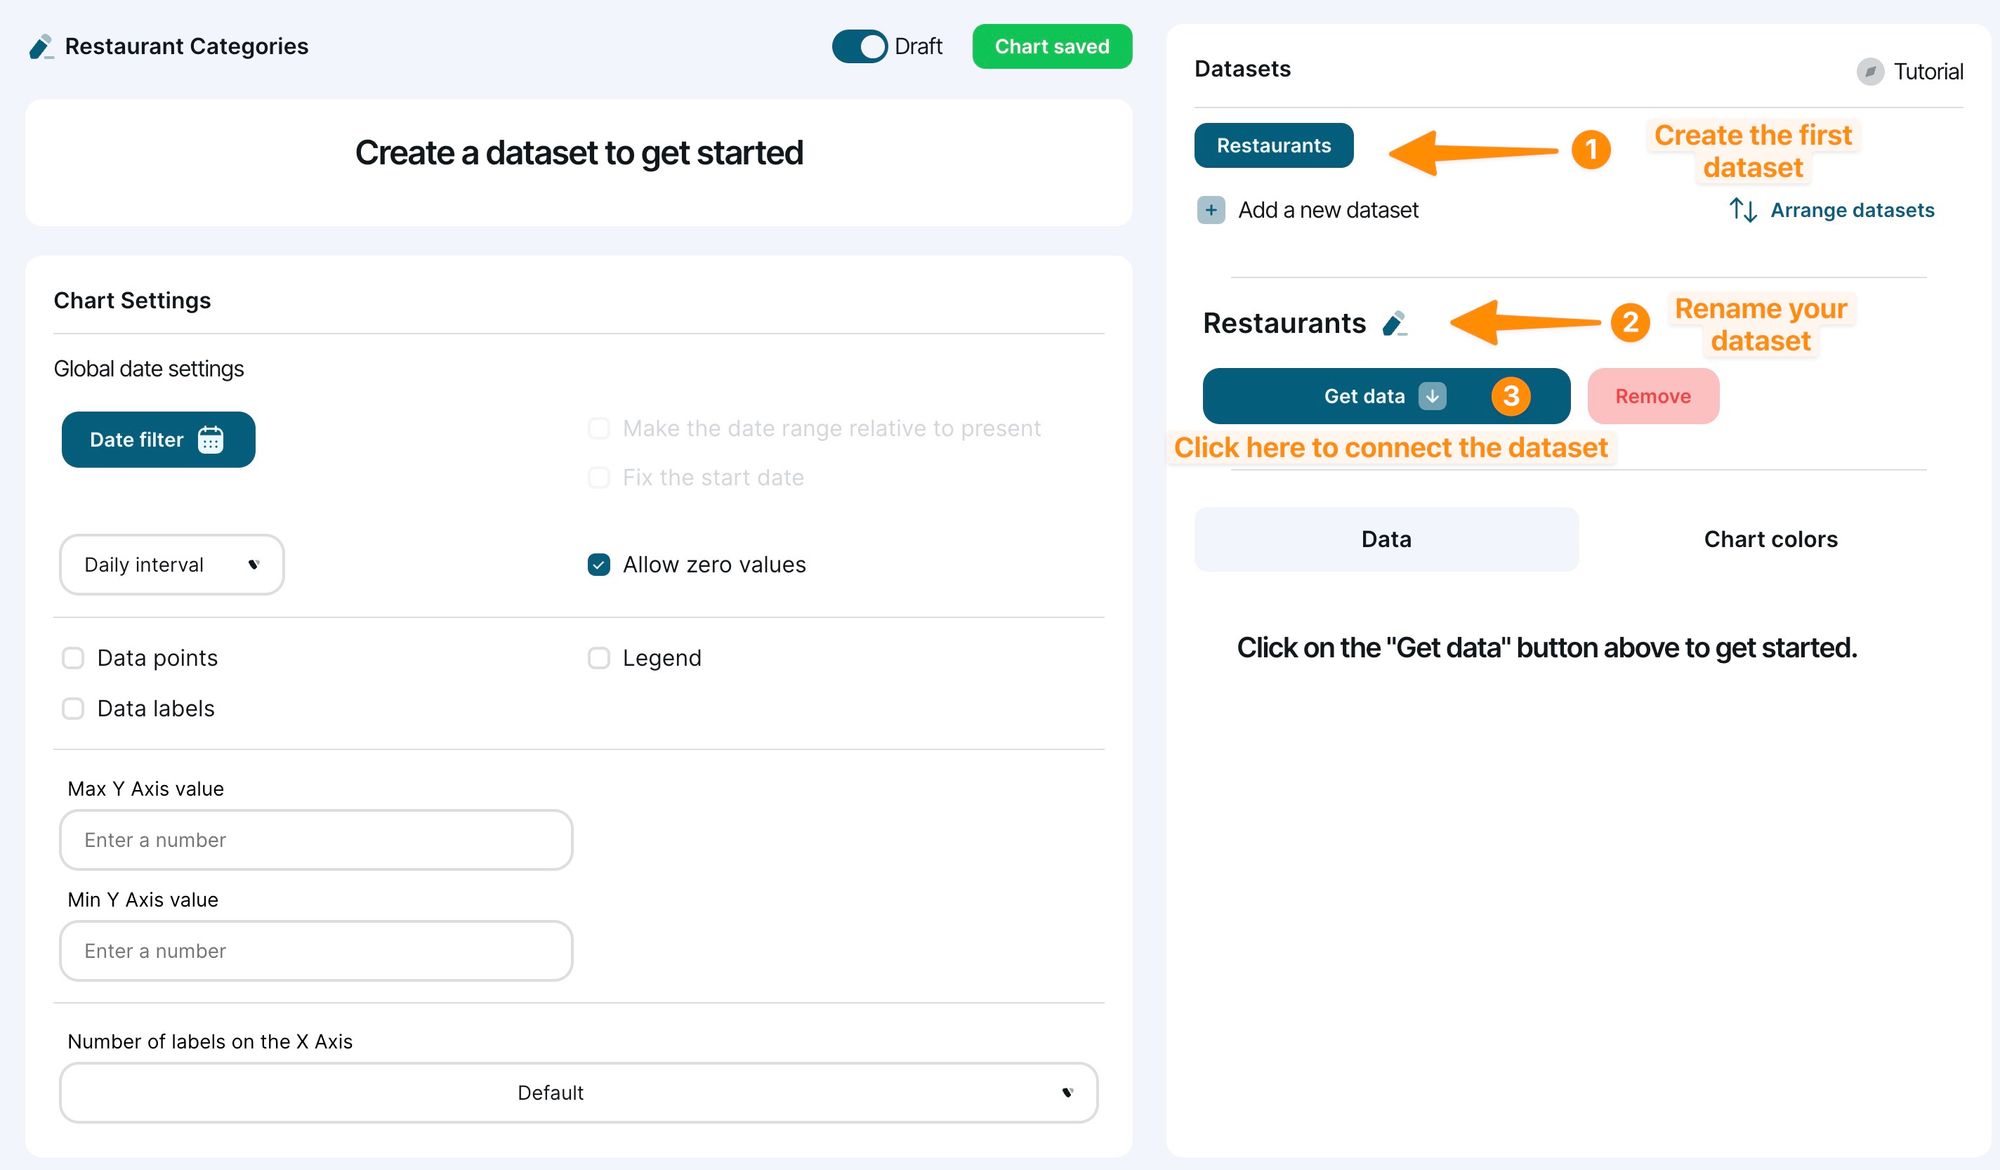
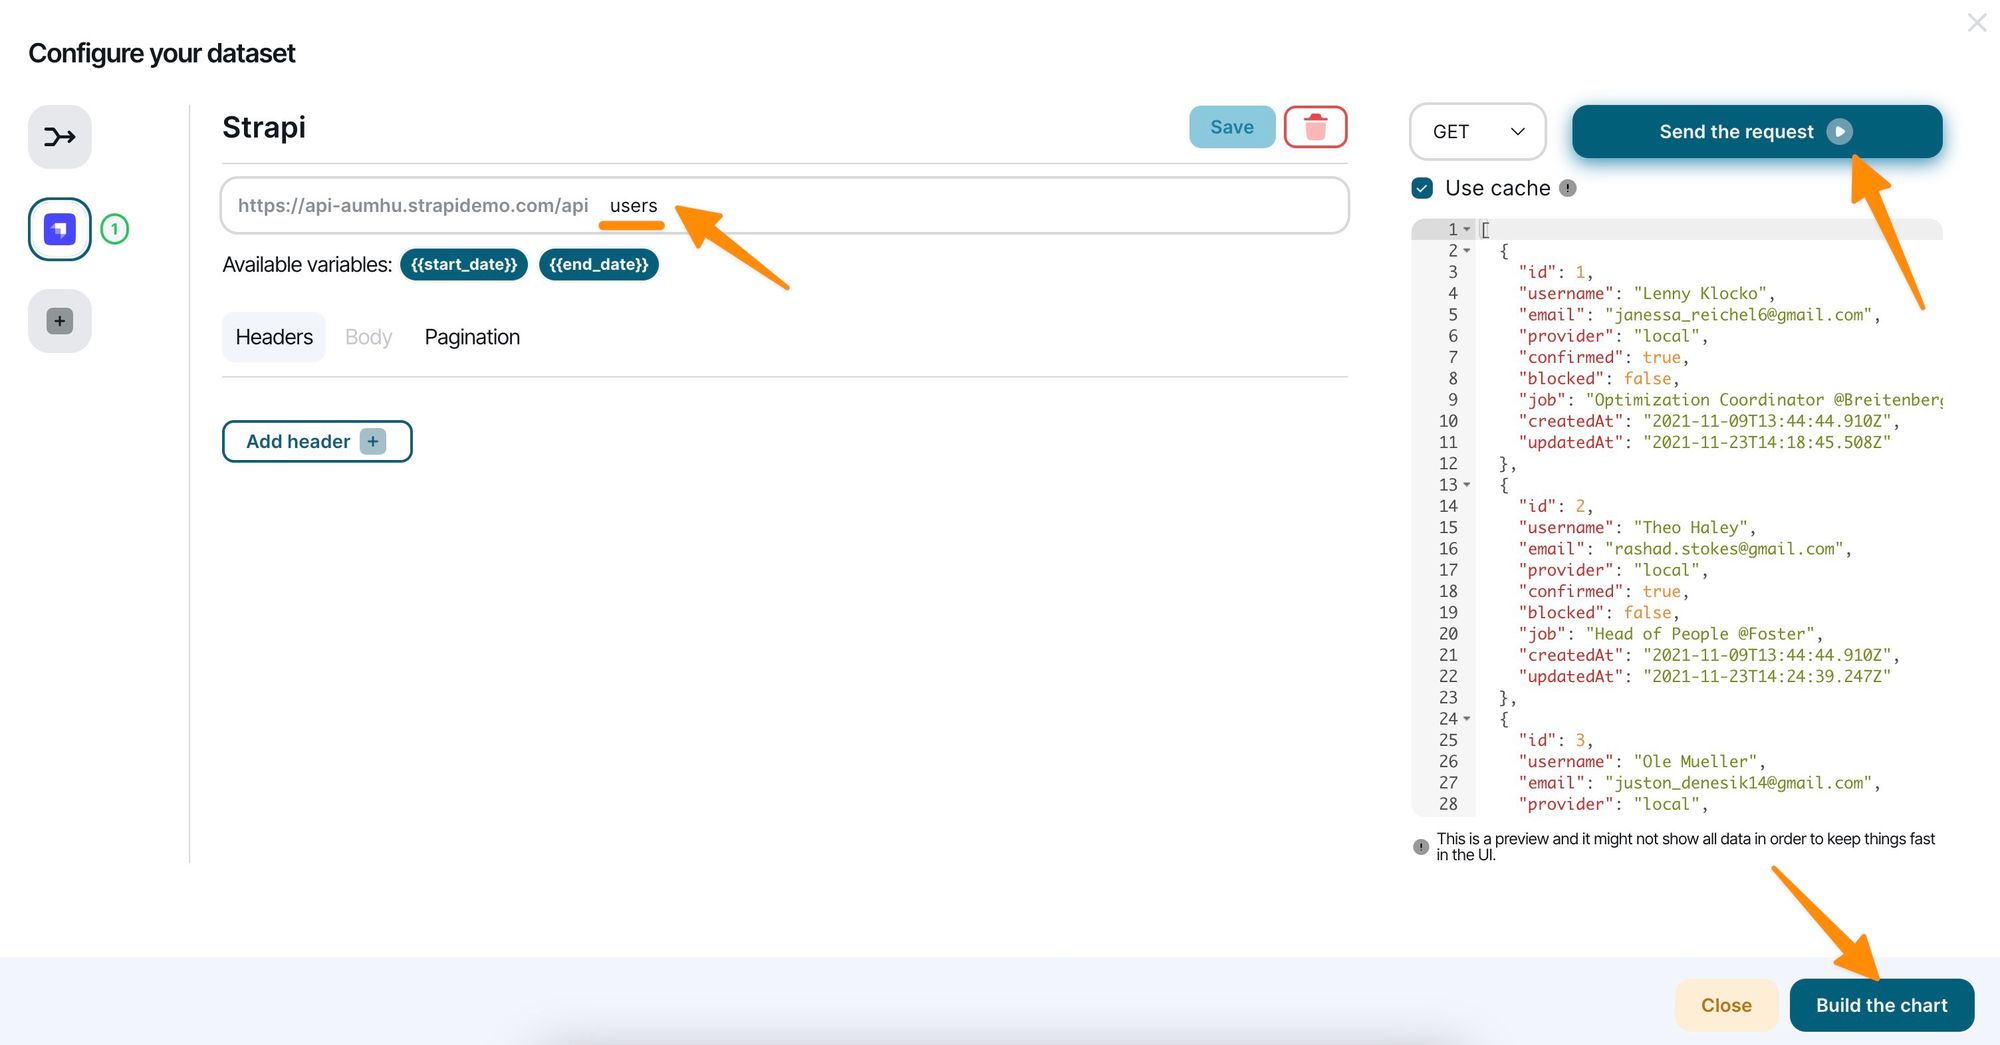
To start connecting the chart to the Strapi API, we have to create the first dataset, change the name if you wish, then click on the Get data button to connect the dataset to our Strapi connection.
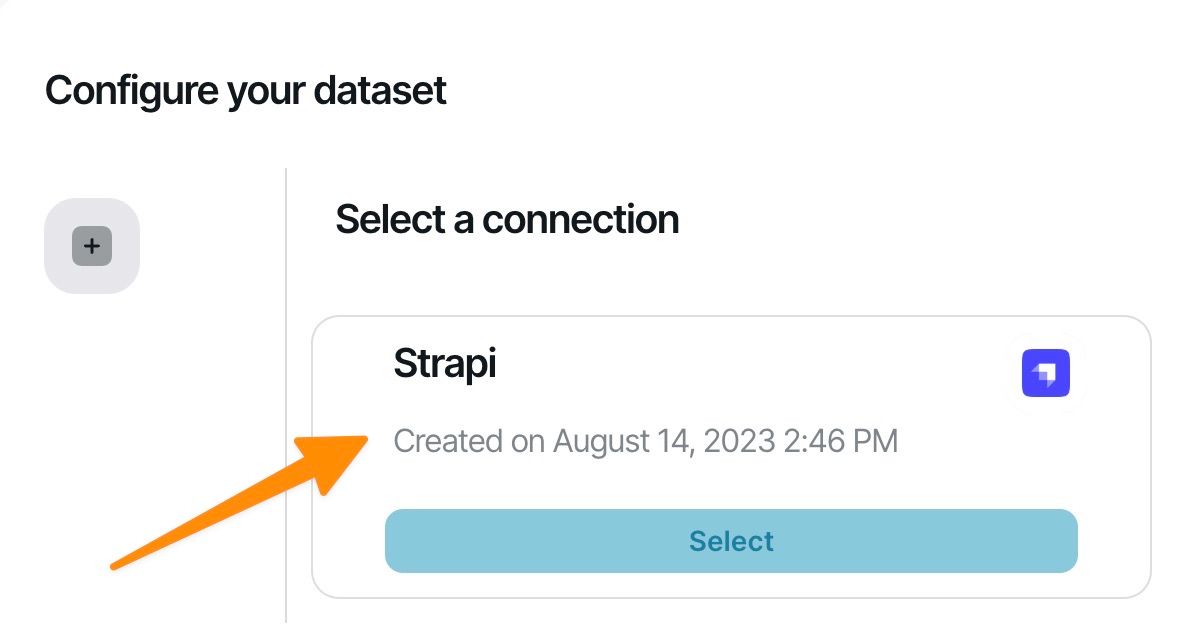
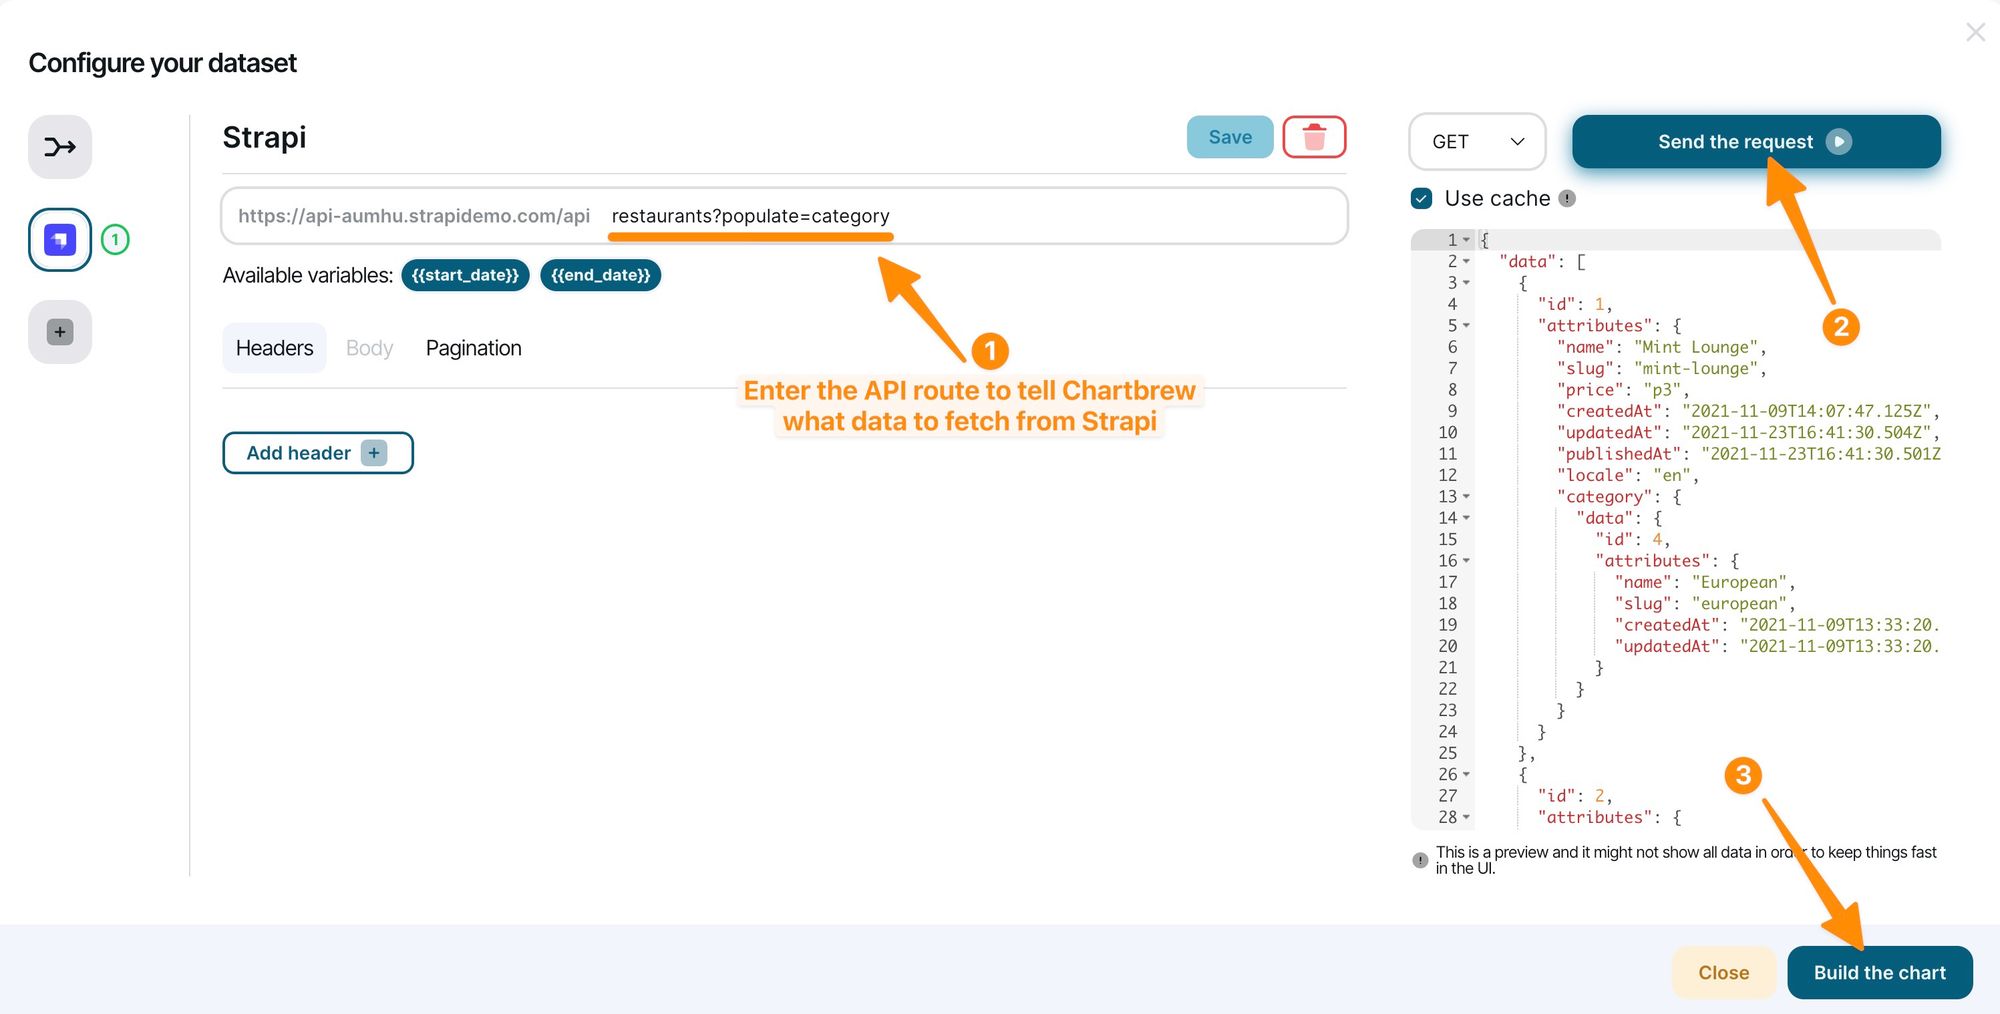
To get the right data, we only have to add "restaurants?populate=category" in the API route. This API call will get restaurant data along with data about each category. After we click on the build button, we will see Chartbrew attempting to create a time series from the dataset. Unfortunately, the Strapi test data created all the content at the same time, so we cannot create good examples of time series with this data. If you are using your Strapi application, you might see a time series chart appearing there.
Let us start by changing the X-Axis to the name of the category and let the Y-Axis as a count of restaurant IDs (it should already be selected).
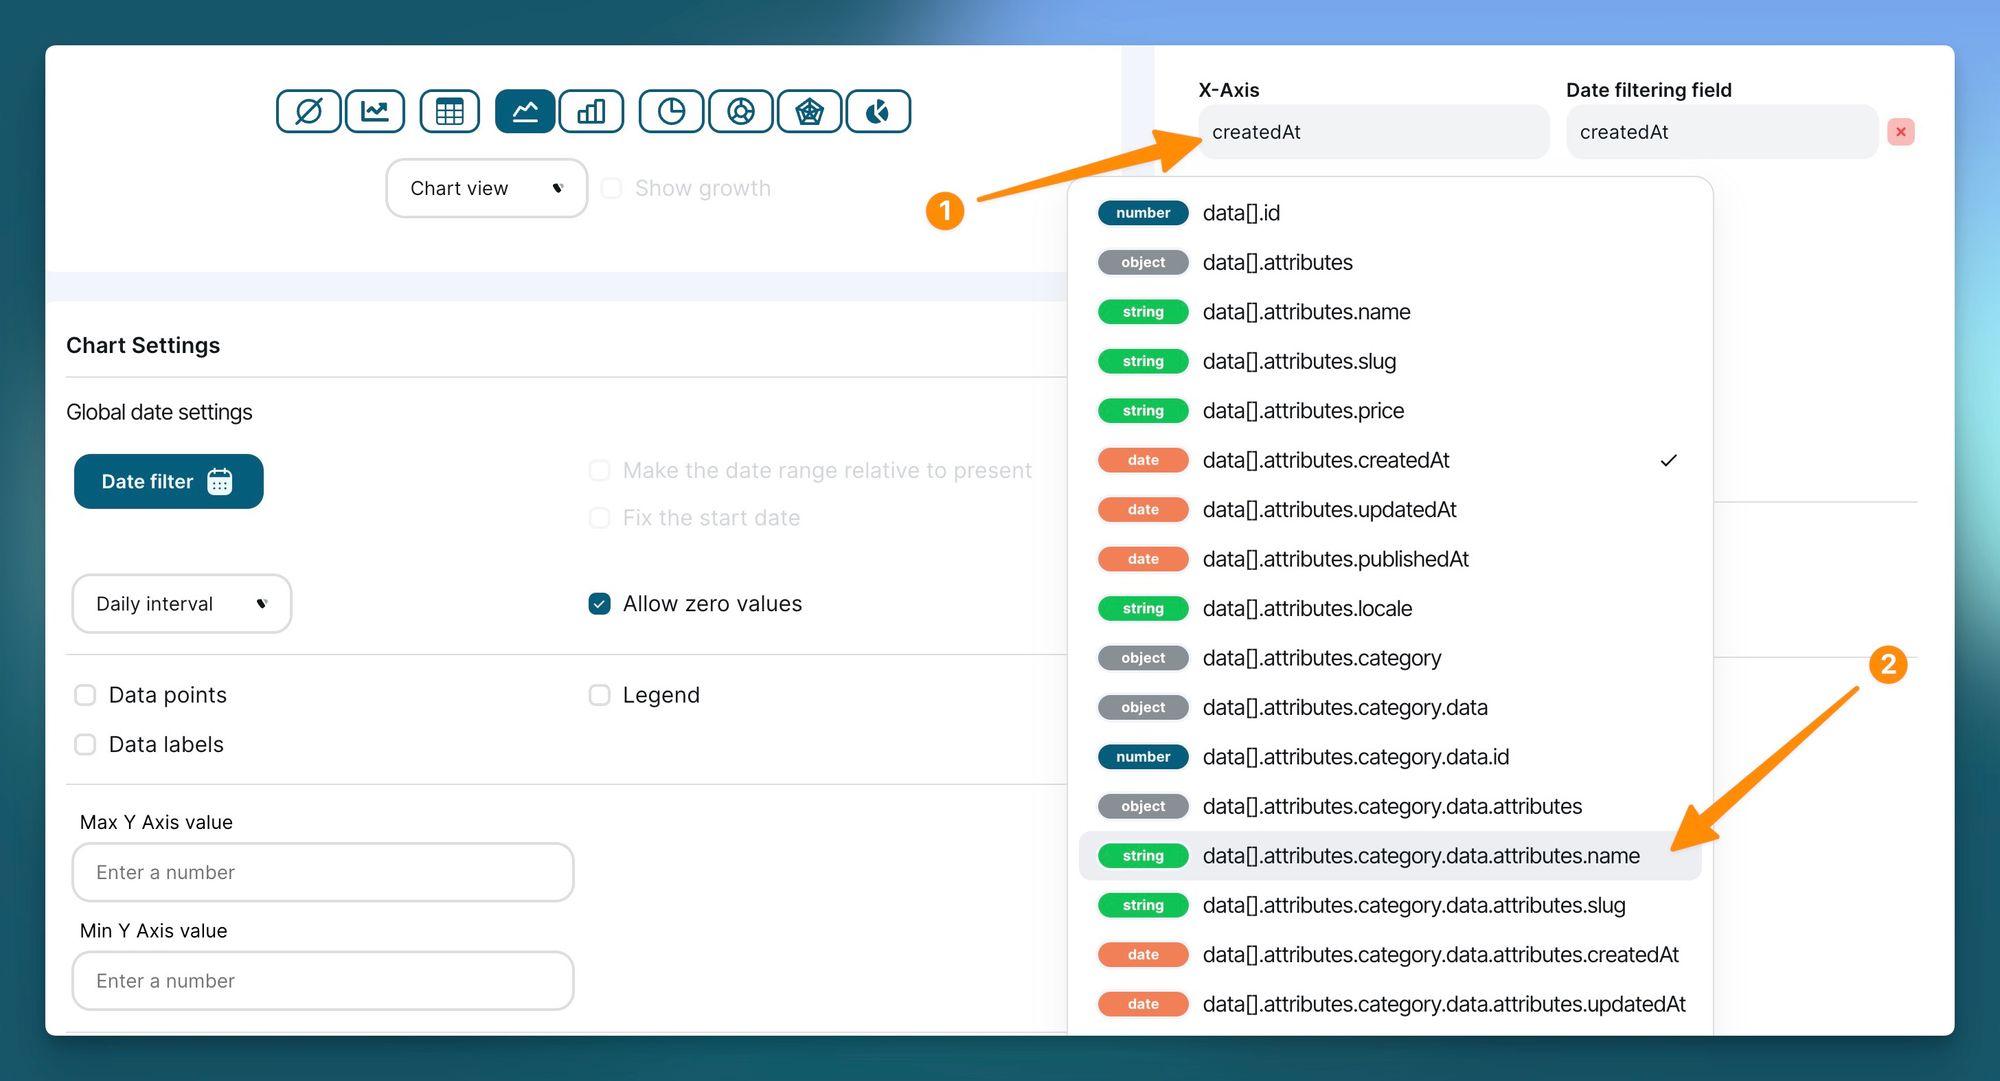
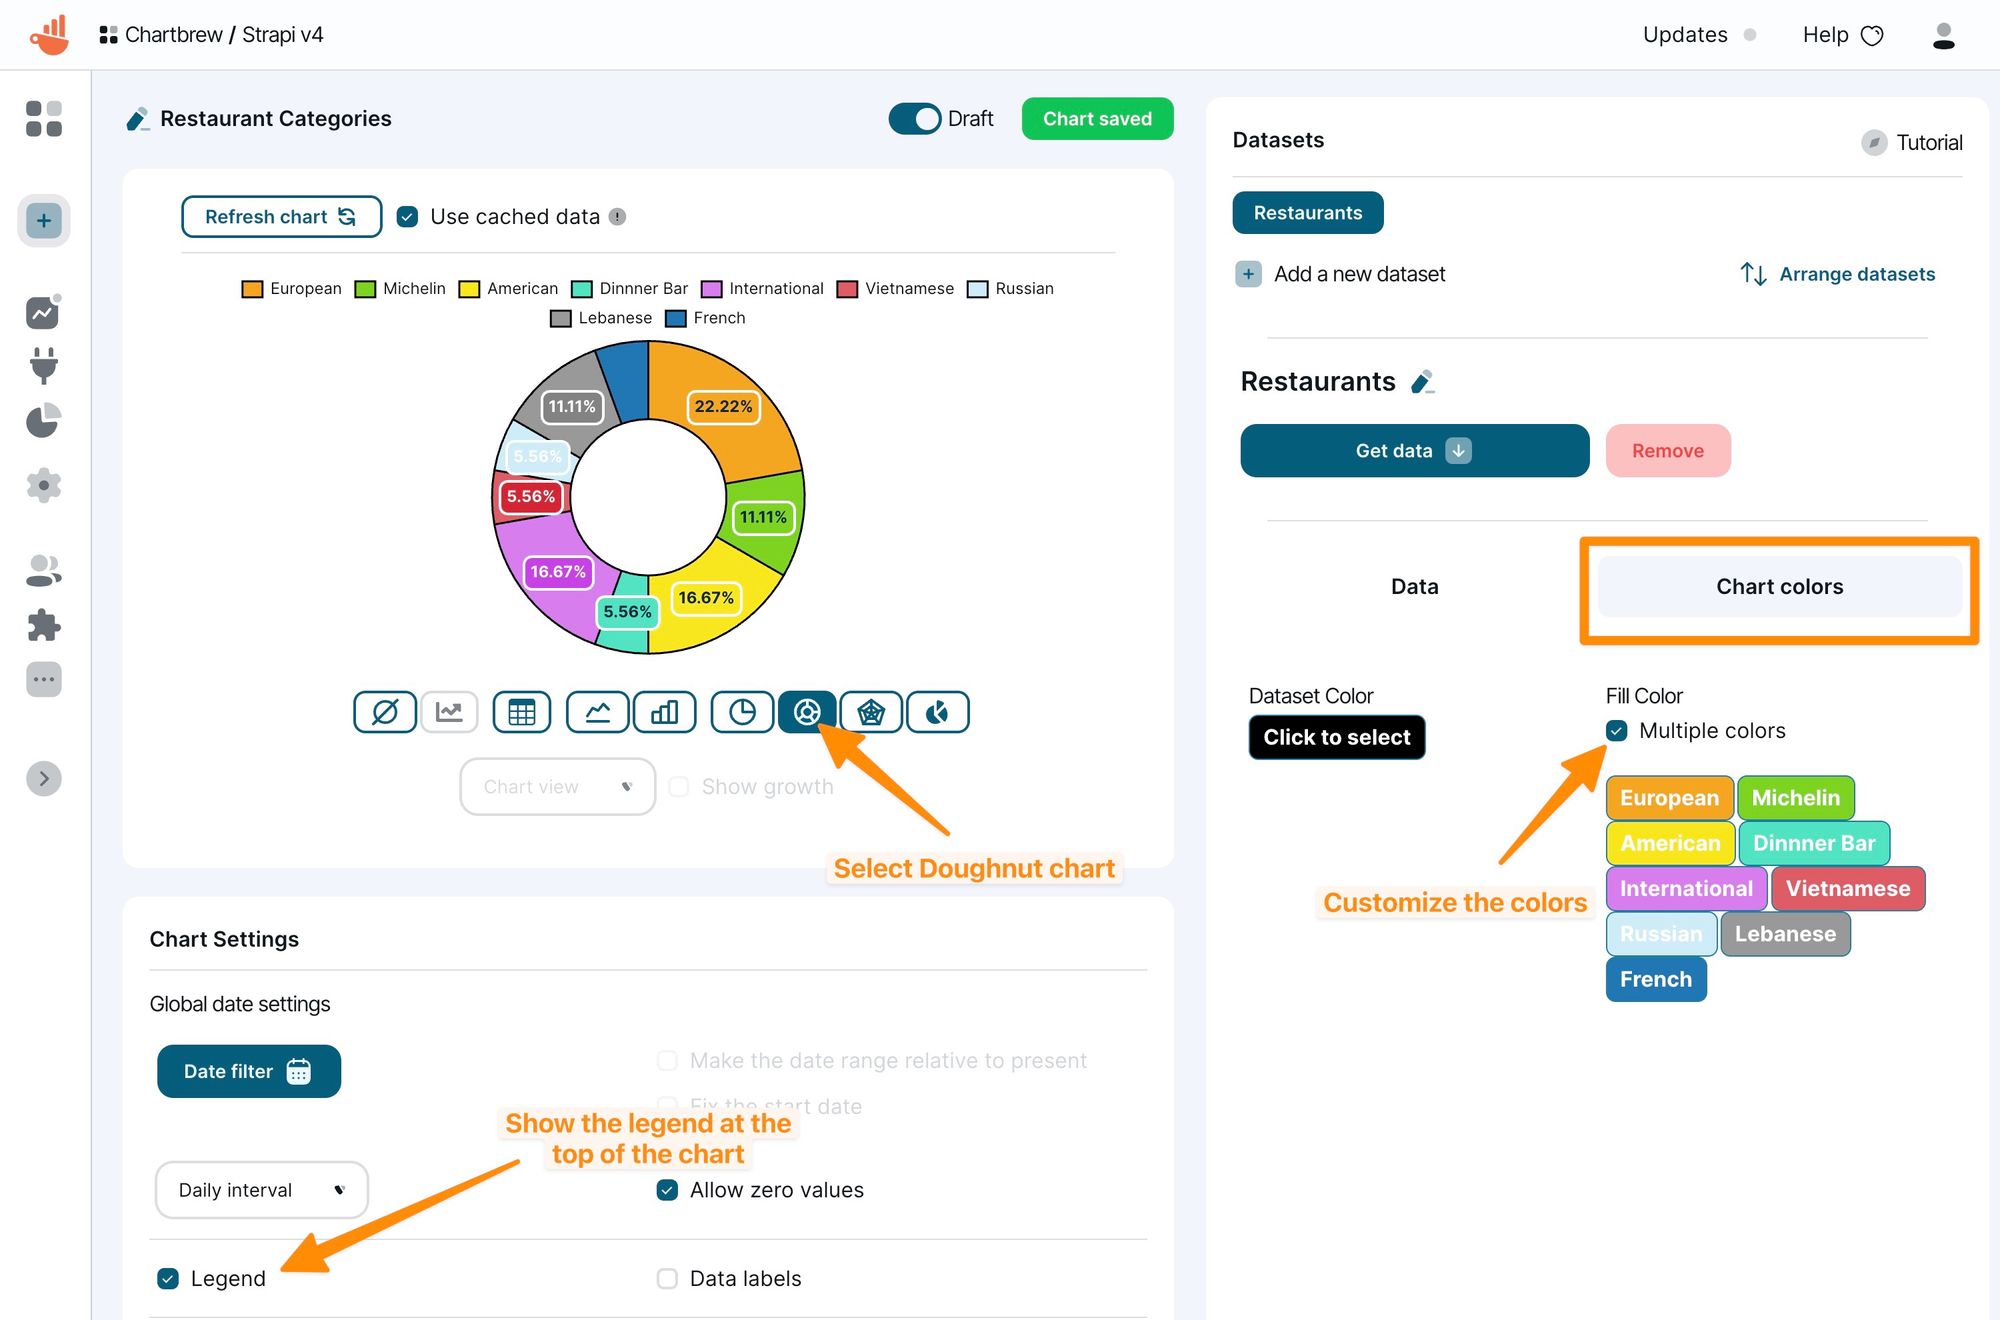
The chart will reload automatically to display the categories on the X-Axis and it will show the number of restaurants in each category on the Y-Axis. Next, let's modify this chart to be shown in a doughnut chart since the dataset can be more visible in that format.
Restaurant reviews chart
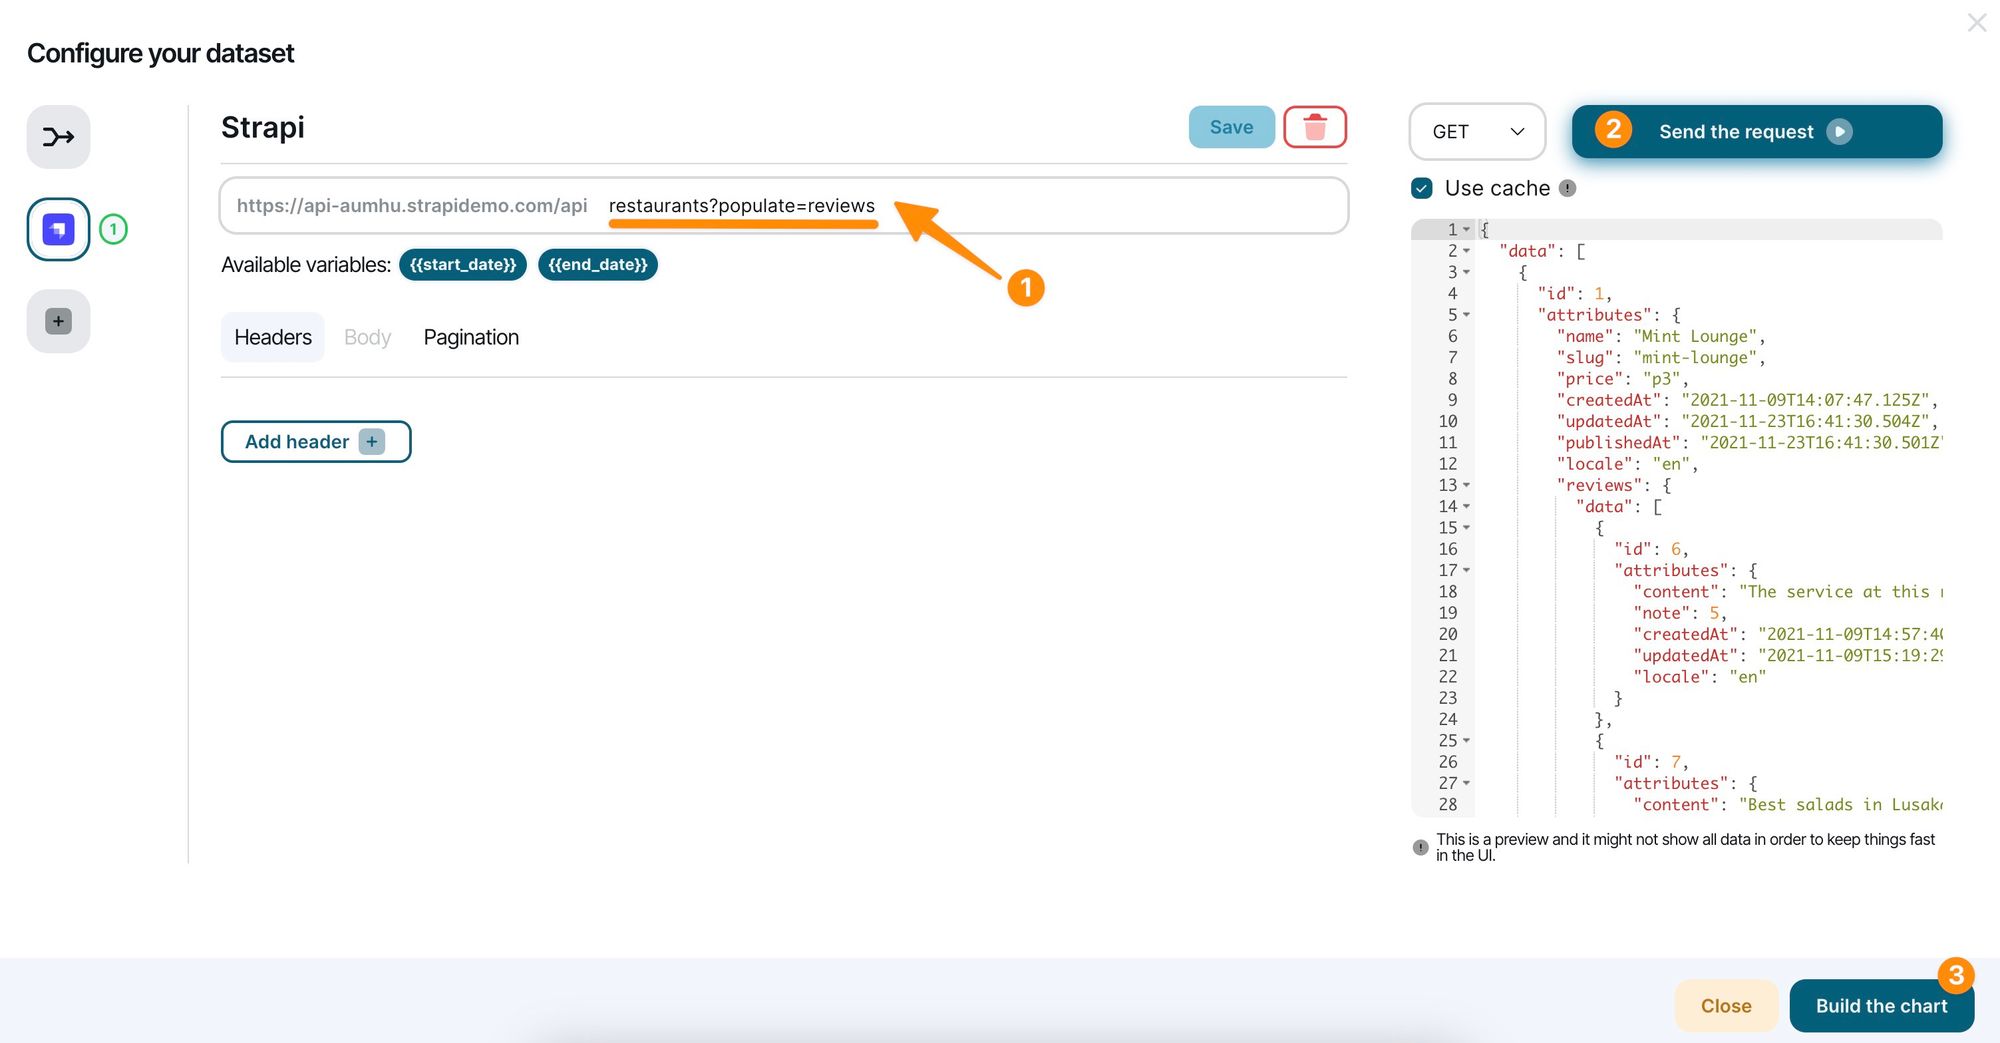
For this example, we create a new empty chart as we did above, but modify the API request slightly to populate the reviews, rather than the categories.
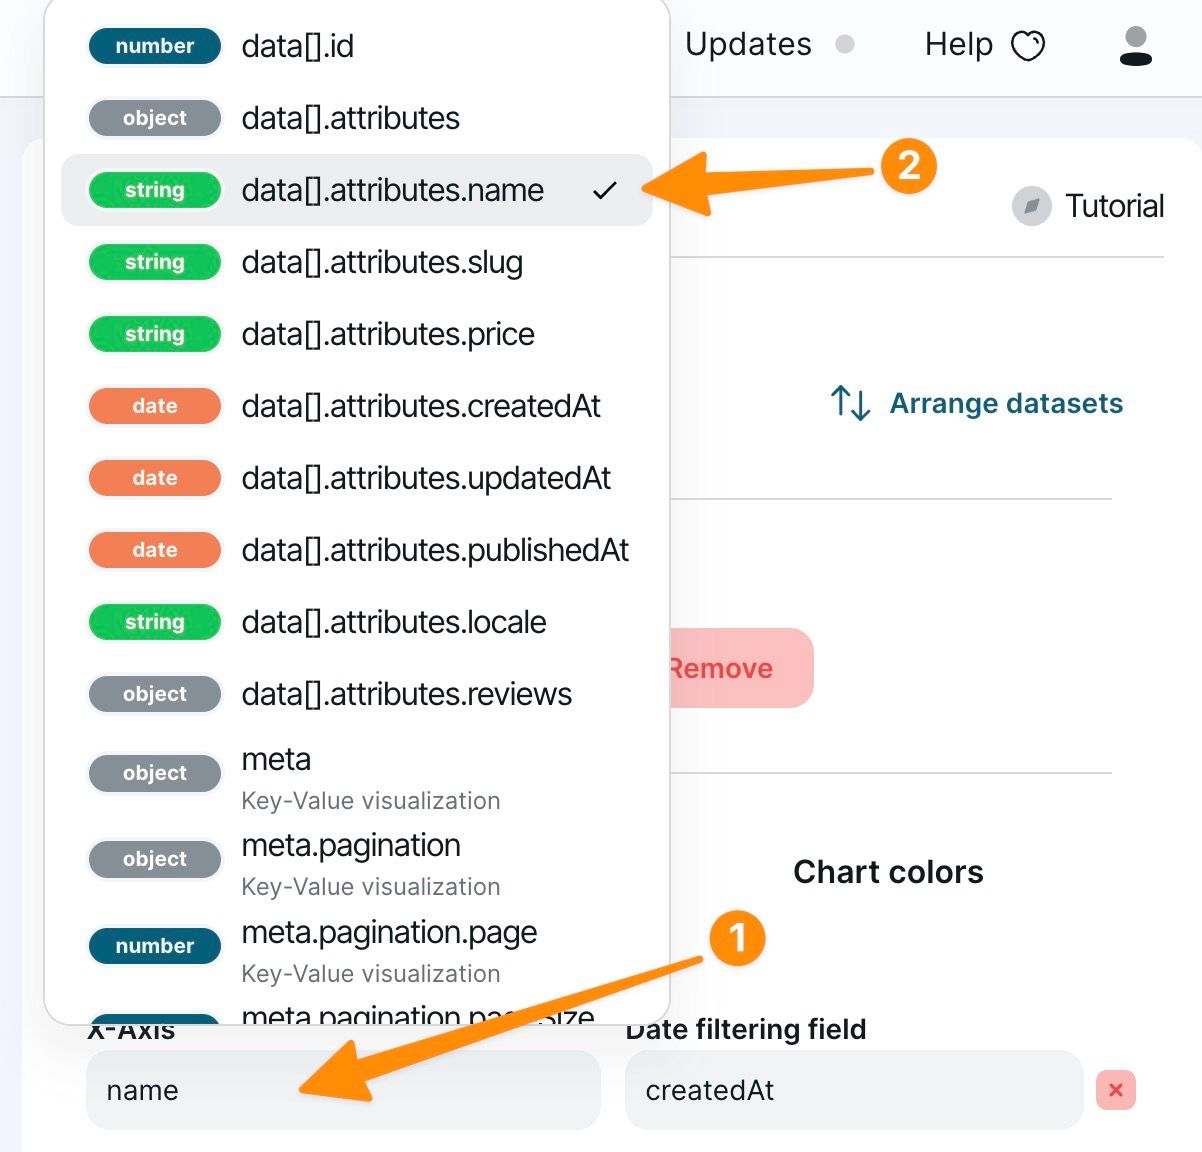
Next, we are going to select the restaurant name to display on the X-Axis:
On the Y-Axis we want to average the review score from all the reviews for each restaurant. The review score is held in the "note" field in each review object.
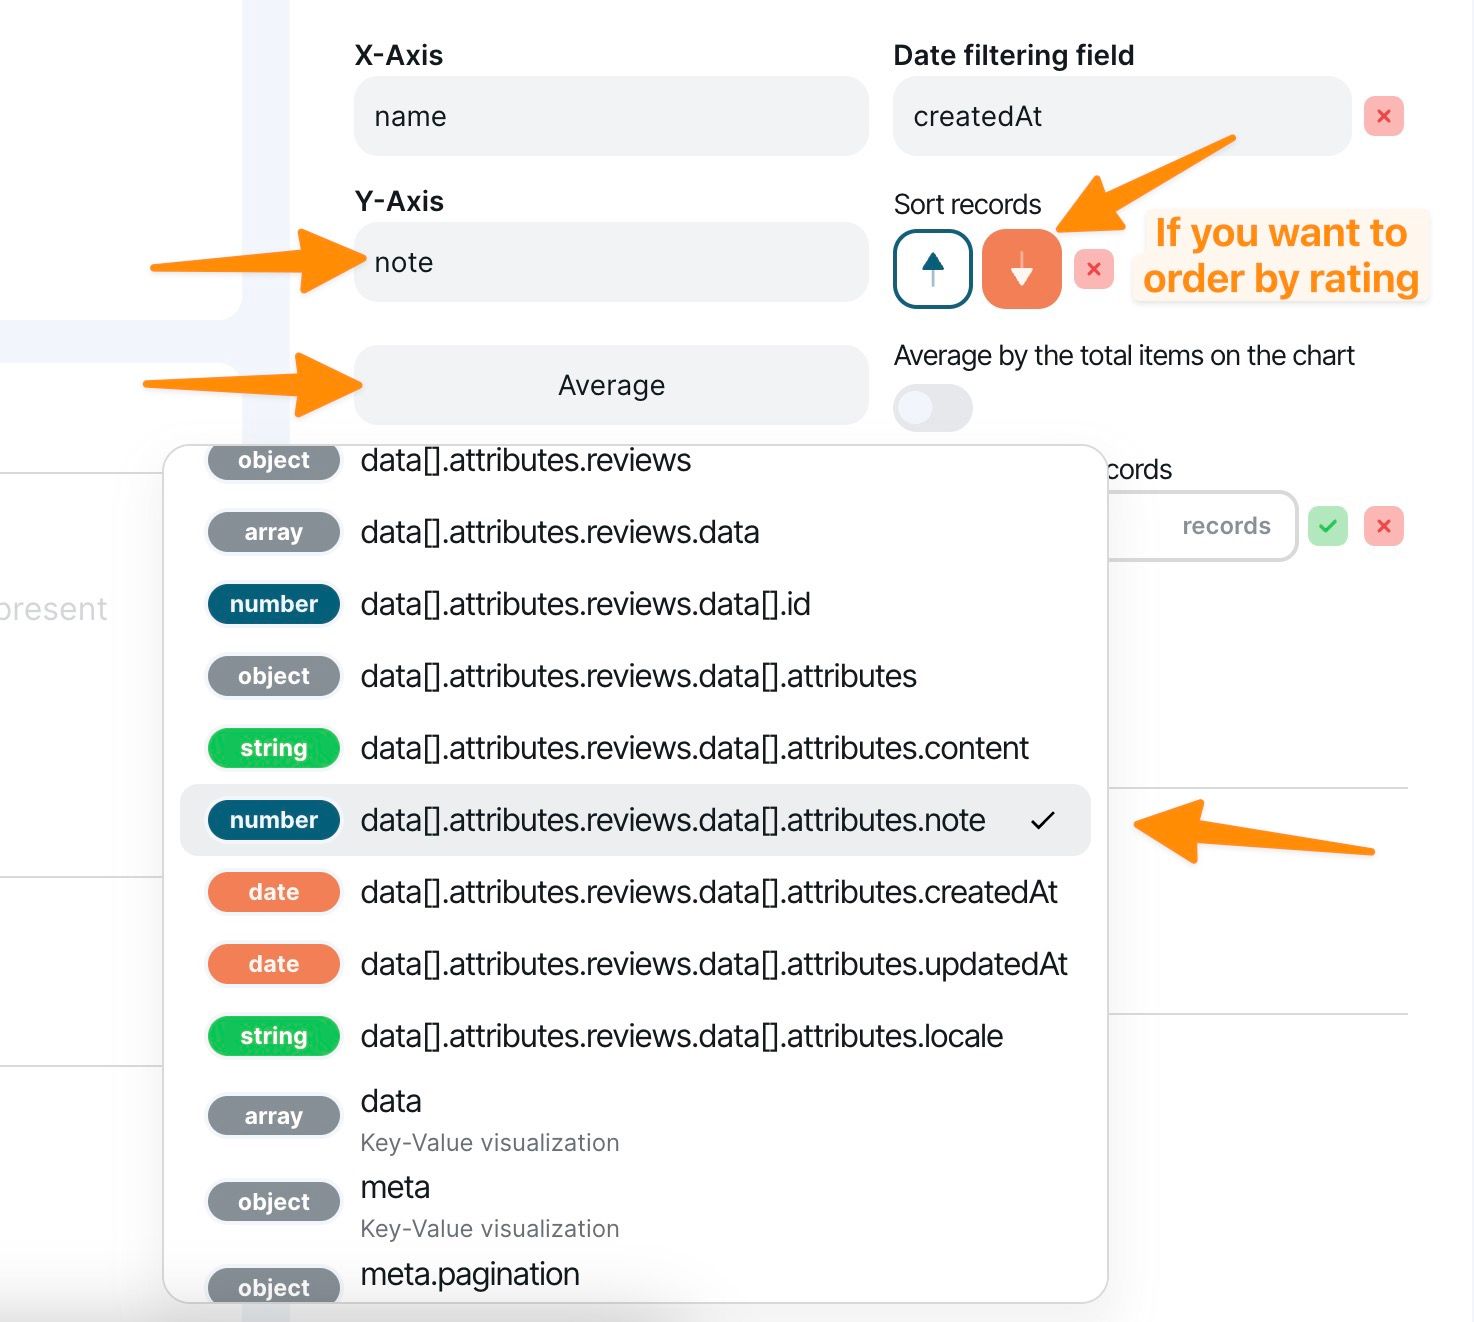
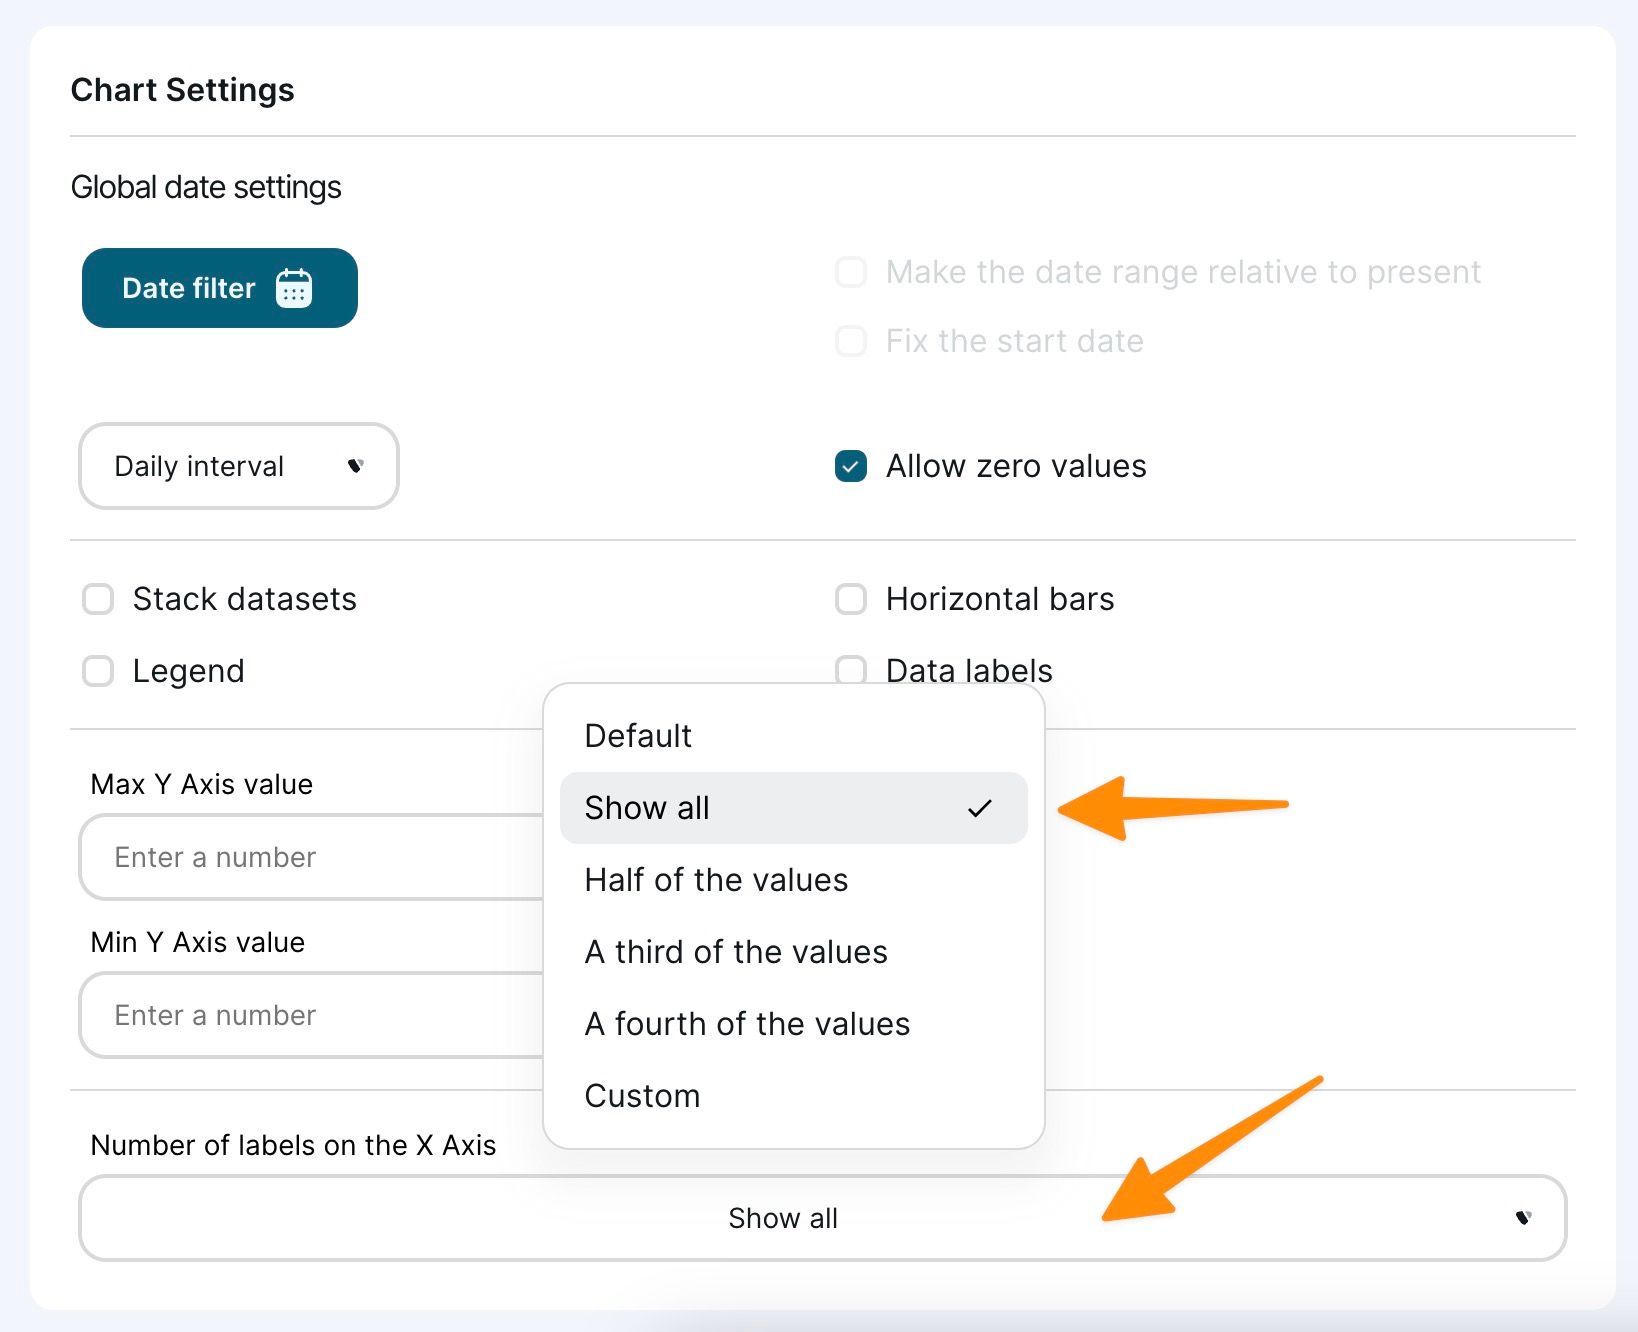
Next, we can display the chart as a Bar Chart, and down in the settings area we can tell Chartbrew to display all the labels so we can see all restaurant names.
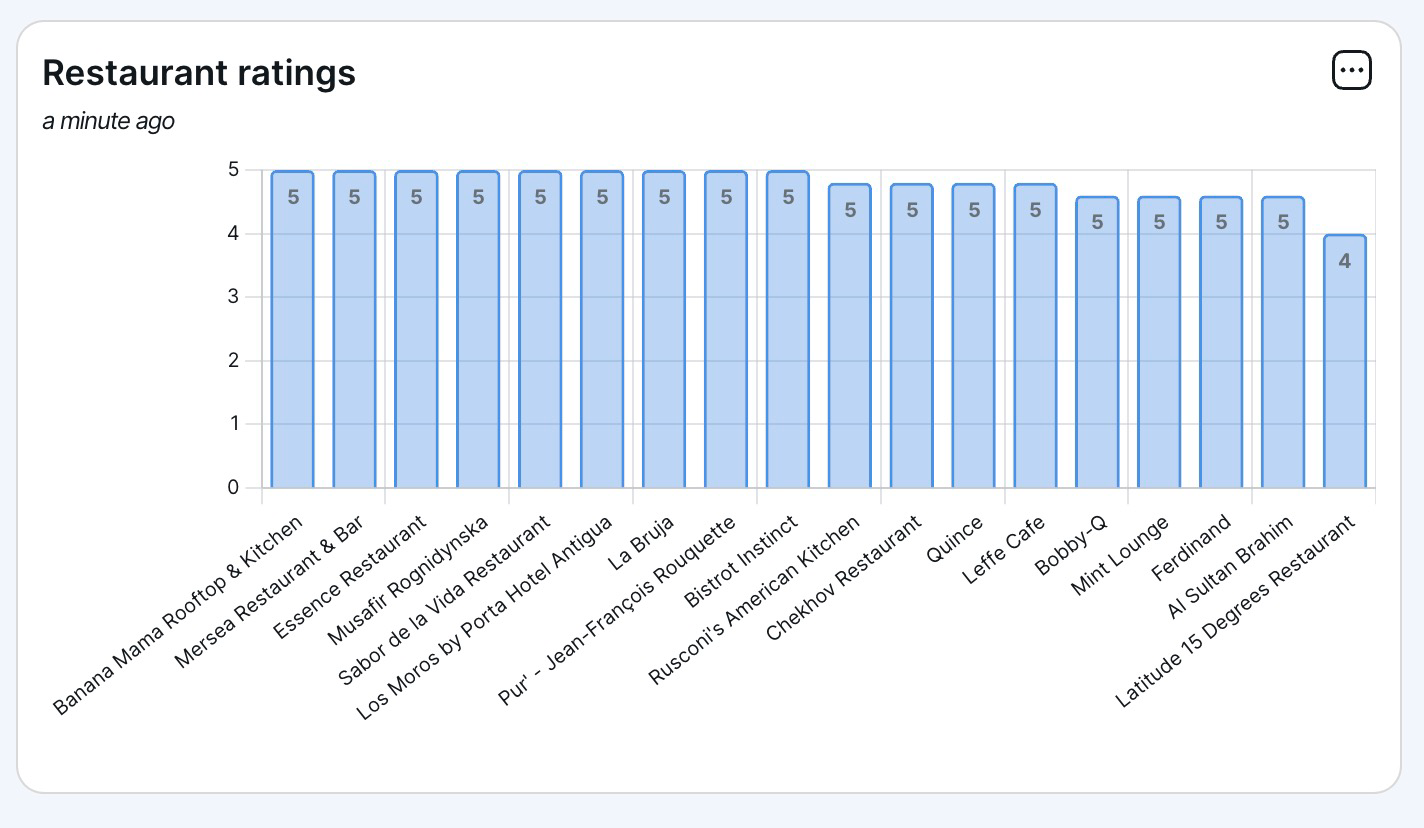
The final chart should display the restaurants in order of their average review score.
Show user count KPI
Chartbrew supports multiple chart views. On top of showing a graphical chart, the platform can show raw numbers or even calculate growth based on the dataset.
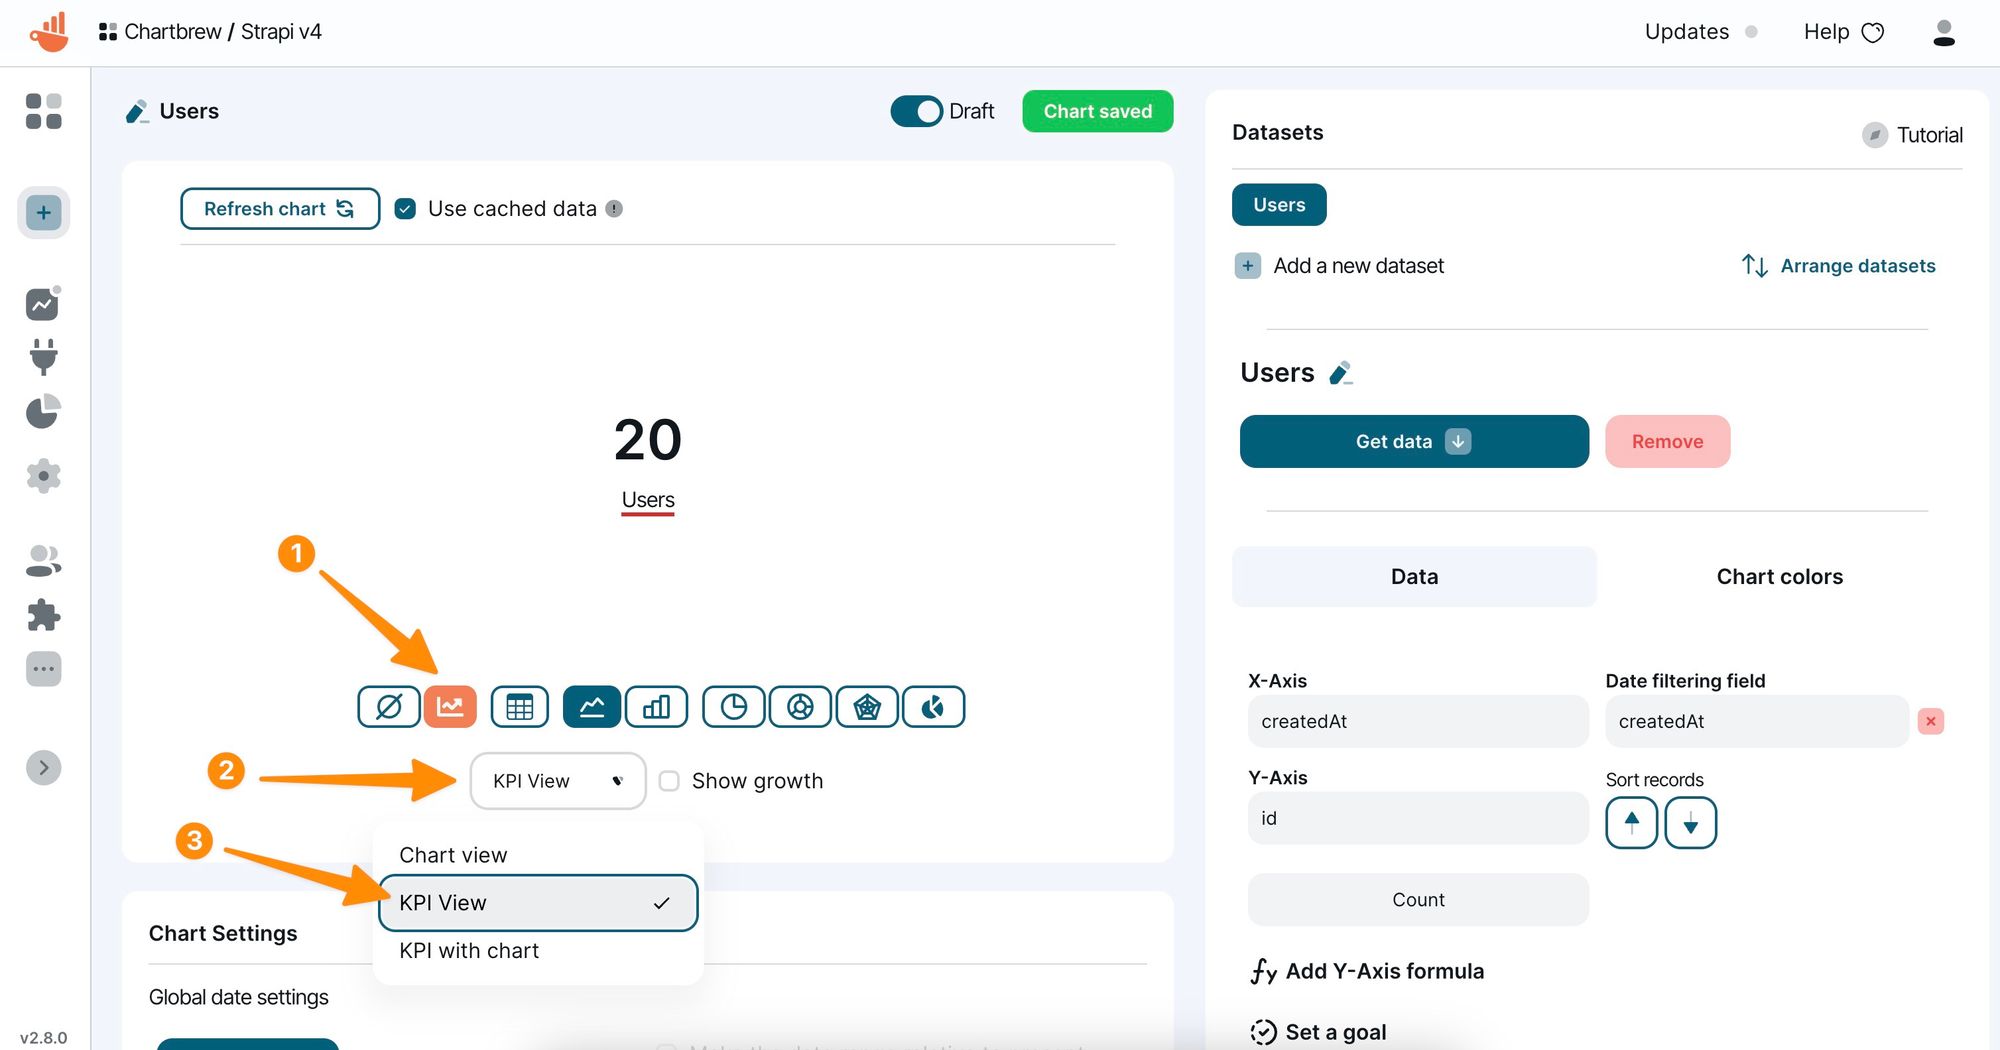
Creating a KPI view is the same as creating a chart. So let's go ahead and create a new empty chart like we did the previous times. When configuring the API request, we will fill the route with users instead of restaurants.
The only thing we have to change next is the chart view. The X & Y axes should already be selected with the right values. Select the KPI view as shown below and we're good to go!
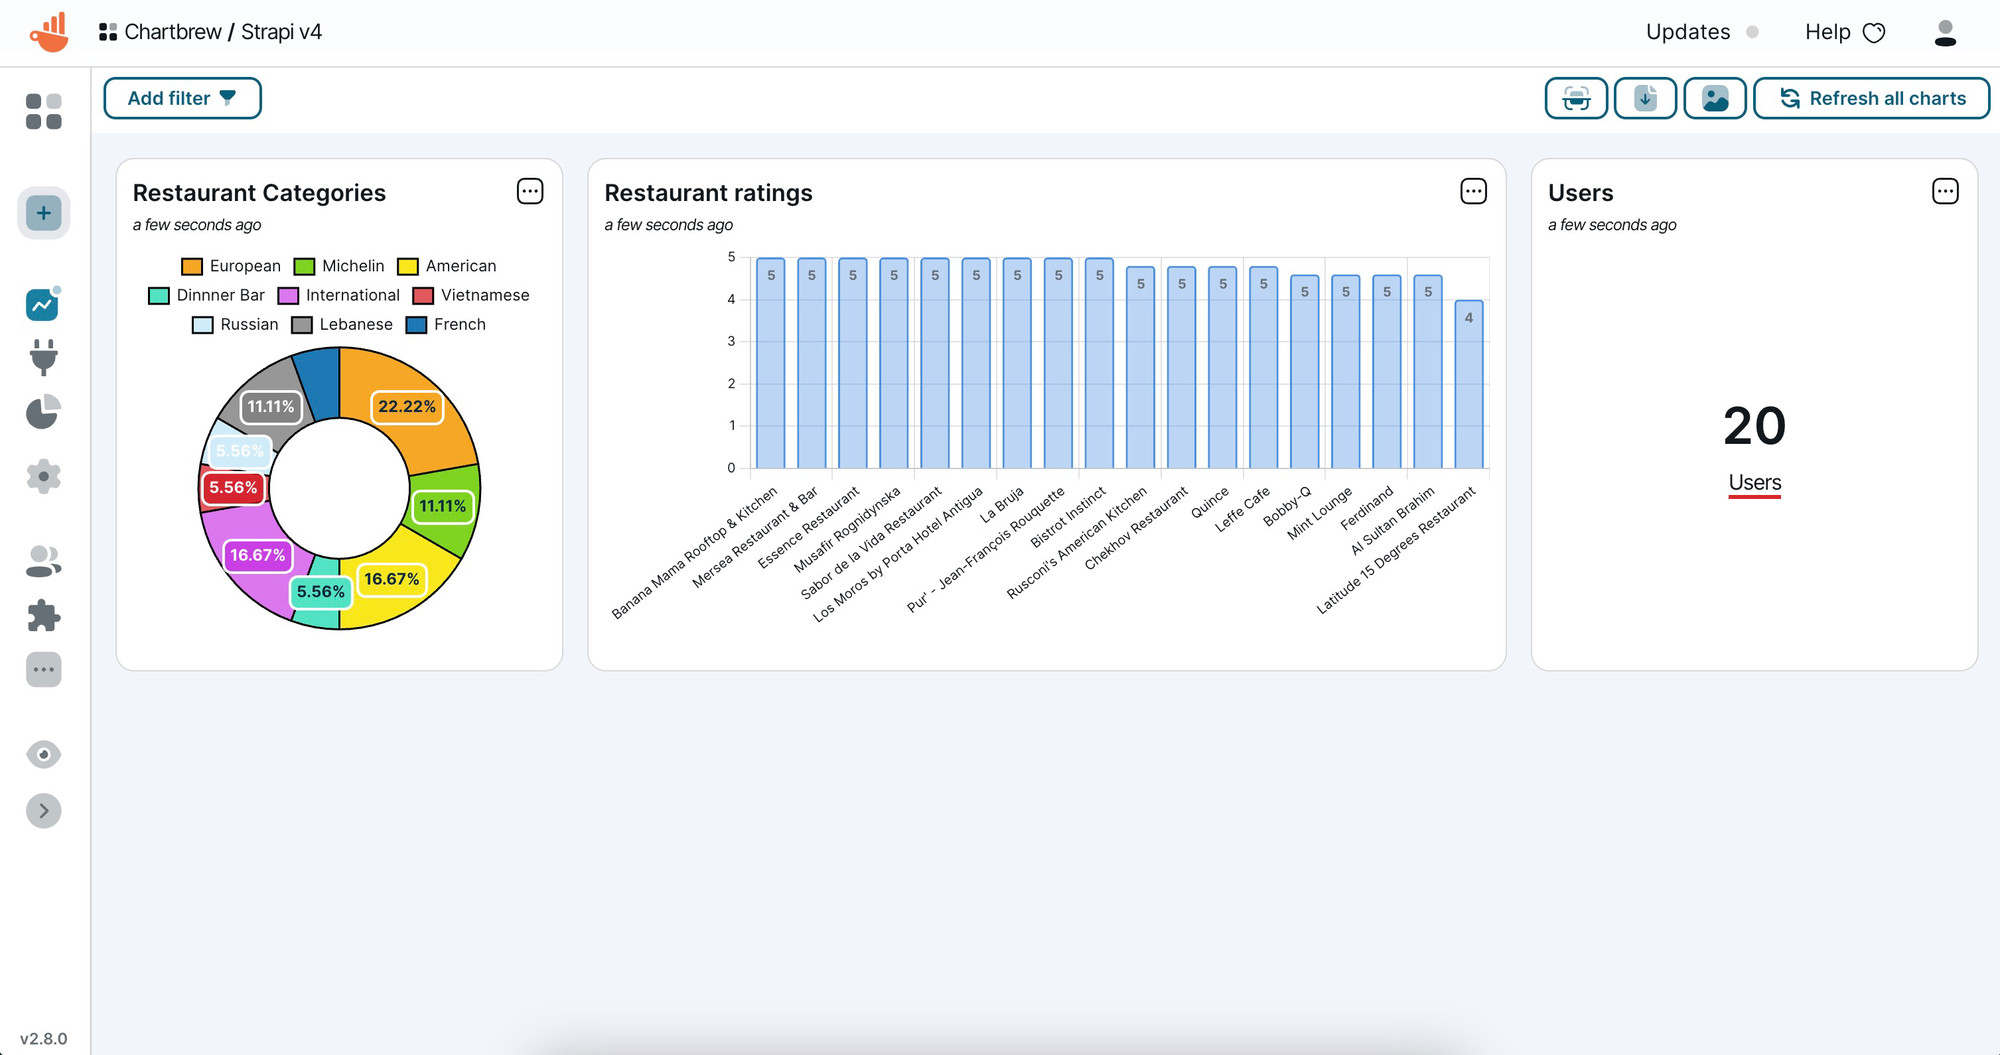
Now if we head back to the dashboard, we will have 3 charts that can be arrange the way we like.
Paginate Strapi API requests
A common thing we might want to do is to request more data than is allowed in a single Strapi API request. Chartbrew has pagination support out of the box and can automatically paginate the requests to get as much data as it's indicated. The pagination can be configured from the API request page.
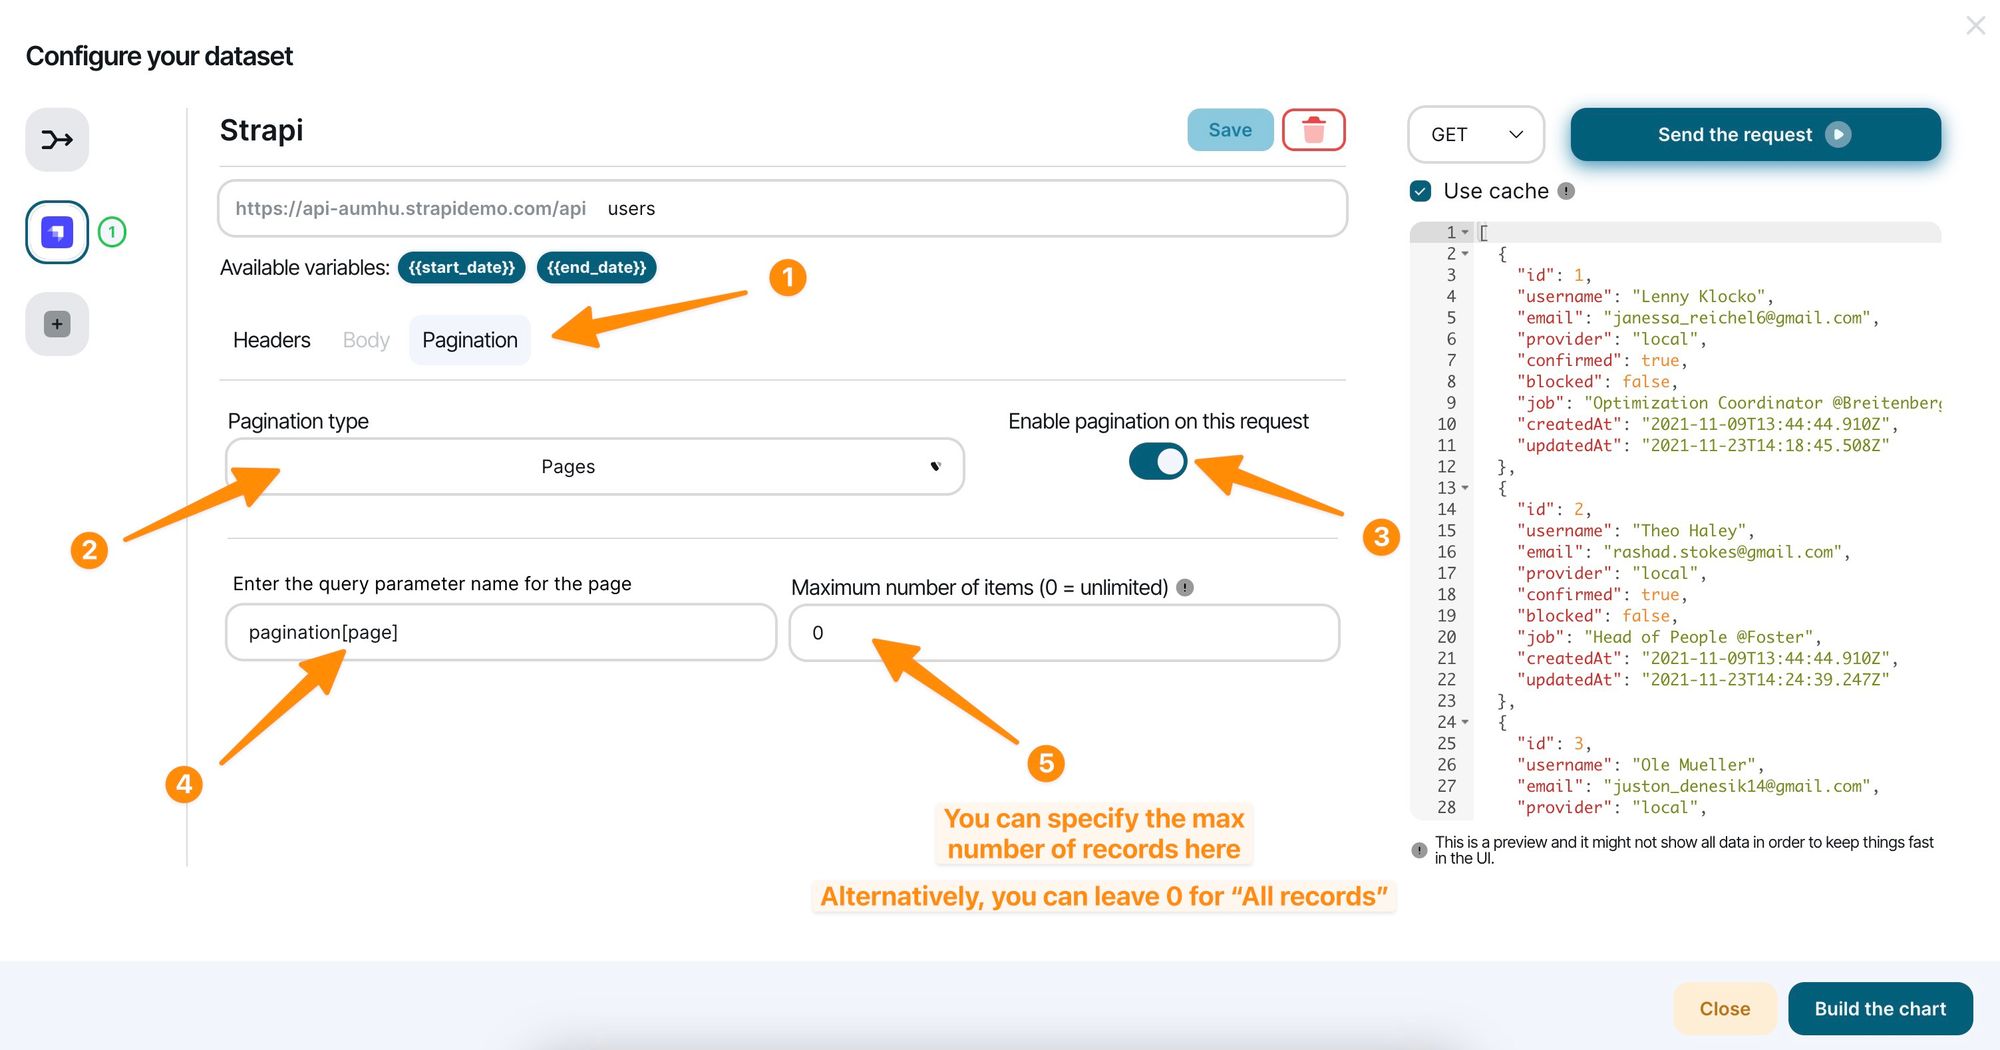
To enable the pagination, the template must be changed to Pages and the query parameter needs to be set to pagination[page]. Adjust the maximum number of records and it's all good to go!
Keeping the charts up-to-date & Sharing
One main use-case of Chartbrew is to always have up-to-date charts. Chartbrew can automatically update the charts with the latest data from Strapi. To configure and auto-update the schedule, head over to your dashboard and open the menu in the corner of a chart to get access to the auto-update feature.
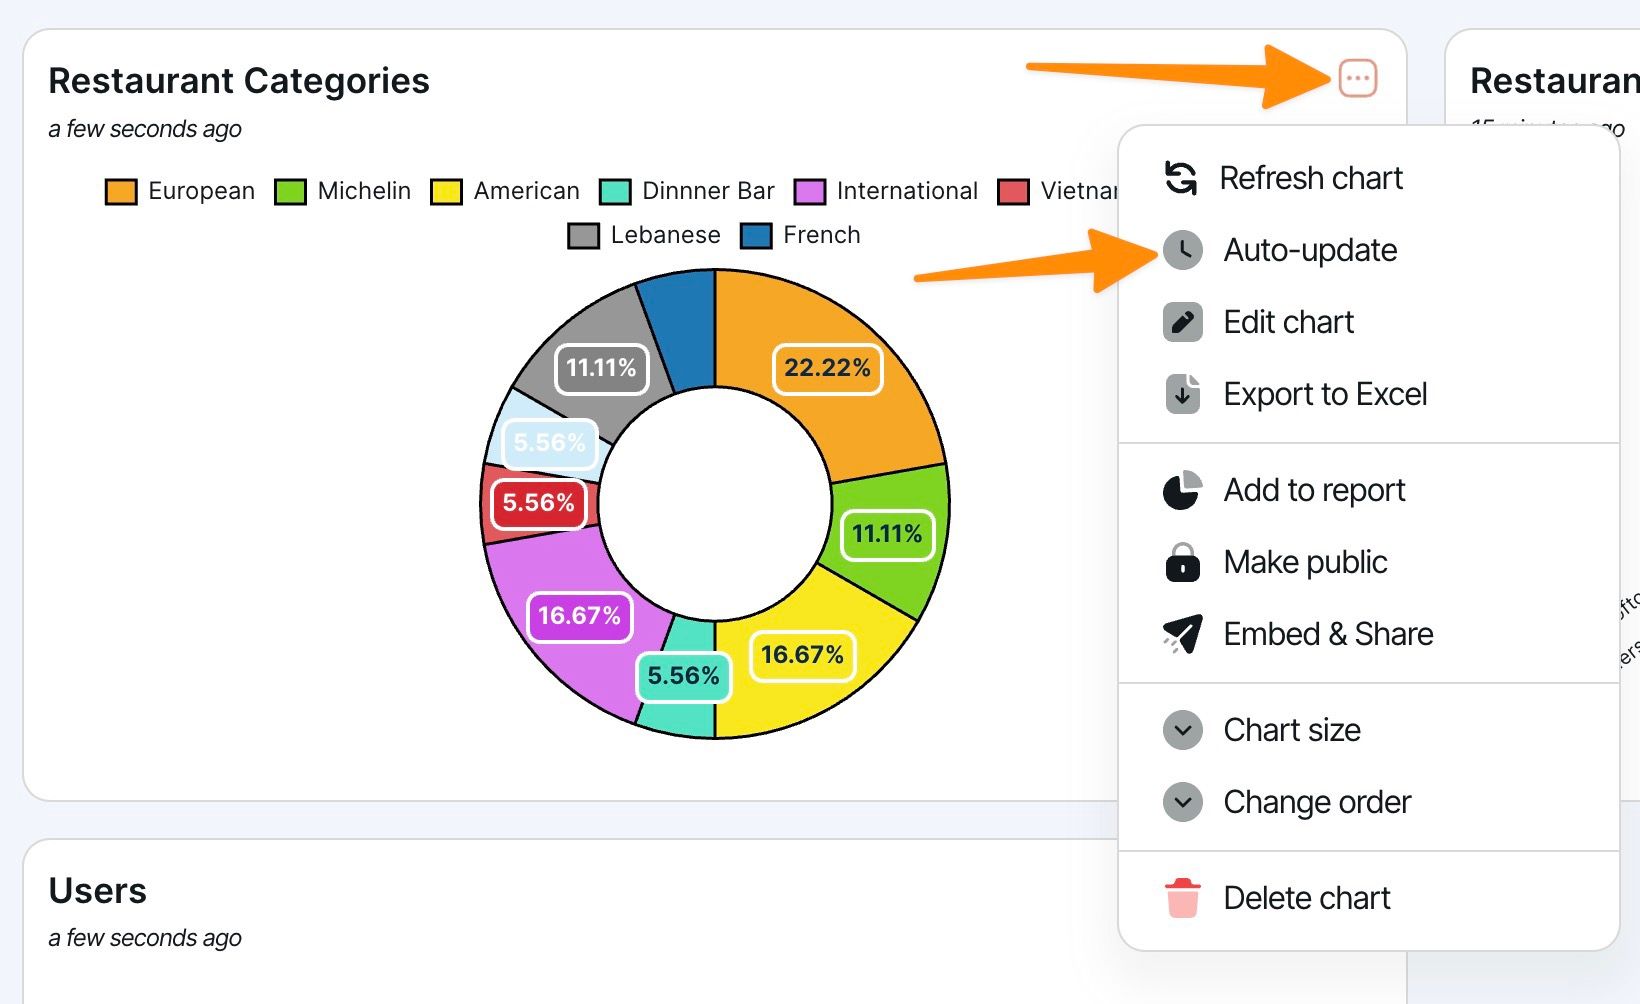
A dialogue will appear as you press the menu option. Select how often you'd like your chart to update and then Chartbrew will keep the chart up-to-date.
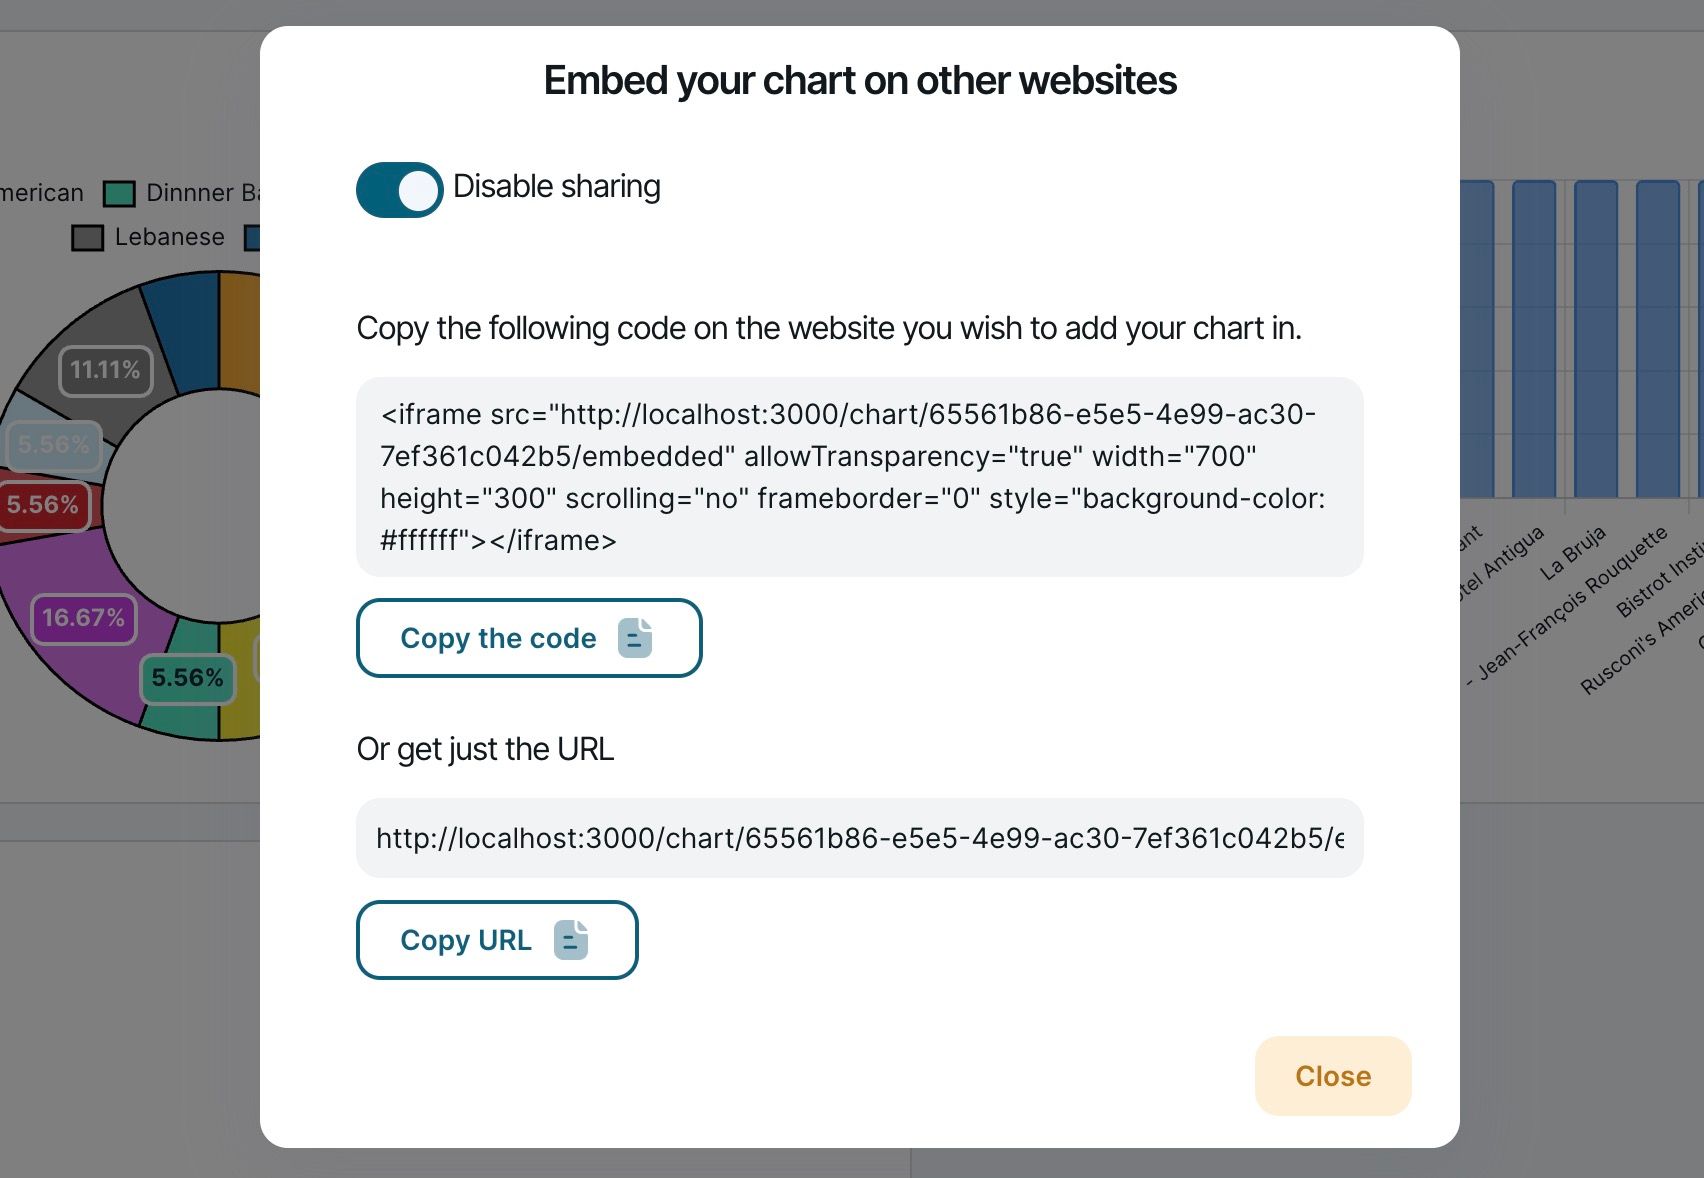
The charts can be shared by using a direct link or by embedding them on your own sites. From the same chart menu, select the Embed option and enable sharing in the dialogue.
Next steps
There are many more things you can do with Chartbrew. A quick list that will get you up and running would be:
- Create client reports from your dashboards and share them with stakeholders.
- If you are an agency and work with multiple Strapi projects, you can create templates from your dashboards and easily replicate charts across client projects.
- Add more connections to your dashboard and get data from other services you use alongside Strapi. Check here for a full list of tutorials.
Chartbrew can be used for free for 14 days. Head over to the signup page and start your trial now ✌️
