How to visualize Strapi data with Chartbrew
 Razvan Ilin
Strapi is an amazing headless CMS that is loved in the open-source community. It is a NodeJS-based project and it integrates well with any front-end framework. So you got your amazing backend set up and you have a lot of data coming in. It is time to get more insights into the exact numbers and how your data is evolving.
In this tutorial, we are going to learn how to visualize the data that we store in the CMS. If you haven't yet used Strapi, you can follow along with the tutorial and clone the example project that we are going to use in this post. For the visualization, we are going to use Chartbrew, an open-source visualization platform to which we can connect the Strapi instance directly.
Prepare your Strapi project
This step is optional, and if you already have a Strapi project all good to go, then you can just scroll down to the next headline.
We are going to use the Food Advisor example project so that we have some seed data that we can visualize for this tutorial. The amazing people from Strapi already did a good job at explaining how to get this project up and running, so I'm just going to put the quick setup commands here:
git clone https://github.com/strapi/foodadvisor.git
cd foodadvisor/api/
yarn && yarn run seed && yarn develop
These commands are setting up the project, populating the database with some seed data, and starting the project. Note that we don't need to set up the front-end part as we are only going to need the back-end running.
Set up Chartbrew
You can set up Chartbrew on your machine using the documentation or by simply running:
npx create-chartbrew-app chartbrew
You will need MySQL or PostgreSQL running on your machine with an empty database that Chartbrew can use.
Alternatively, if your Strapi instance is already running on a remote server, you can create an account with Chartbrew right away as you can connect directly to your instance.
Create a new Strapi user for Chartbrew
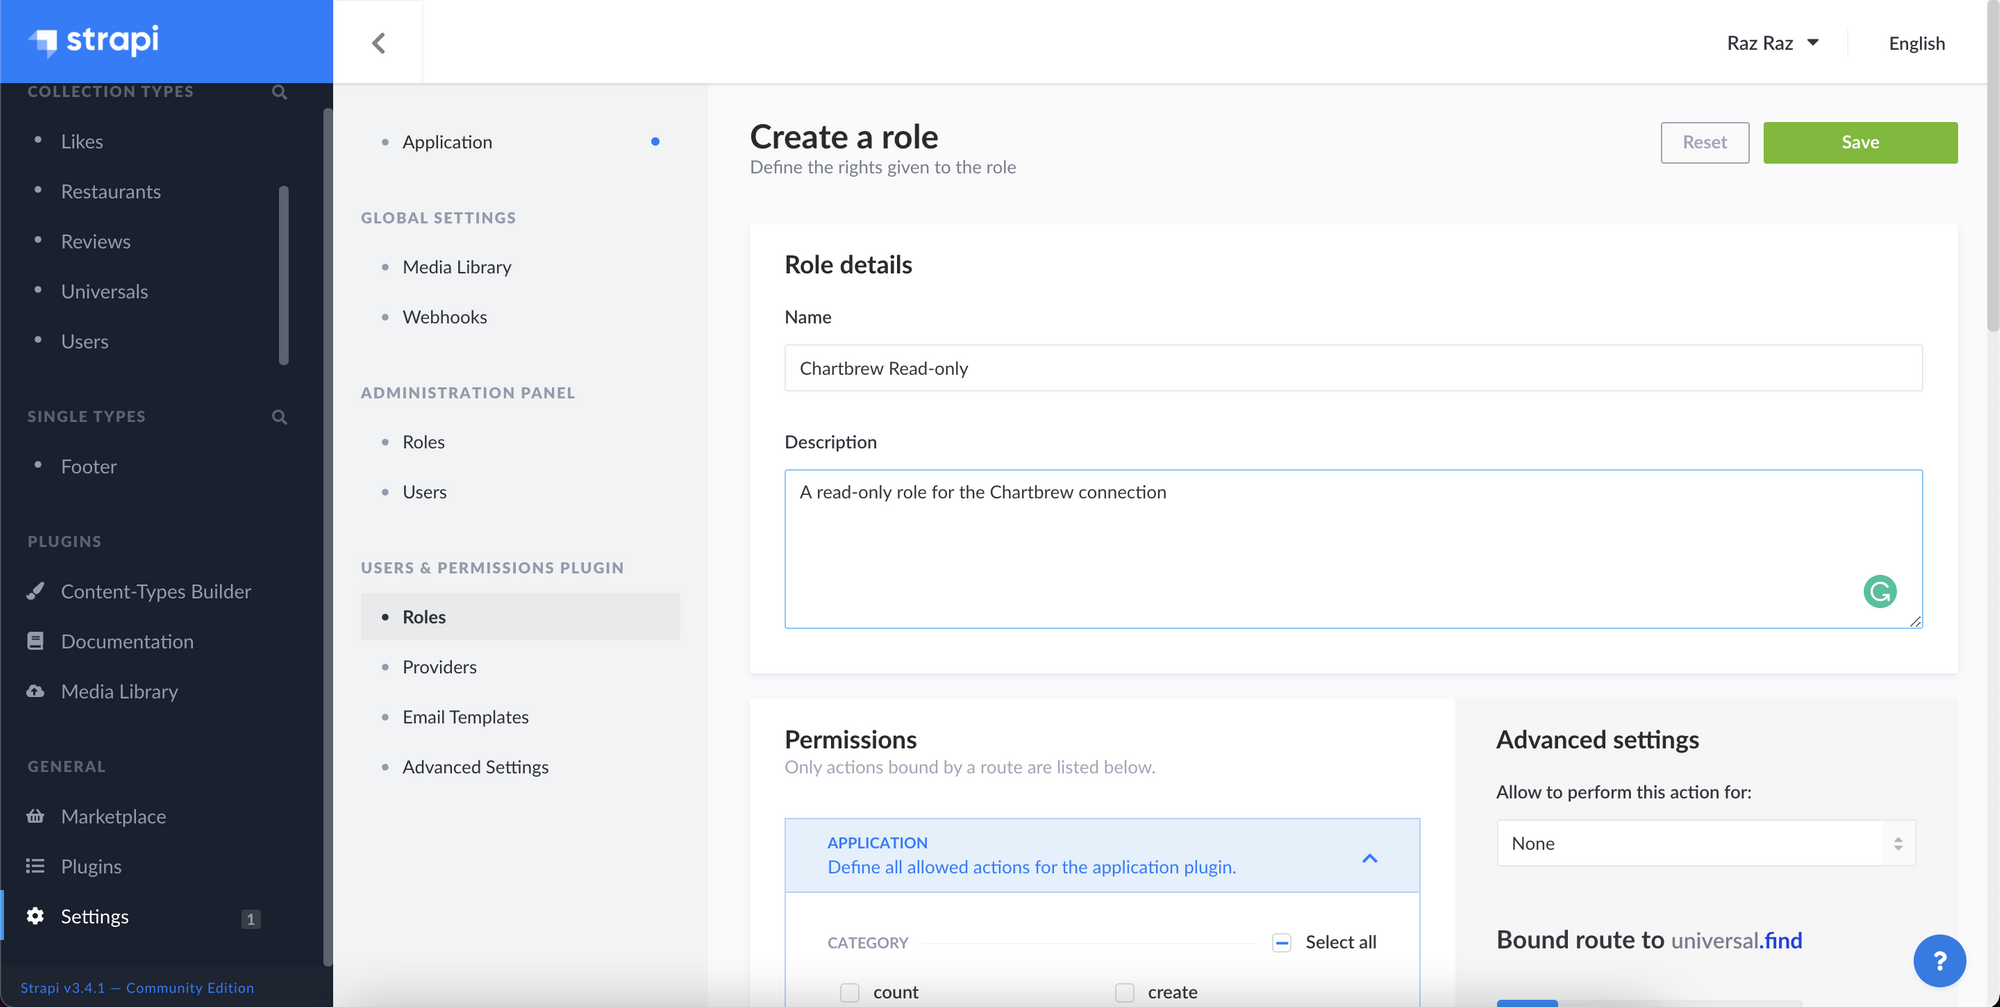
To connect to Strapi, we will need to authenticate the requests. Strapi uses JWT authentication so we will need an authentication token for that. Just to be on the safe side, we will need a key that only allows reading data. Fortunately, this can be configured easily in Strapi. Head over to Settings, click on Roles and create a new role that we will use for the connection.
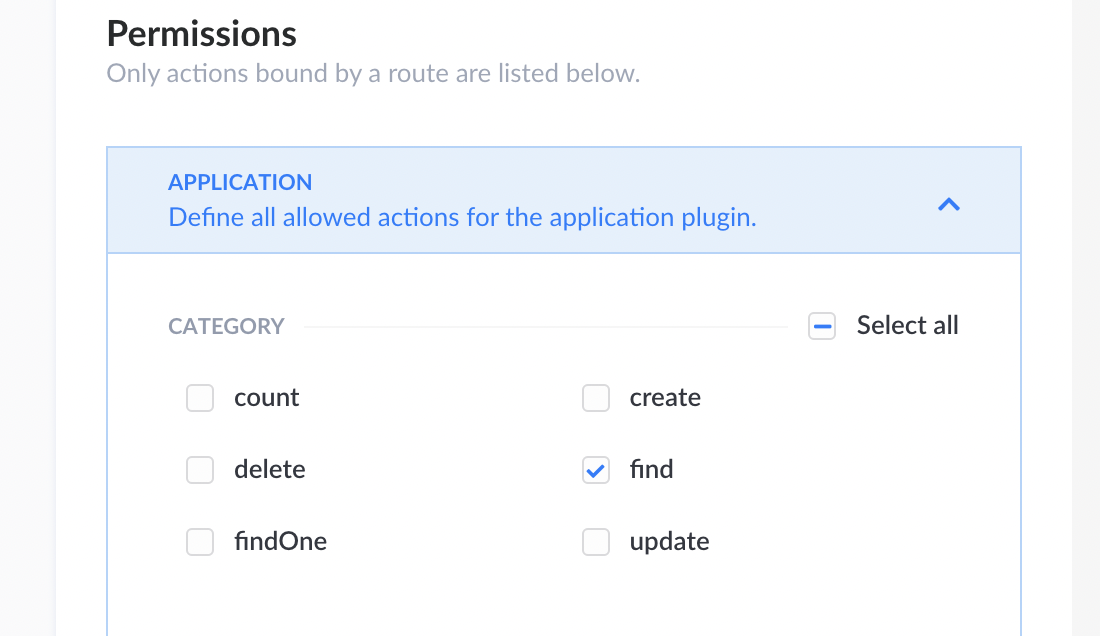
After naming the new role, scroll down and select the find role for all the content types. Tick find for all the content that you want to visualize.
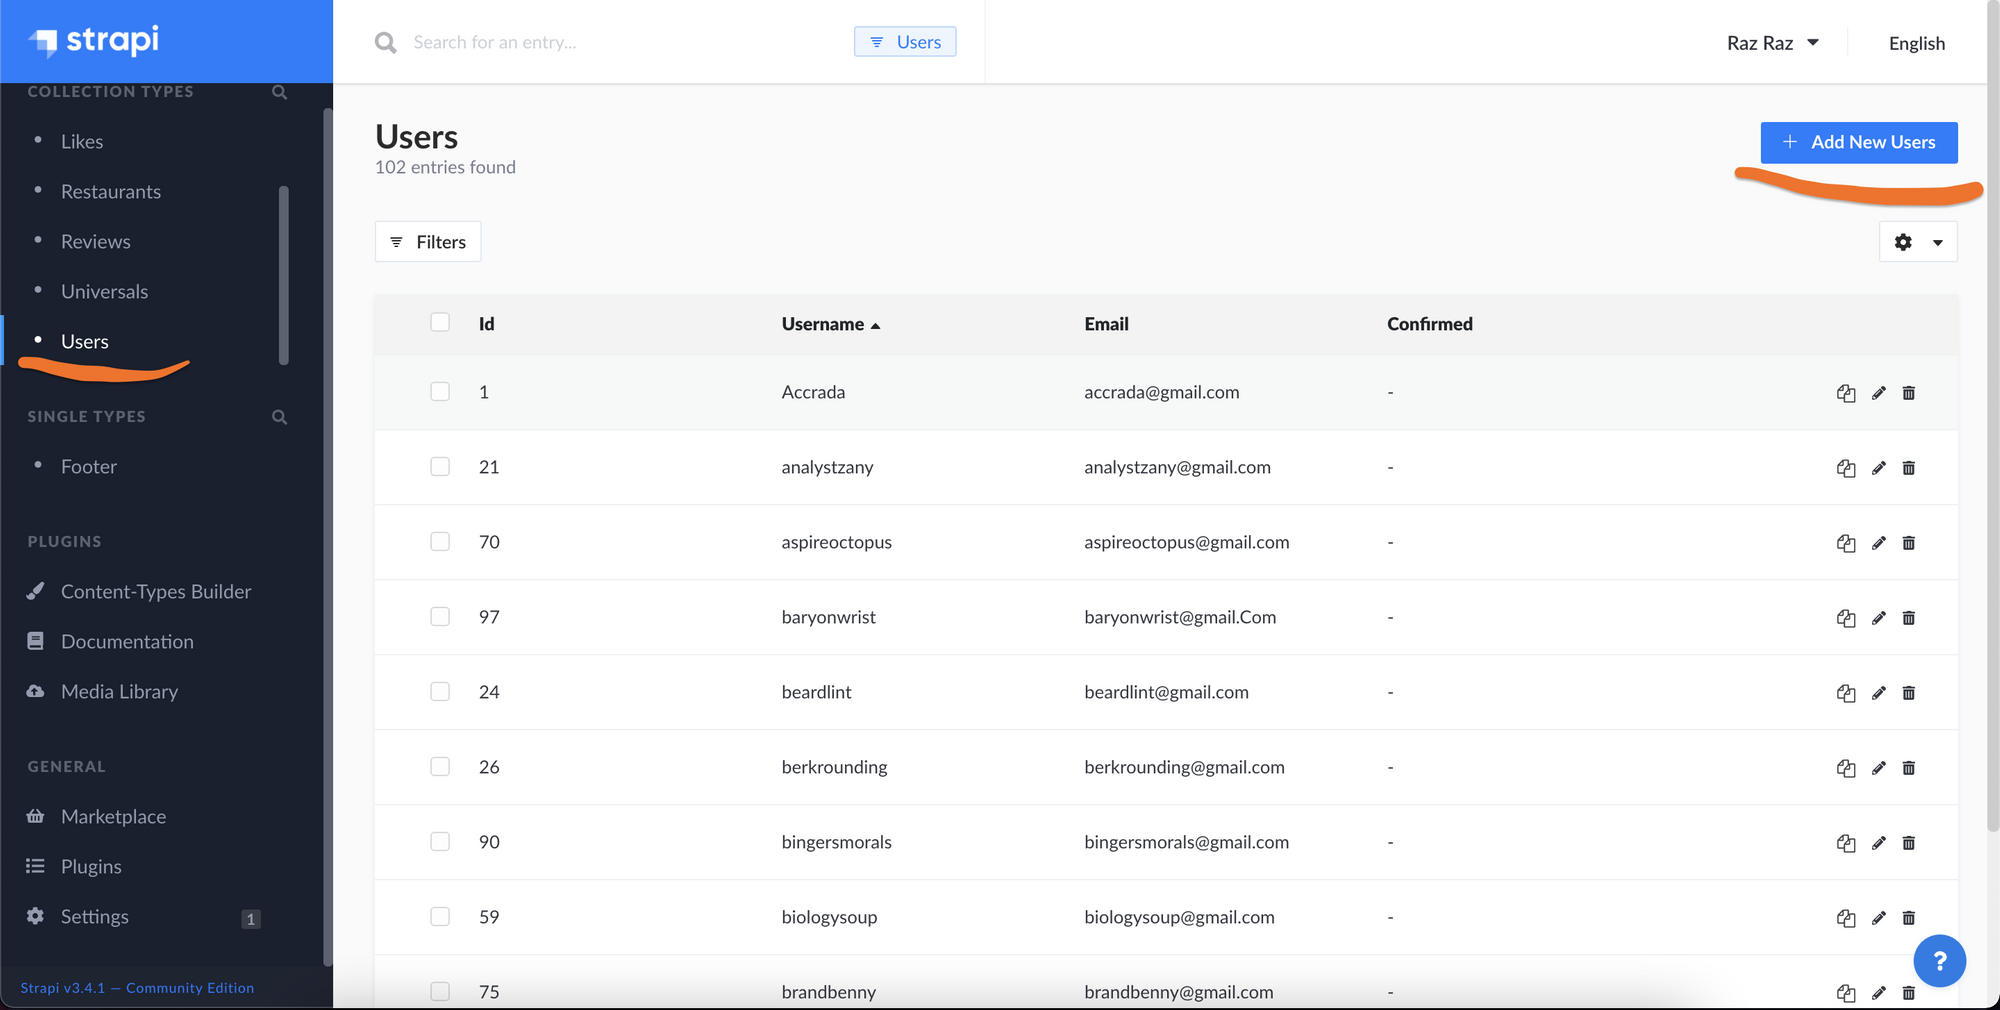
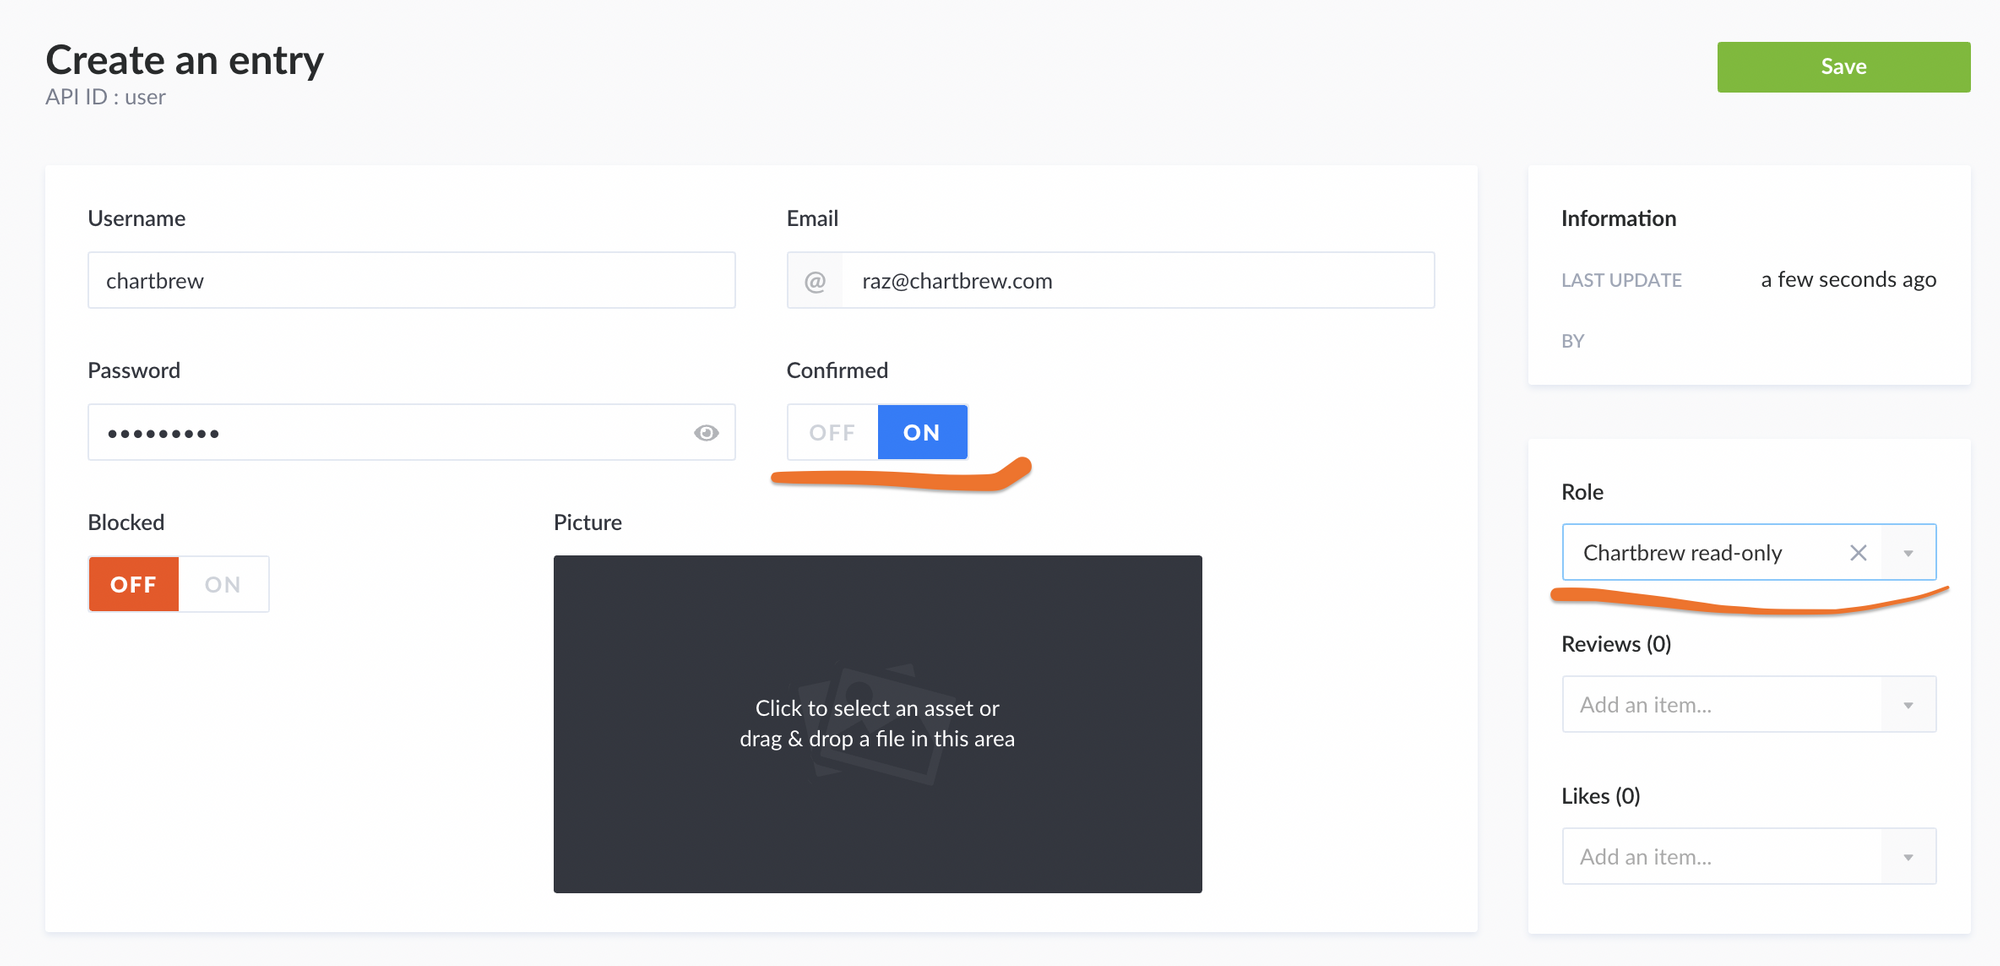
Next, we need to create the actual user that will have this role we just created. We can do this directly from Strapi's admin interface.
Get the authentication token
To get the authentication token, we need to log in with the user we just created and copy the token we receive when the request is successful. The login can be done using multiple tools like curl or Postman. With curl you can do something similar to this:
curl -d "identifier=chartbrew&password=something" -X POST http://localhost:1337/auth/local
chartbrew- usernamesomething- passwordlocalhost:1337- The host where Strapi is running from
This request should give you a JSON response from where you have to copy the value of the jwt key. In the example below, this is the long string starting with eyJh...
{"jwt":"eyJhbGciOiJIUzI1NiIsInR5cCI6IkpXVCJ9.eyJpZCI6MTAyLCJpYXQiOjE2MTIyNDg5MjcsImV4cCI6MTYxNDg0MDkyN30.l1oLtm4flI35_7RbxUczft8hXQ0IRanXs8pLPlL4gMg","user":{"id":102,"username":"chartbrew","email":"[email protected]","provider":"local","confirmed":true,"blocked":false,"role":{"id":1,"name":"Administrator","description":"These users have all access in the project.","type":"root"},"created_at":"2021-01-30T09:11:51.619Z","updated_at":"2021-01-30T09:11:51.627Z","picture":null,"reviews":[],"likes":[{"id":12,"author":102,"review":116,"created_at":"2019-03-12T16:59:34.380Z","updated_at":"2019-03-25T14:37:56.545Z"}]}}
Connect Strapi to Chartbrew
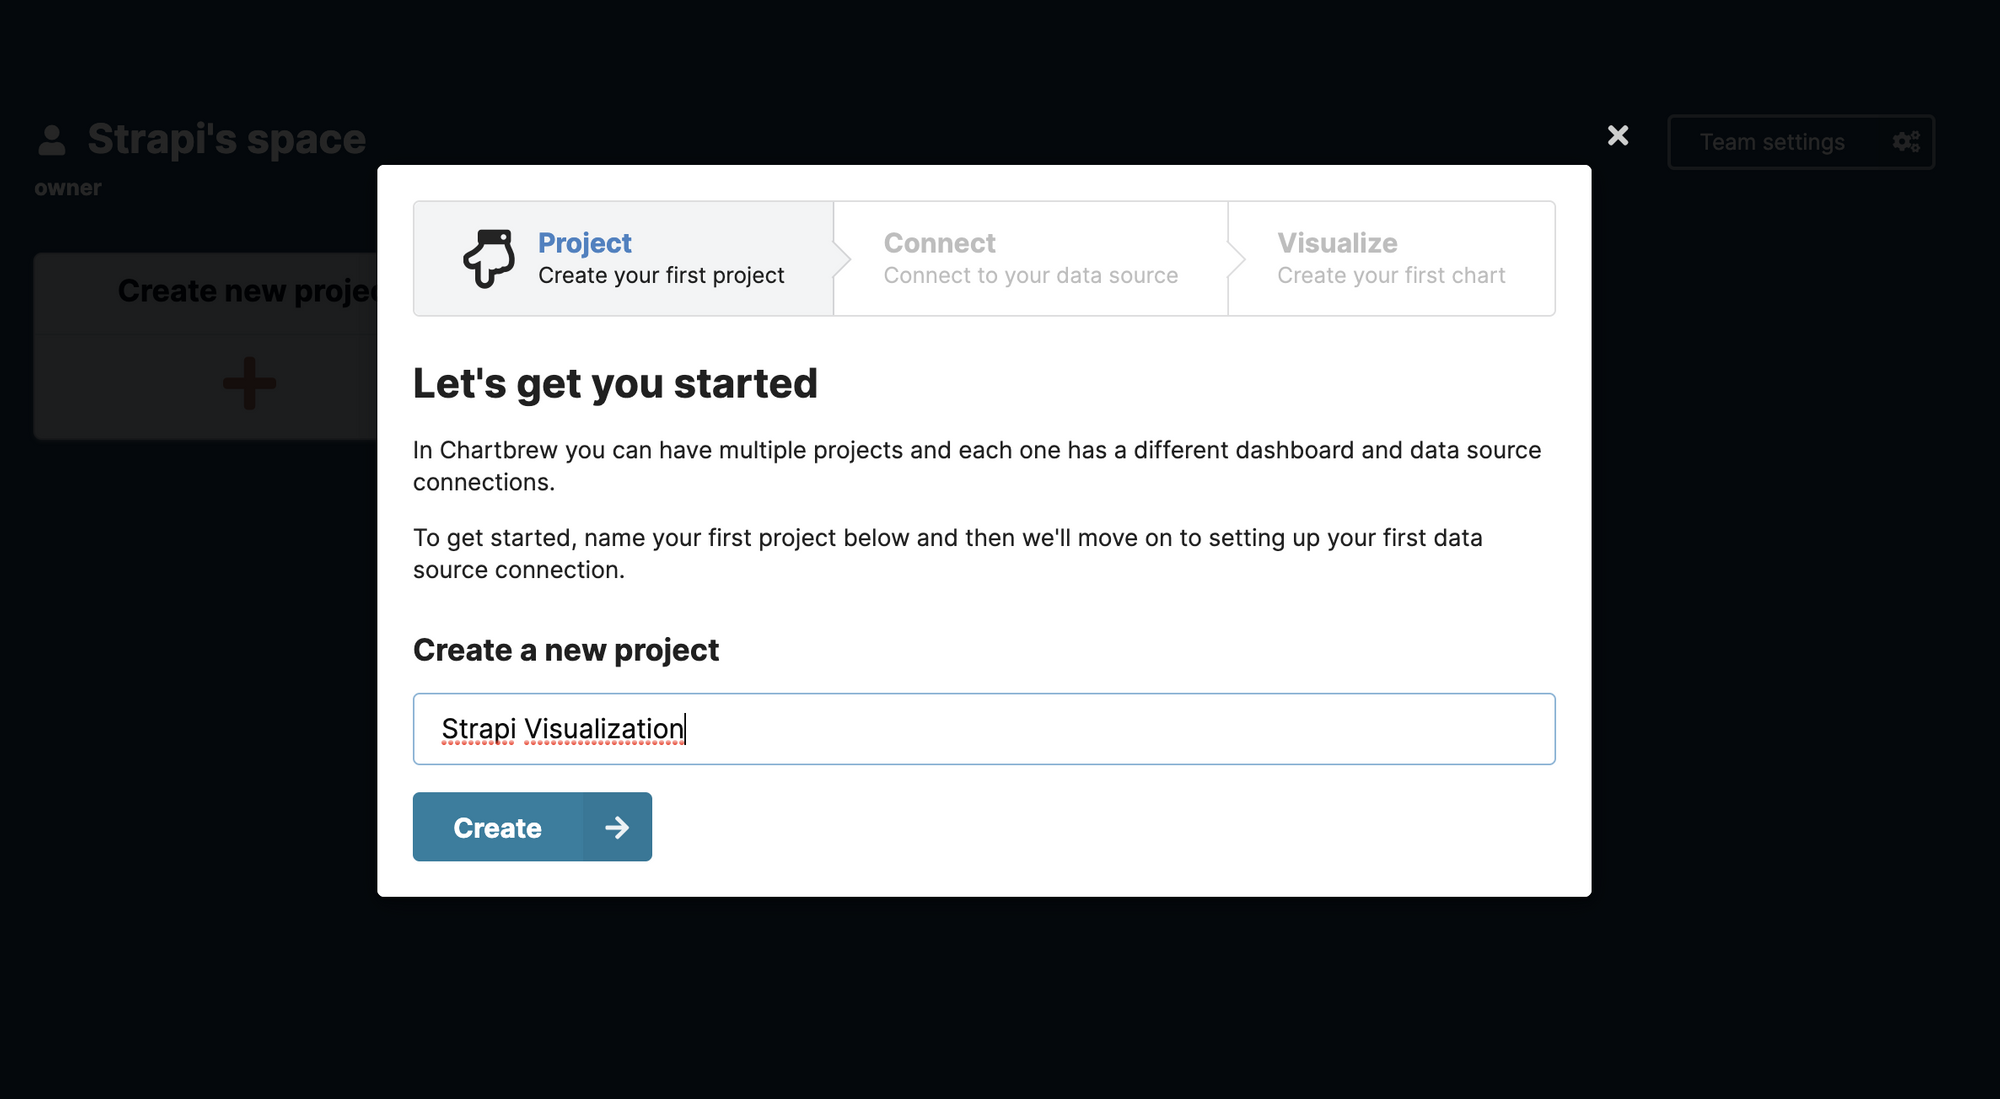
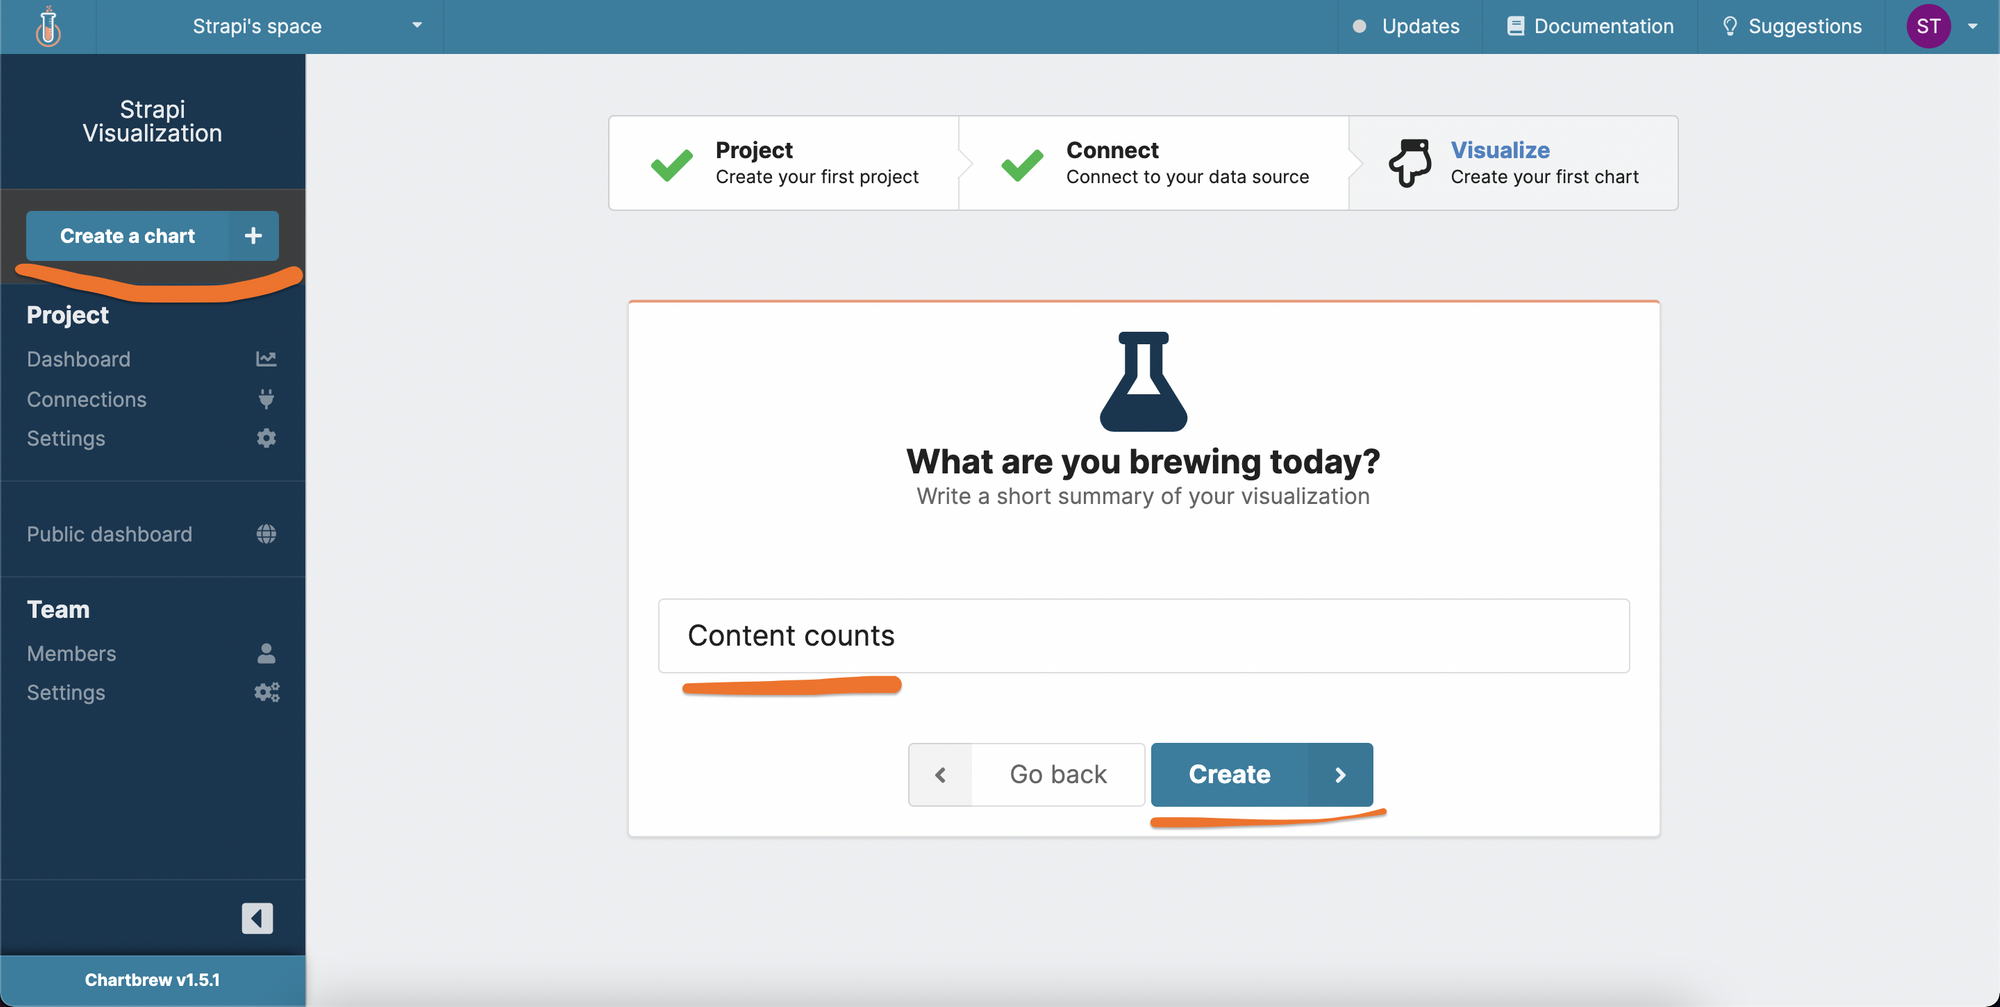
Chartbrew and Strapi are now both running, so it's time to create a new project in Chartbrew where we are going to visualize our data. After you create a new Chartbrew account, you will be prompted to create your new project:
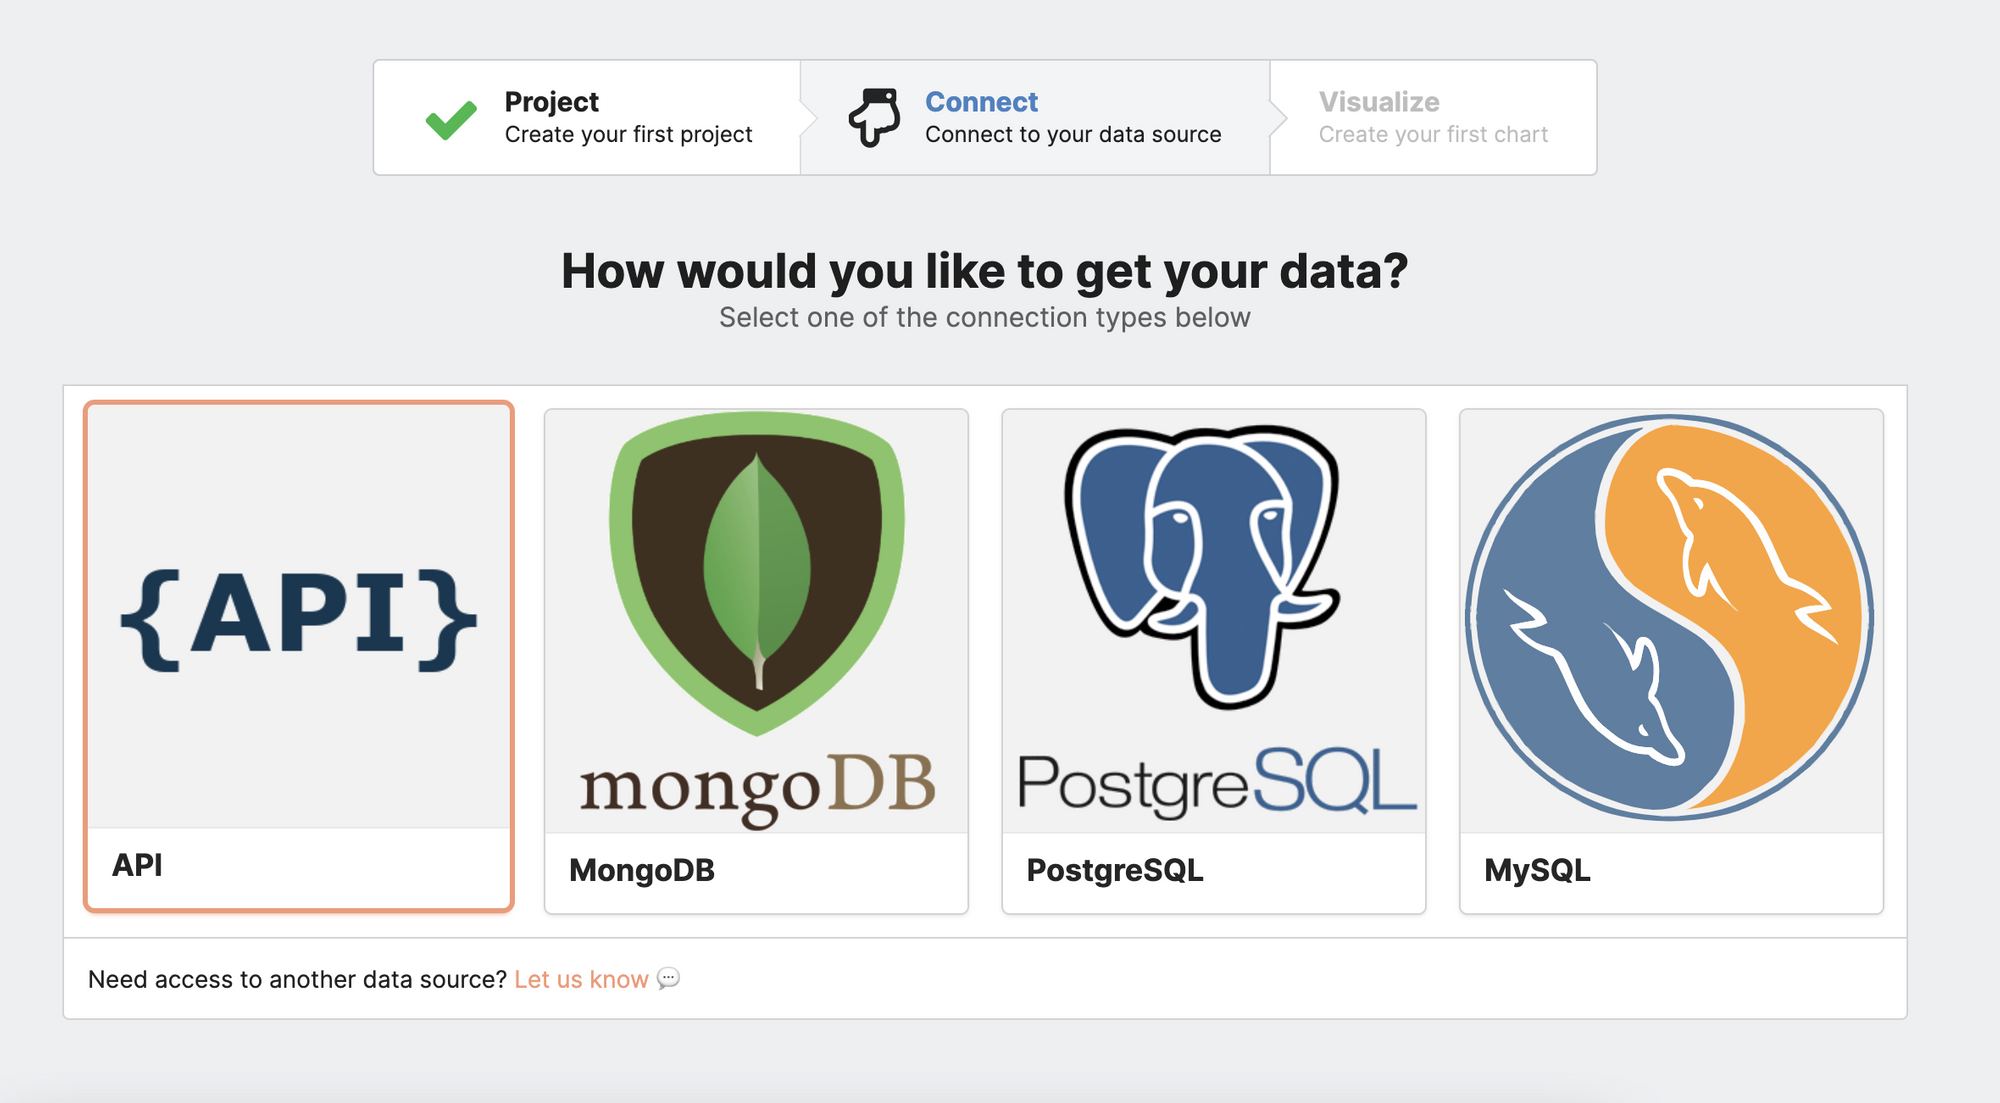
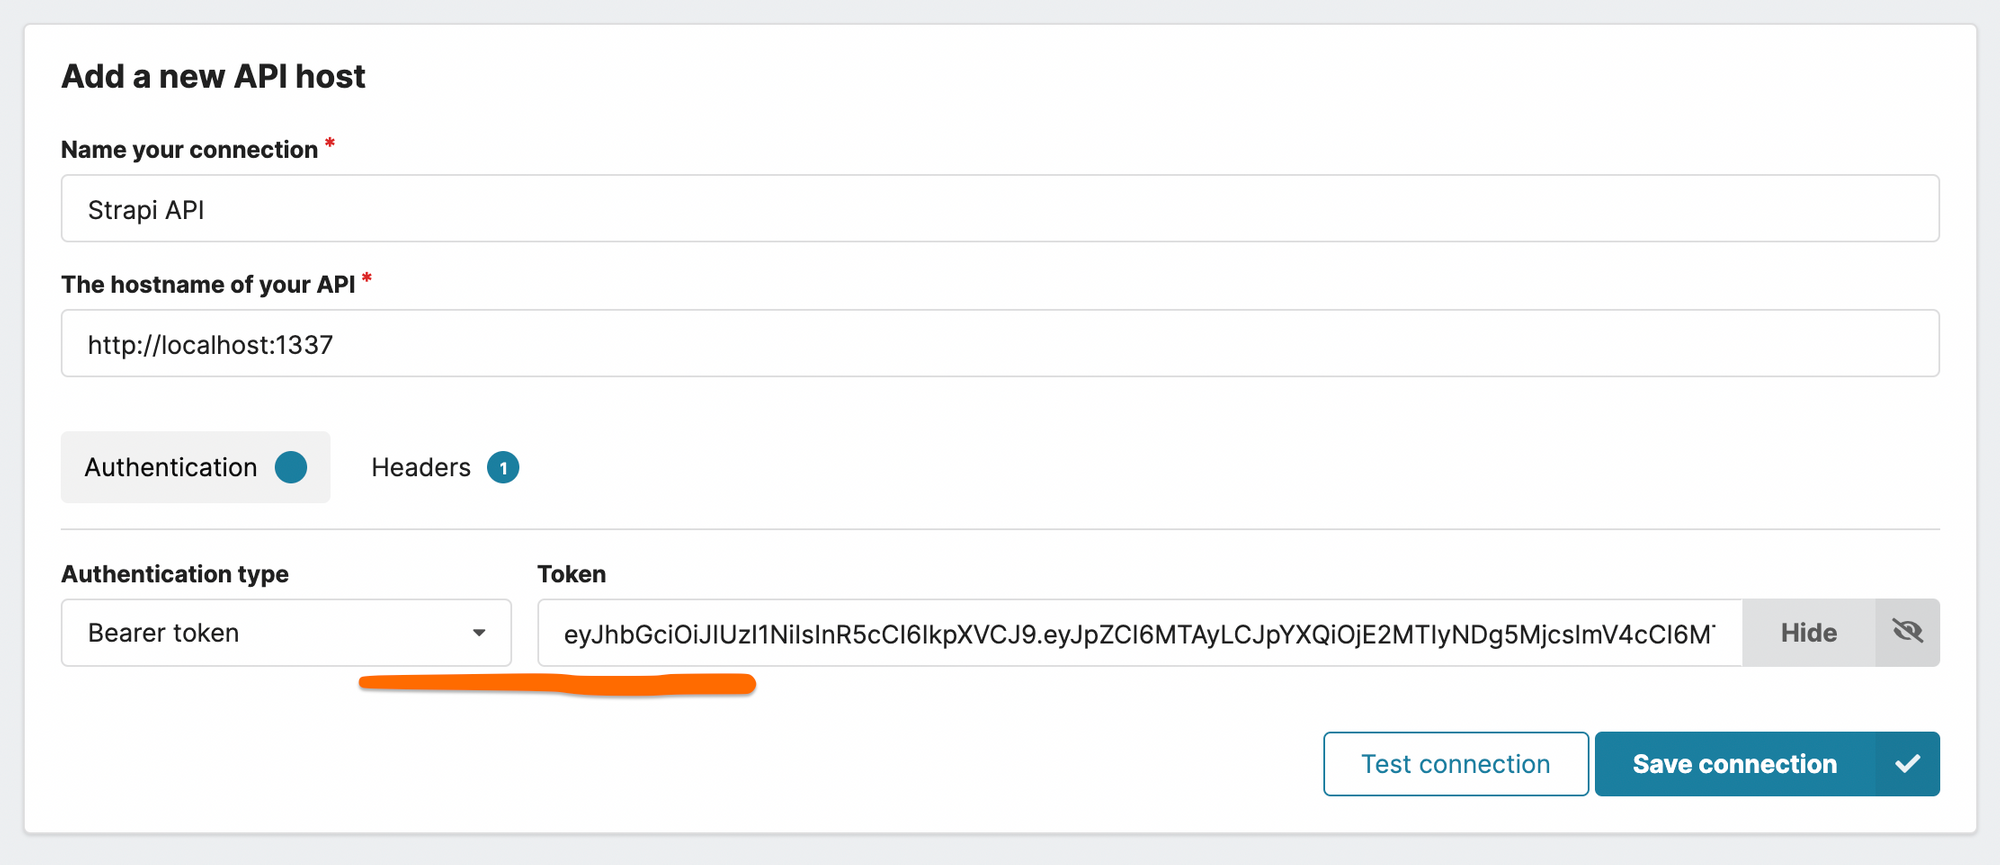
We are going to need the authentication token we got above to make sure that our connection can fetch data later when we fetch the data for visualization. Copy the token in the authentication section like in the screenshot below:
If you press Test Connection you should get a 200 OK code and some HTML in the result panel. If the code is not 200, it means that Chartbrew can't reach your Strapi host. Please keep in mind that if you use Chatbrew from chartbrew.com, it can't connect to your machine's localhost and you need to set up Chartbrew on your machine as well.
Creating the first chart from Strapi data
In this tutorial, we are going to create a KPI chart that will show the number of categories, restaurants, and users we have in the database. If you use your Strapi instance with your data, you can replicate the same chart with your content. So let's create a new Chart in Chartbrew following the instructions below:
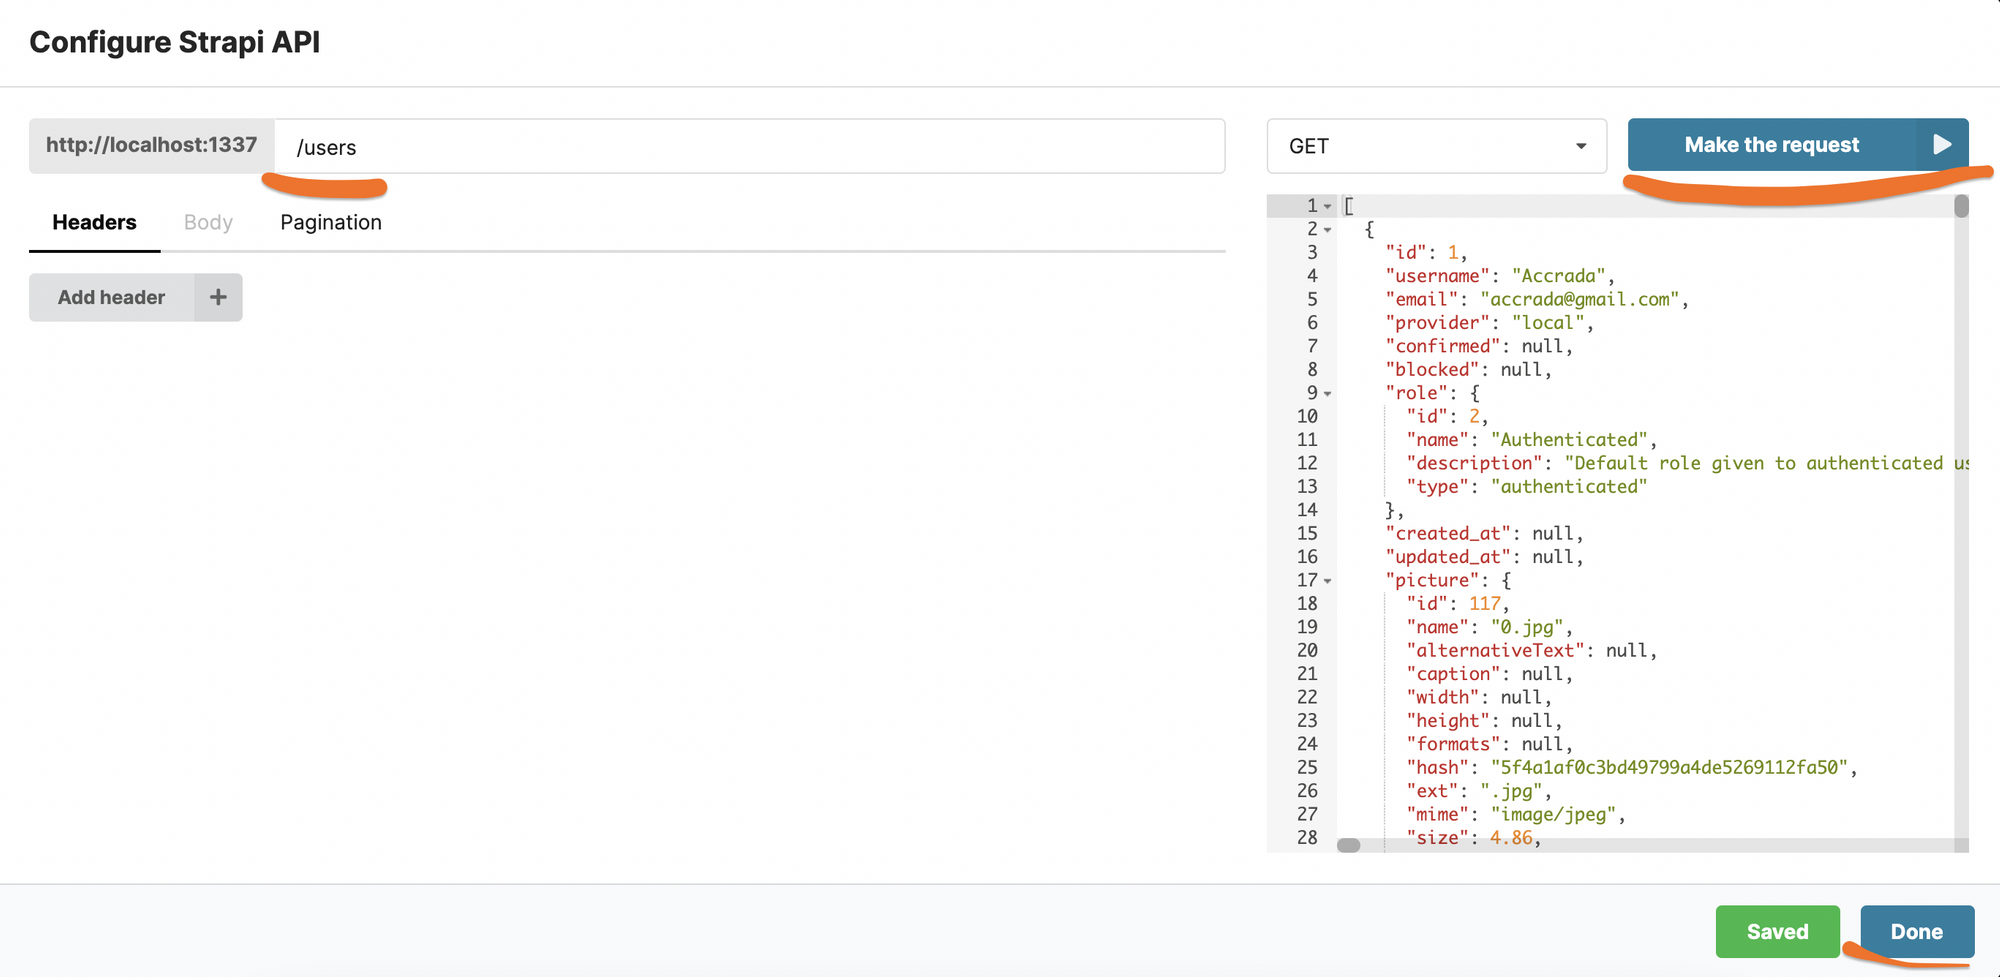
In the example above, we query the /users endpoint to get all the users that are created. When your request is successful you will see your data coming like in the screenshot. Press Done and let's move on to the next steps:
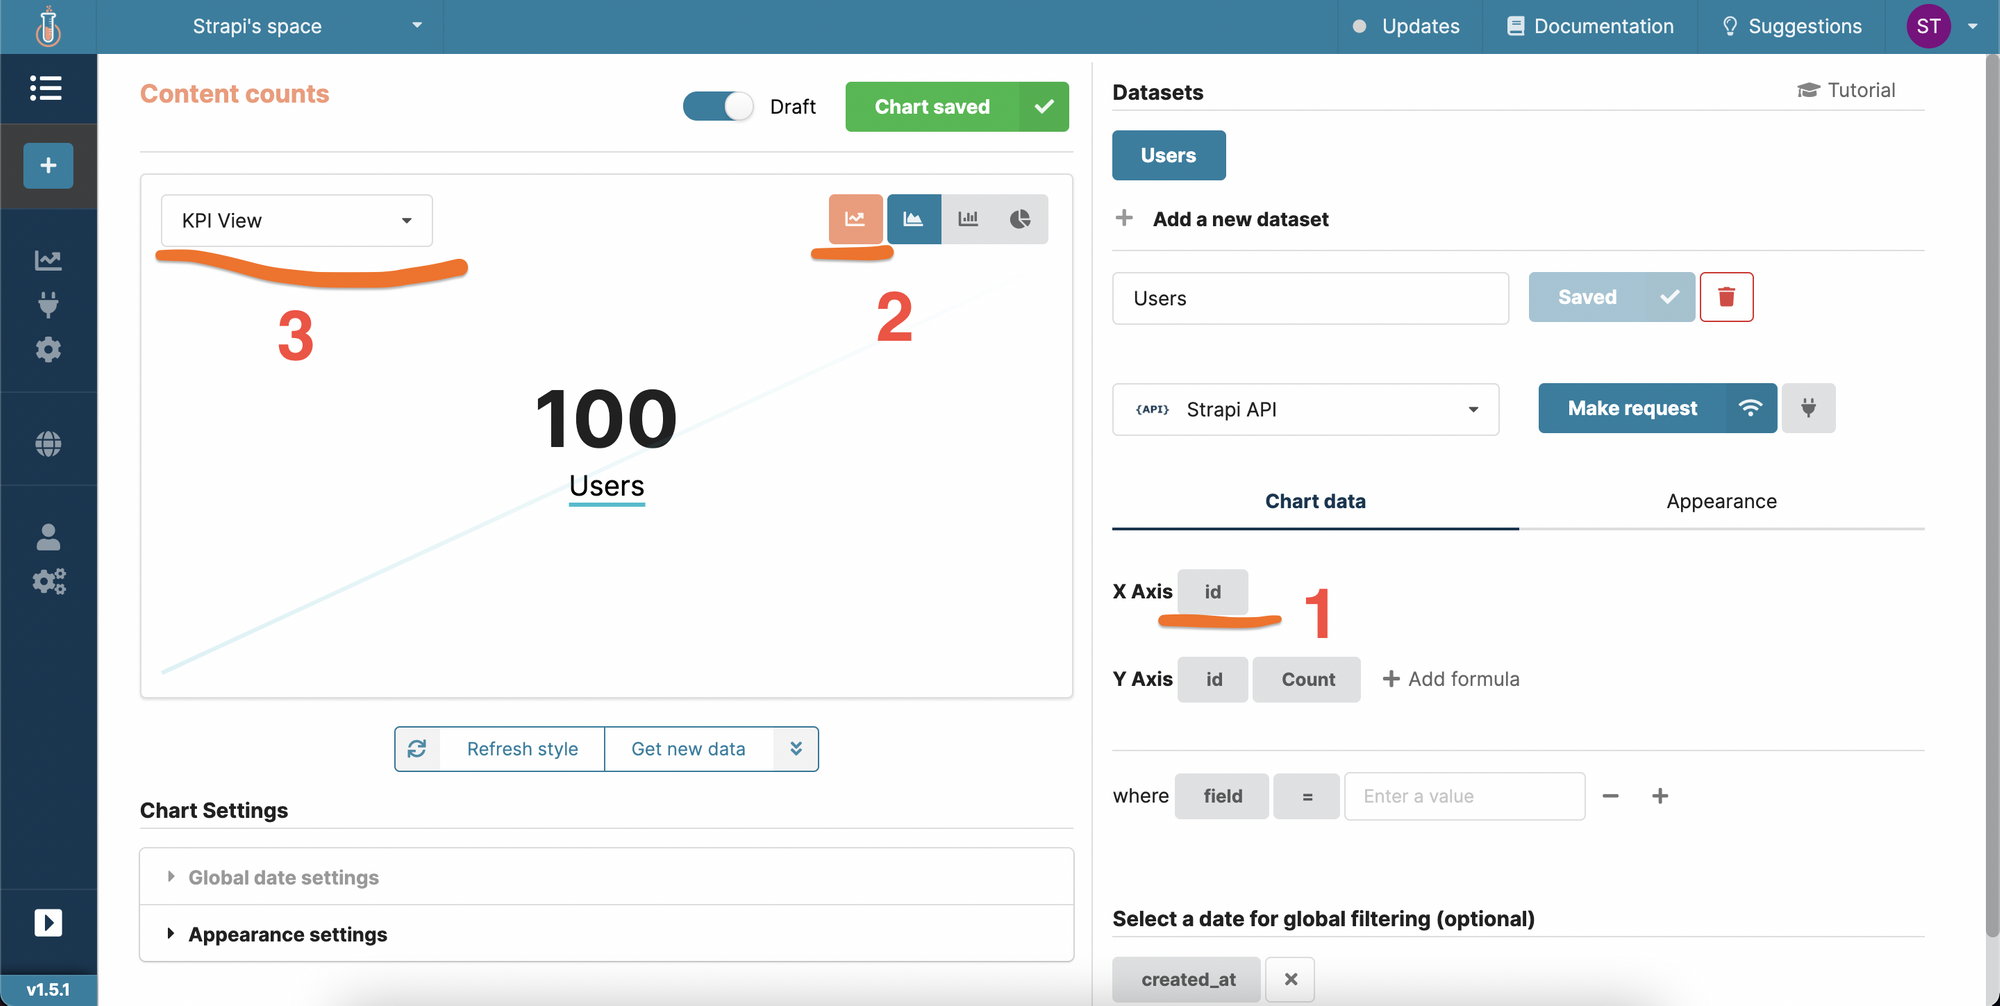
- Change the X-Axis to id to make sure we have unique results on the axis
- Switch the accumulation to add up all the values
- Switch to the KPI view to get a clear number on our chart
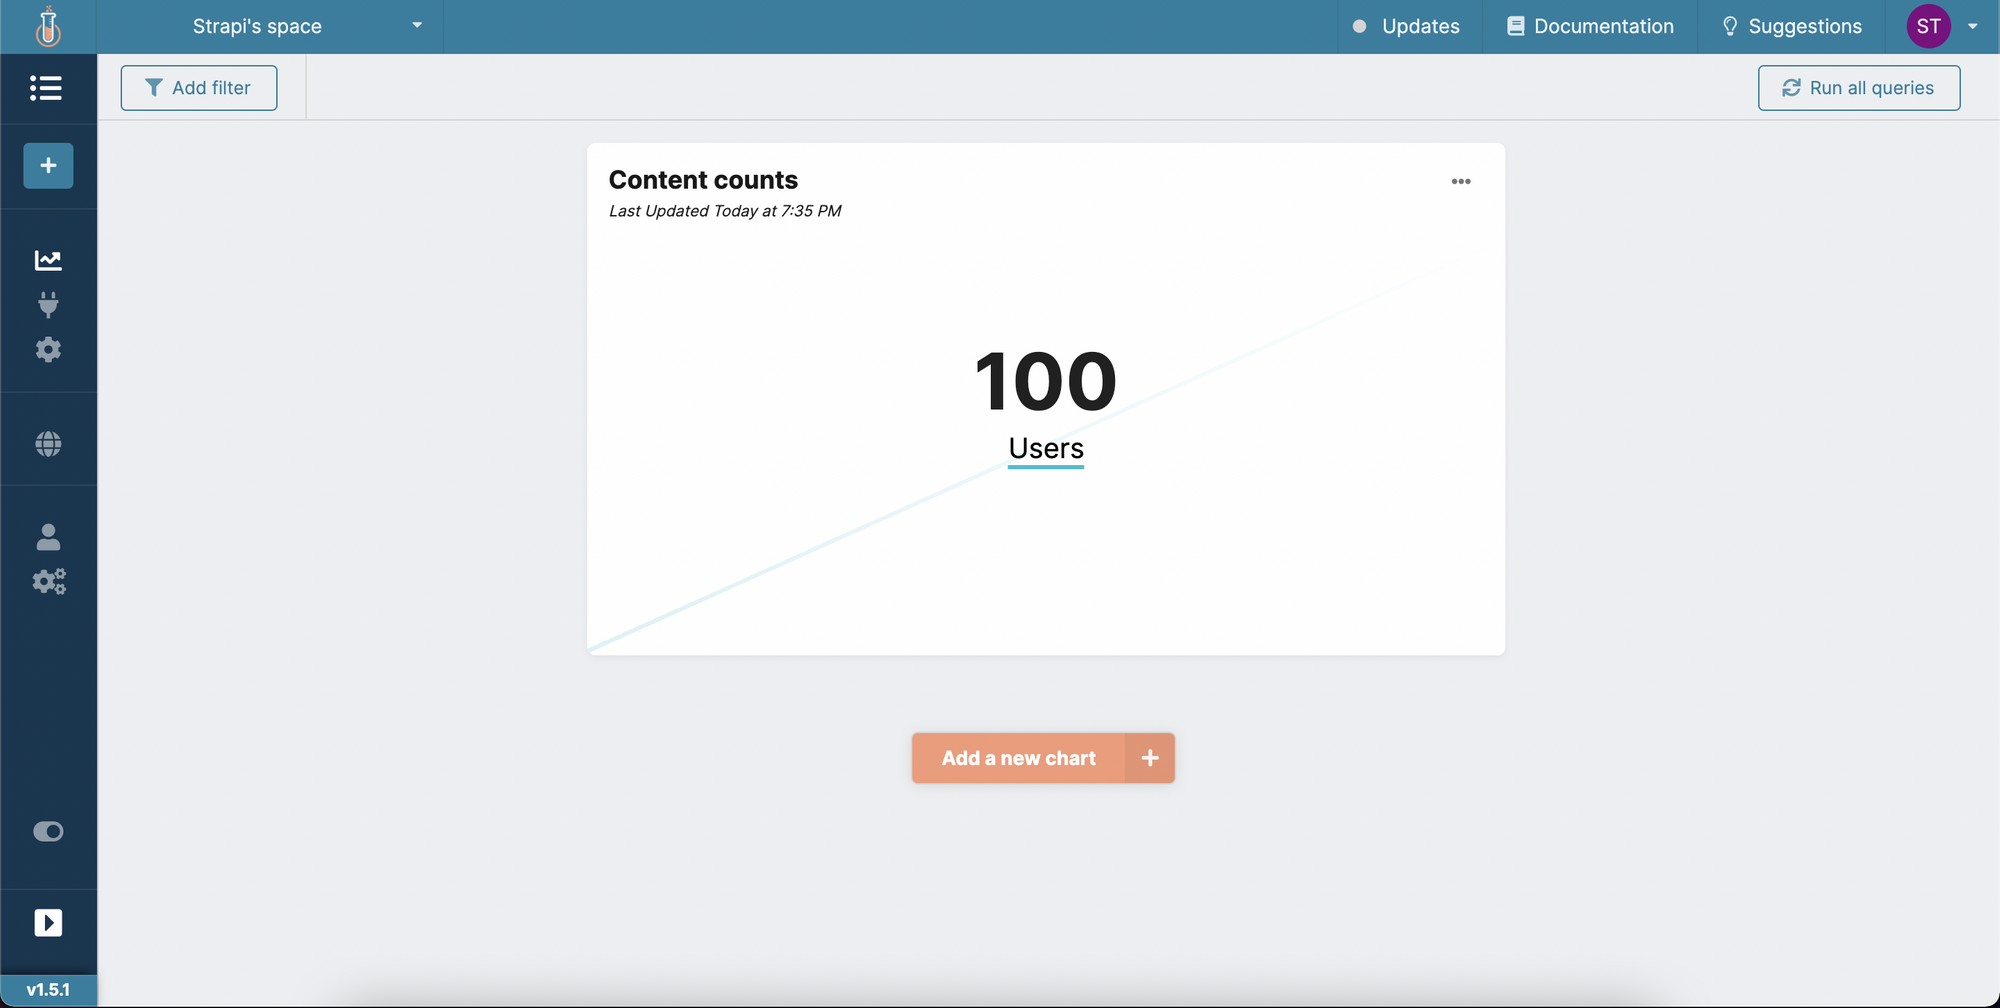
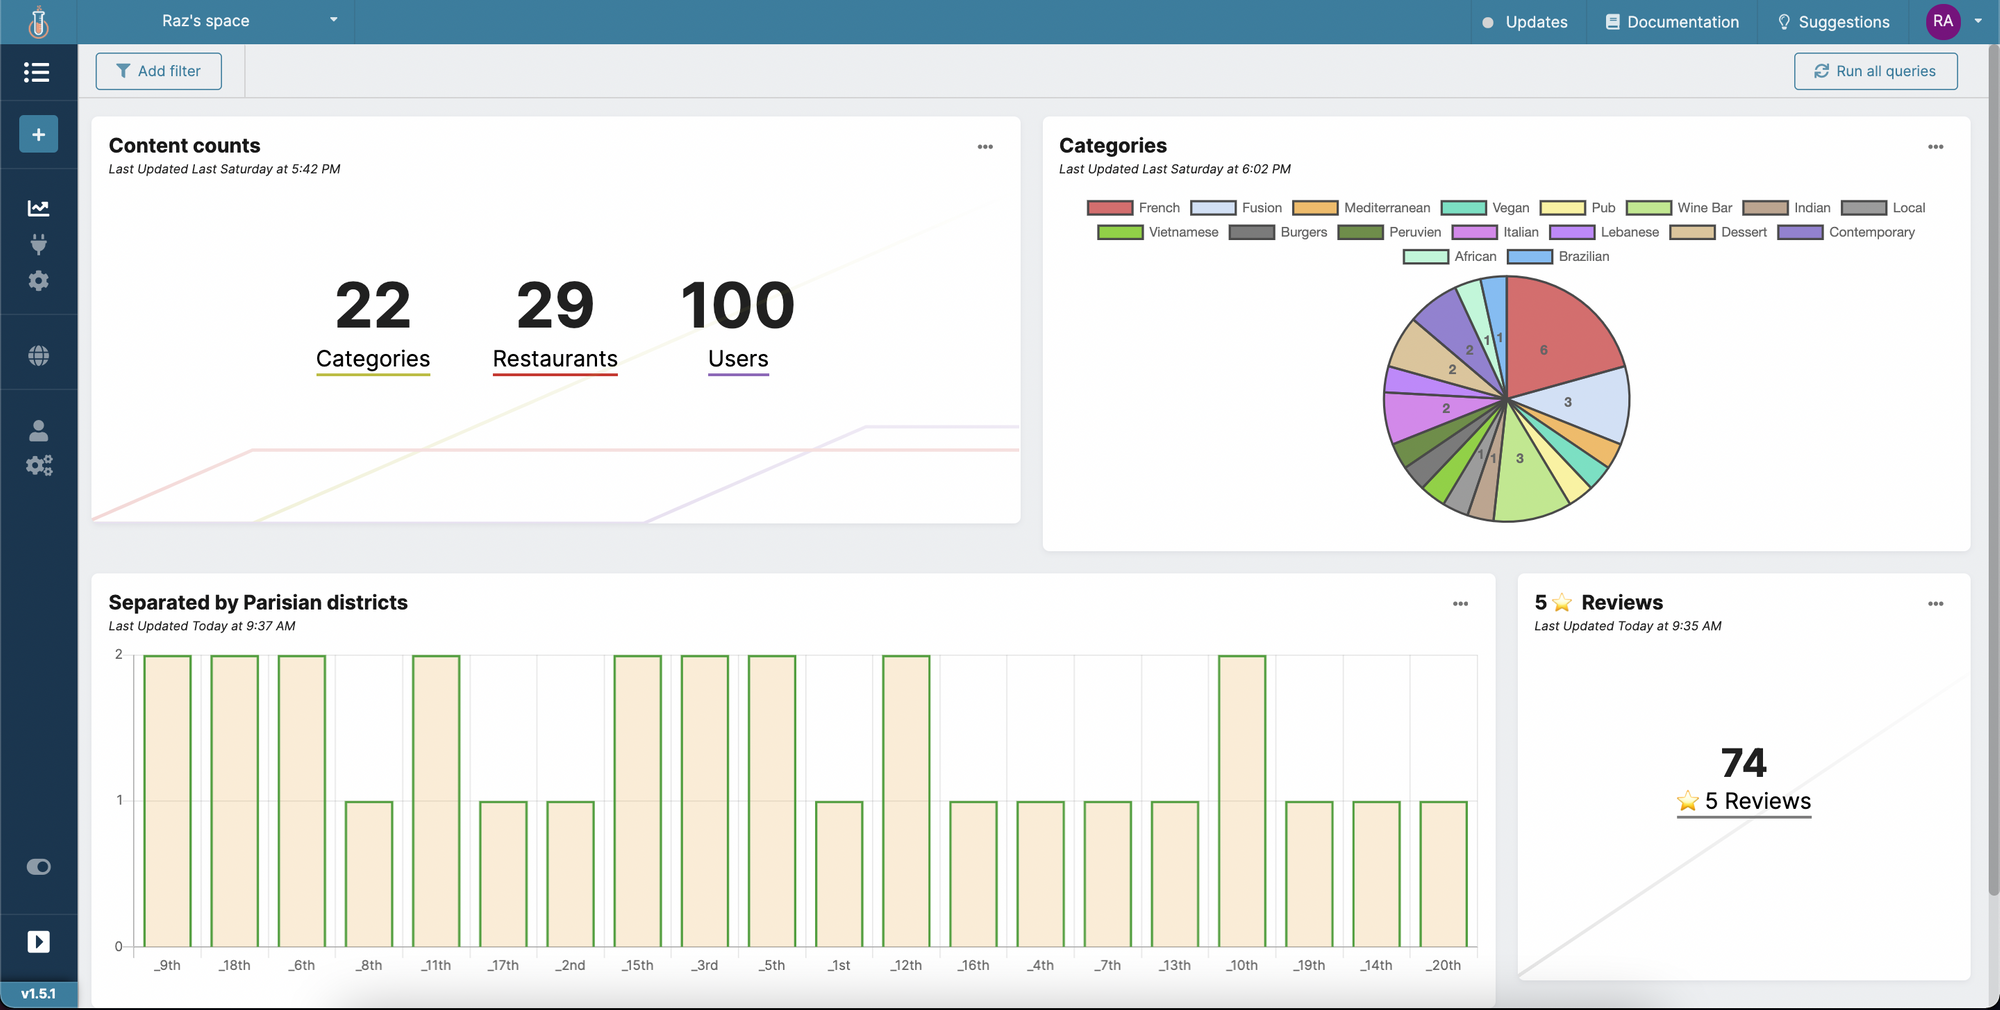
We can then go back to the dashboard to see the result:
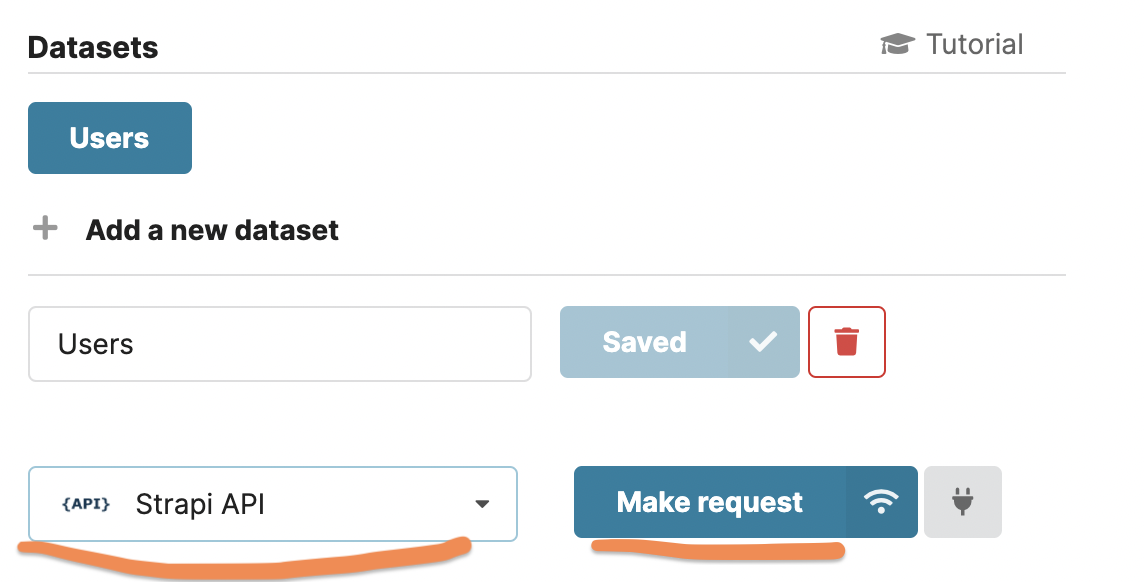
To add more values to the same chart, you can create new datasets to query the API for different content. Click on the title of the chart to enter the edit mode and add a new dataset.
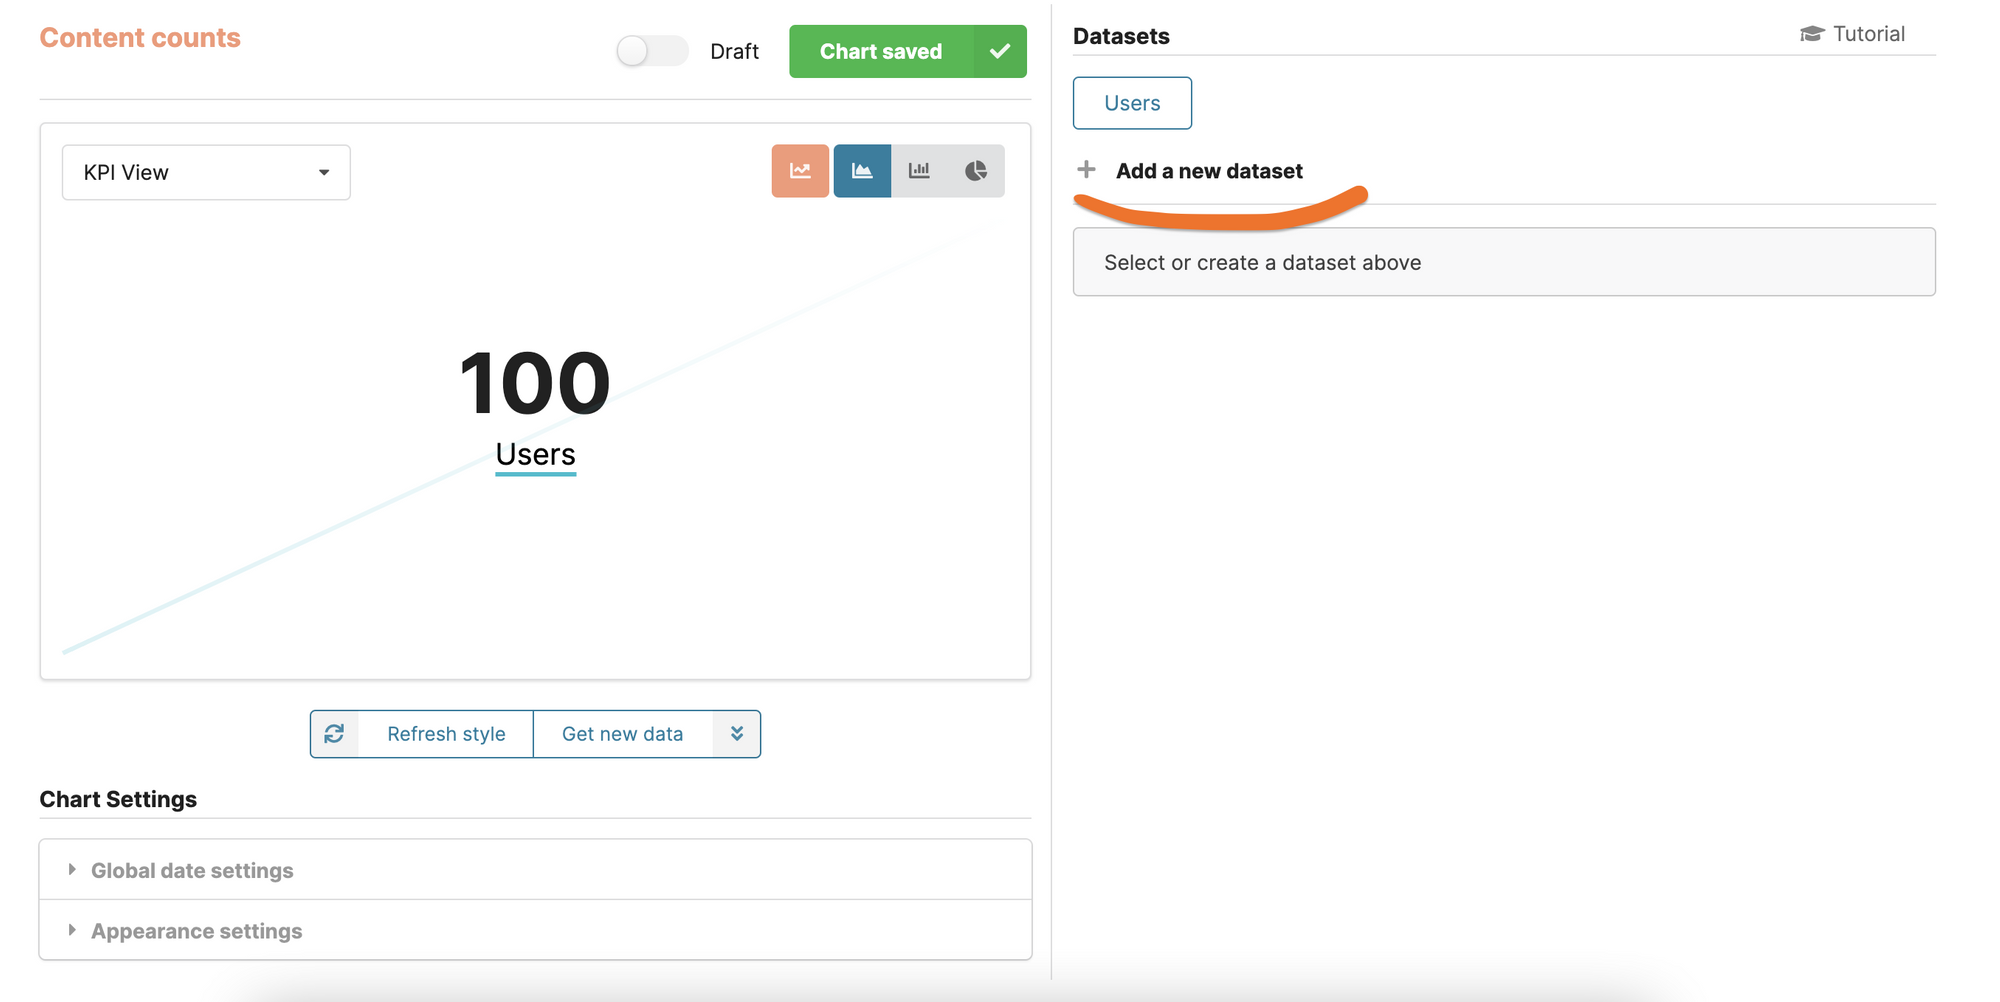
Repeat the same steps as the first dataset, but with a different piece of content, and keep track of multiple KPIs from the same chart. Afterward you can create more charts to fully monitor your product.
Paginate your Strapi requests
You can paginate all requests using Strapi's API and Chartbrew can automate this. The maximum number of values you can get from Strapi's API with a single request is 100. In order to get all of the values, you will need to turn pagination on like below:
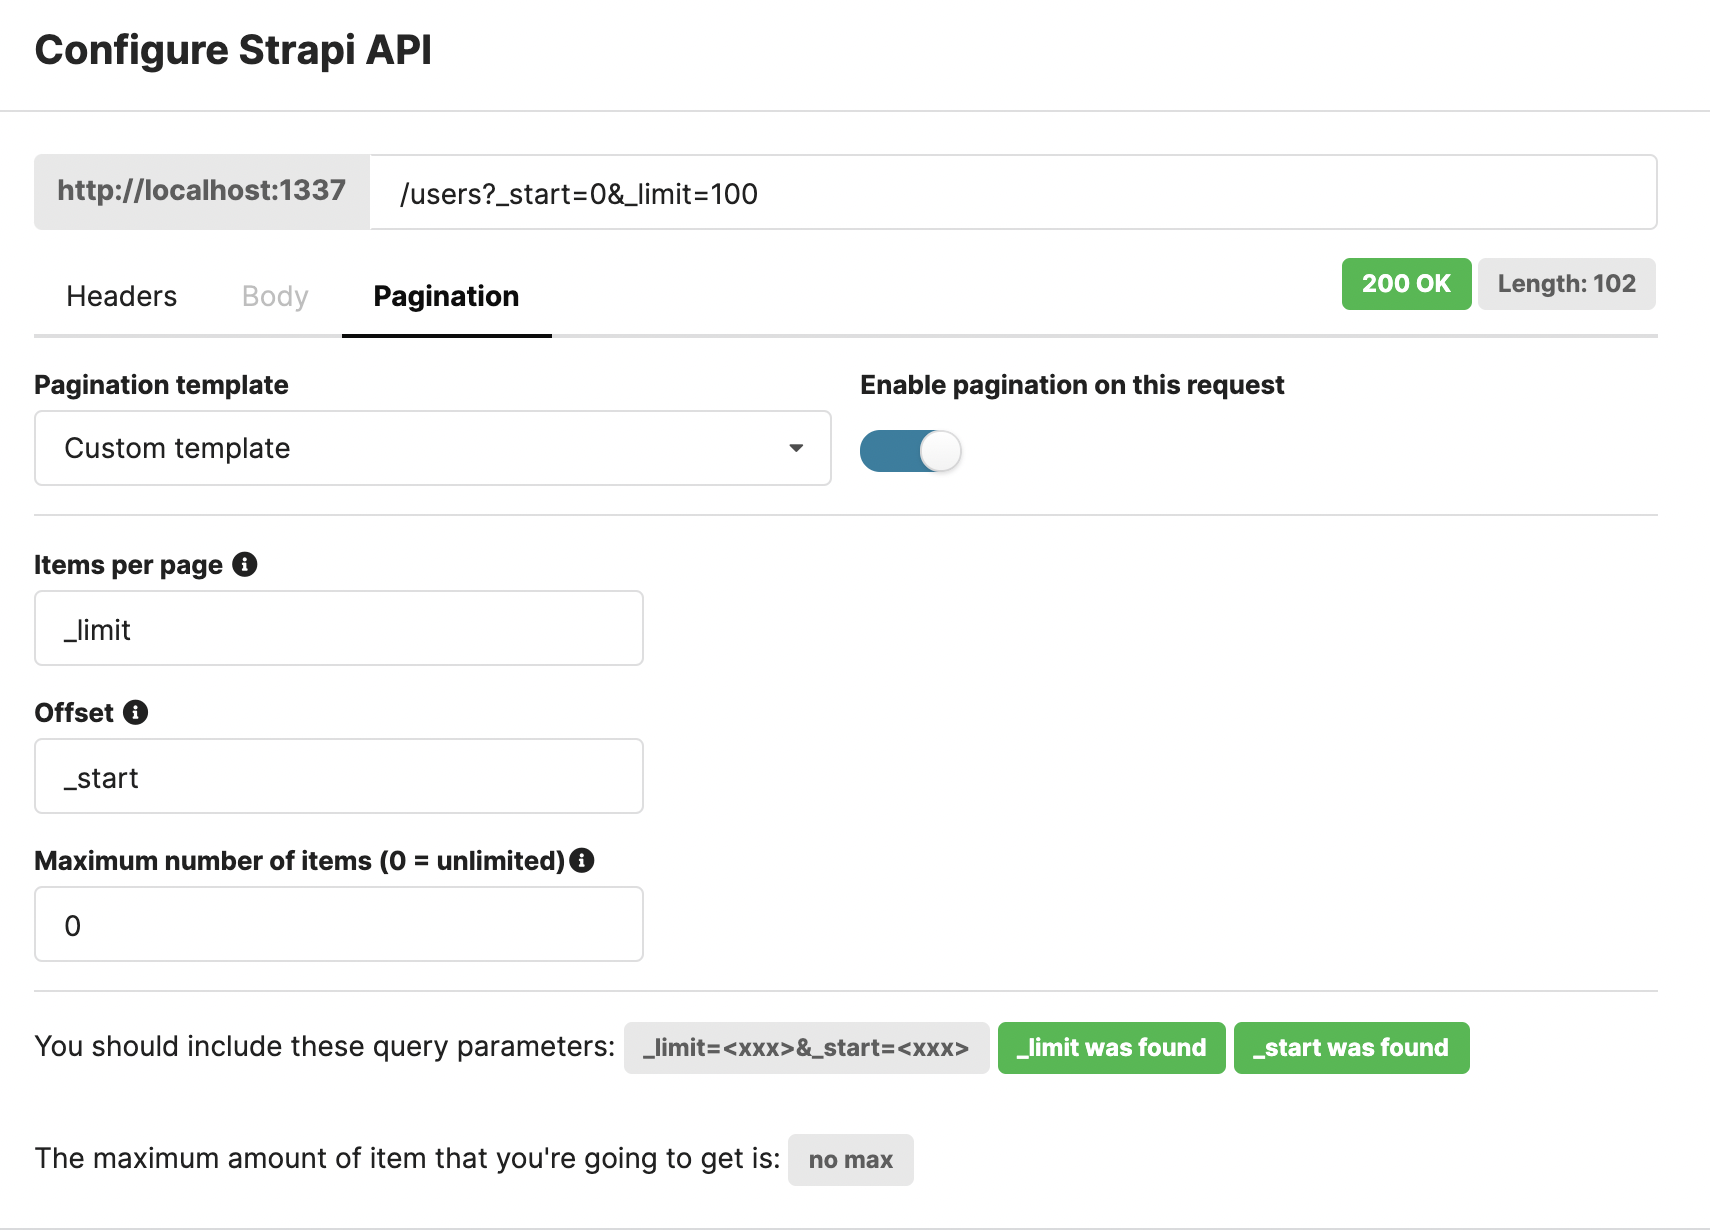
The first thing you will need to do is to head over to the Pagination tab and turn pagination on with the custom template. Then fill in the details like in the screenshot above and put a maximum number of values you want to get. If you leave it on 0, Chartbrew will get all the possible values. Don't forget to add the query parameters to the route as well (e.g. ?_start=0&_limit=100). In the example above, Chartbrew will start getting results from the beginning (_start=0) and get 100 items (_limit=100) with every request, until it reaches the maximum number. Now make the request and Chartbrew will fetch all your data!
Next steps
Are you using any other services to power your business? Try to connect these to the same dashboard to get useful insights. To give you some examples:
- Connect your finance-related data (e.g. connect Stripe's API)
- Running email marketing campaigns? Most services allow you to fetch data from their API. Give it a shot and see if you can get your campaign data in the same dashboard
