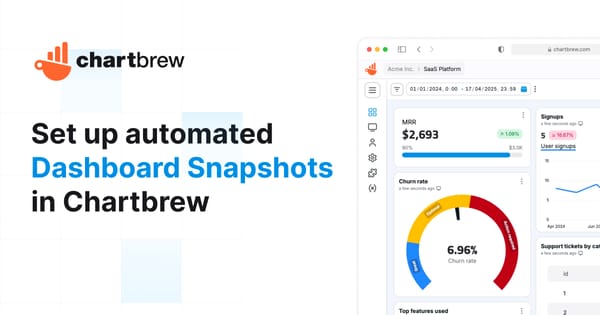
tutorial Automated Dashboard Snapshots in Chartbrew Learn how to schedule automated Chartbrew dashboard snapshots, customize theme and size, and deliver images to email, Slack, or any webhook in minutes.
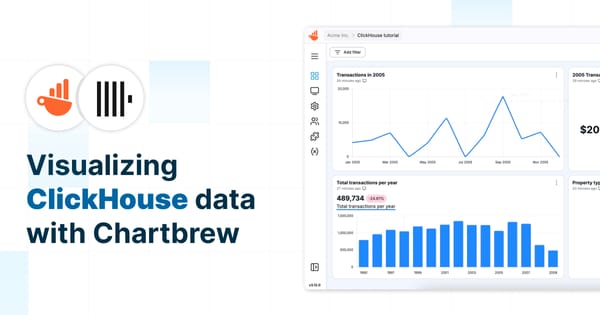
integration Visualizing ClickHouse Data with Chartbrew: A Step-by-Step Guide Learn how to connect ClickHouse to Chartbrew, write SQL queries, and build dynamic charts. This guide walks you through setting up a data source, creating datasets, and automating updates for real-time insights.
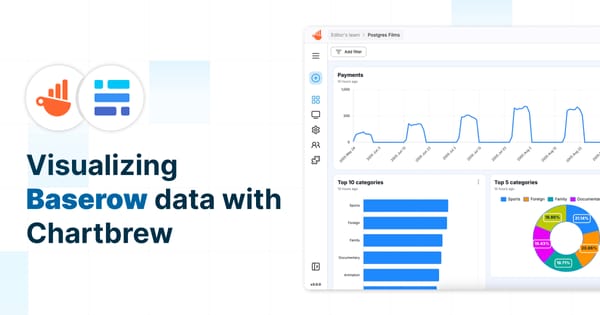
tutorial Visualizing Baserow data with Chartbrew Learn how to visualize Baserow data in Chartbrew with this step-by-step guide. From setting up an API connection to configuring datasets, handling pagination, and creating interactive charts, this tutorial will help you build a Baserow dashboard effortlessly.
integration How to connect and visualize Amazon RDS data with Chartbrew In this tutorial, we'll guide you through the steps to connect your Amazon RDS databases, specifically Postgres and MySQL, with Chartbrew
integration Featured Connect and visualize your Supabase Database with Chartbrew This tutorial shows you how to connect, query, and visualize your Supabase database with Chartbrew. Create Supabase client reports with ease.
integration Featured How to visualize Heroku Postgres data with Chartbrew In this tutorial, we are going to connect Heroku Postgres to Chartbrew, fetch some data, and create charts to visualize our data.
tutorial Visualize MySQL data with Chartbrew In this short tutorial, we will show how you can connect any MySQL database to Chartbrew. Once we connect the database, we are going to write a few simple queries to fetch some data and create datasets to be visualized in multiple ways.
integration Integrate Google Analytics (GA4) with your Chartbrew dashboards Integrate Google Analytics (GA4) with your Chartbrew dashboards and use our advanced query builder and chart editor to get the most out of your data.
integration Connect and visualize TimescaleDB data with Chartbrew Learn how to connect Timescale databases to Chartbrew and create powerful visualization dashboards and reports to monitor and share with others.
tutorial How to deploy Chartbrew on Render You can use Render to deploy your Chartbrew application for free. This tutorial will show you all the steps to get your visualization stack up and running.
tutorial Fetch Firestore collection data with the Firebase NodeJS SDK Getting Firestore data in the right format can be a tedious task. This blog post will show you how to fetch, filter, and flatten your data
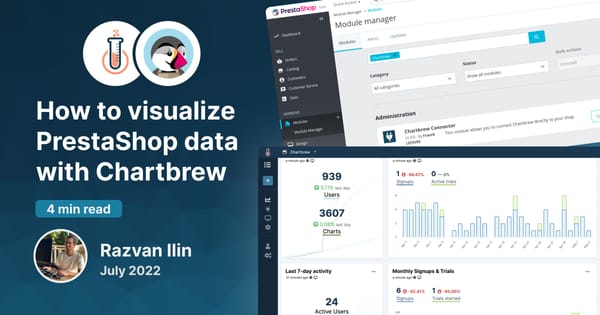
tutorial How to visualize PrestaShop data with Chartbrew Learn how to create charts and visualize your PrestaShop data to make better business decisions.
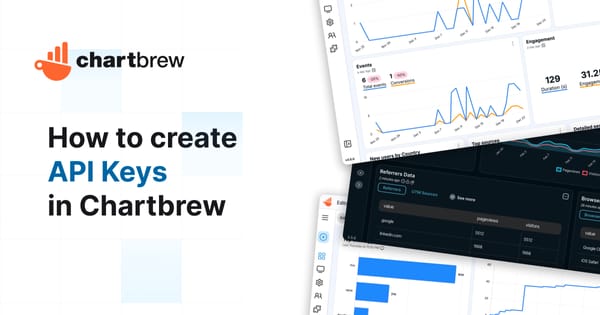
tutorial How to create API Keys in Chartbrew Chartbrew API Keys are useful when fetching or creating Chartbrew content from another application. Find out how to create them in this tutorial.
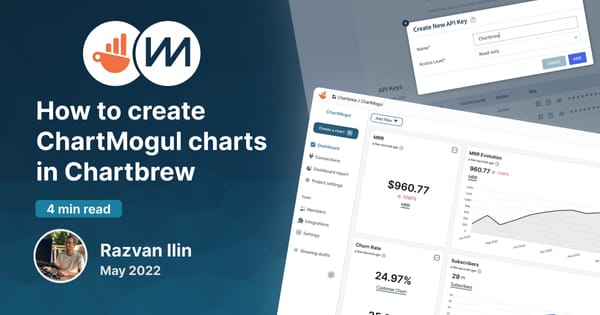
tutorial How to create ChartMogul charts in Chartbrew Chartbrew offers a ChartMogul dashboard template that can be used to create charts almost instantly. This tutorial will show you how to get started.
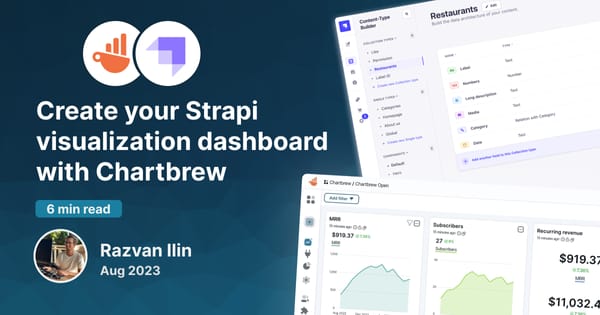
tutorial Create your Strapi visualization dashboard with Chartbrew Strapi is a headless content management system used by many businesses worldwide. Chartbrew can connect to its API to visualize and monitor data
tutorial How to deploy Chartbrew on Heroku and Vercel Deploy Chartbrew on Heroku and Vercel and power up your data reporting with a platform where you can gather all your data.
tutorial Visualize and report on Customer.io data with Chartbrew Customer.io is the perfect messaging platform to keep users engaged with your product. Chartbrew can now integrate with Customer.io to get data about customers and visualize it with beautiful charts and live reports.
tutorial Visualize your Firebase Realtime Database with Chartbrew Connect to Firebase Realtime Database to create reports and visualize your data. This tutorial will show you how to connect and create your first chart.
tutorial Chartbrew as a Chartio alternative Learn how Chartbrew works as an alternative to Chartio. In this blog post, you can check all the differences, pros, and cons in transitioning to Chartbrew.
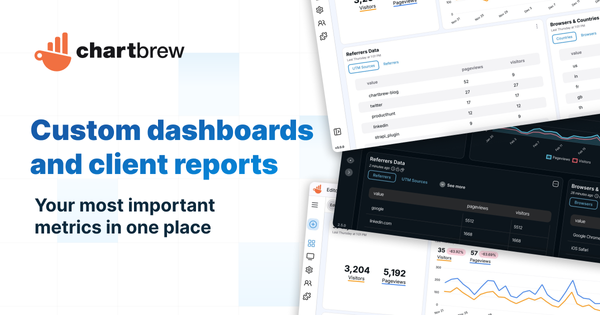
tutorial How to create, share, and customize client reports Learn how to create, share, and customize client reports with Chartbrew. Enjoy features like unique public URLs, team-only access, password protection, and extensive customization options.
tutorial Export dashboards to Excel sheets This post will show you how you can connect to multiple data sources and export the data to excel sheets. Supports APIs, databases, Firestore, and more.
tutorial How to create custom dashboard templates in Chartbrew Replicating a dashboard for different clients has never been easier. This tutorial will walk you through how to use the new template feature to replicate dashboards or individual charts across your projects.
tutorial Create your Google Analytics dashboard in Chartbrew Learn how you can power up your Chartbrew dashboards with the Google Analytics integration. Get to know your data with Chartbrew.
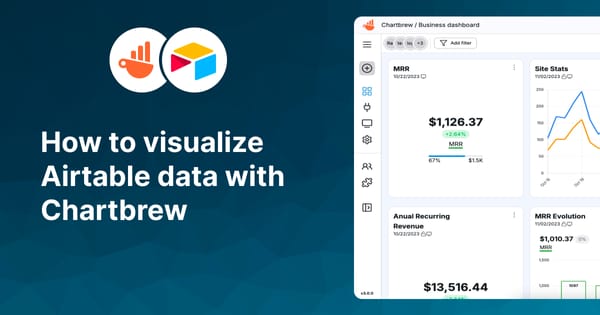
tutorial How to visualize Airtable data with Chartbrew Learn how to visualize Airtable data with Chartbrew. Create KPIs and other Airtable charts using Chartbrew's extended set of features.
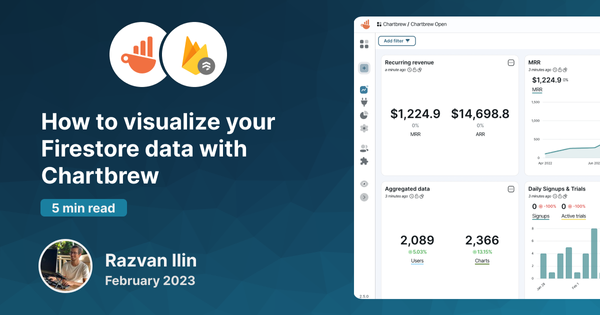
integration Featured How to visualize your Firestore data with Chartbrew Connect, query, and visualize your Firestore data with Chartbrew. A step-by-step tutorial on how you can start creating your insightful dashboard.