Build live Jira dashboards for sprint, issue, and delivery reporting
Connect Jira Cloud to Chartbrew and turn projects, sprints, boards, issues, JQL, and custom fields into live dashboards your product, engineering, QA, support, and leadership teams can use every day.
What You Can Track
Jira metrics that move beyond status meetings
Create dashboards around sprint health, backlog quality, delivery throughput, and team workload so Jira reporting stays visible between ceremonies.
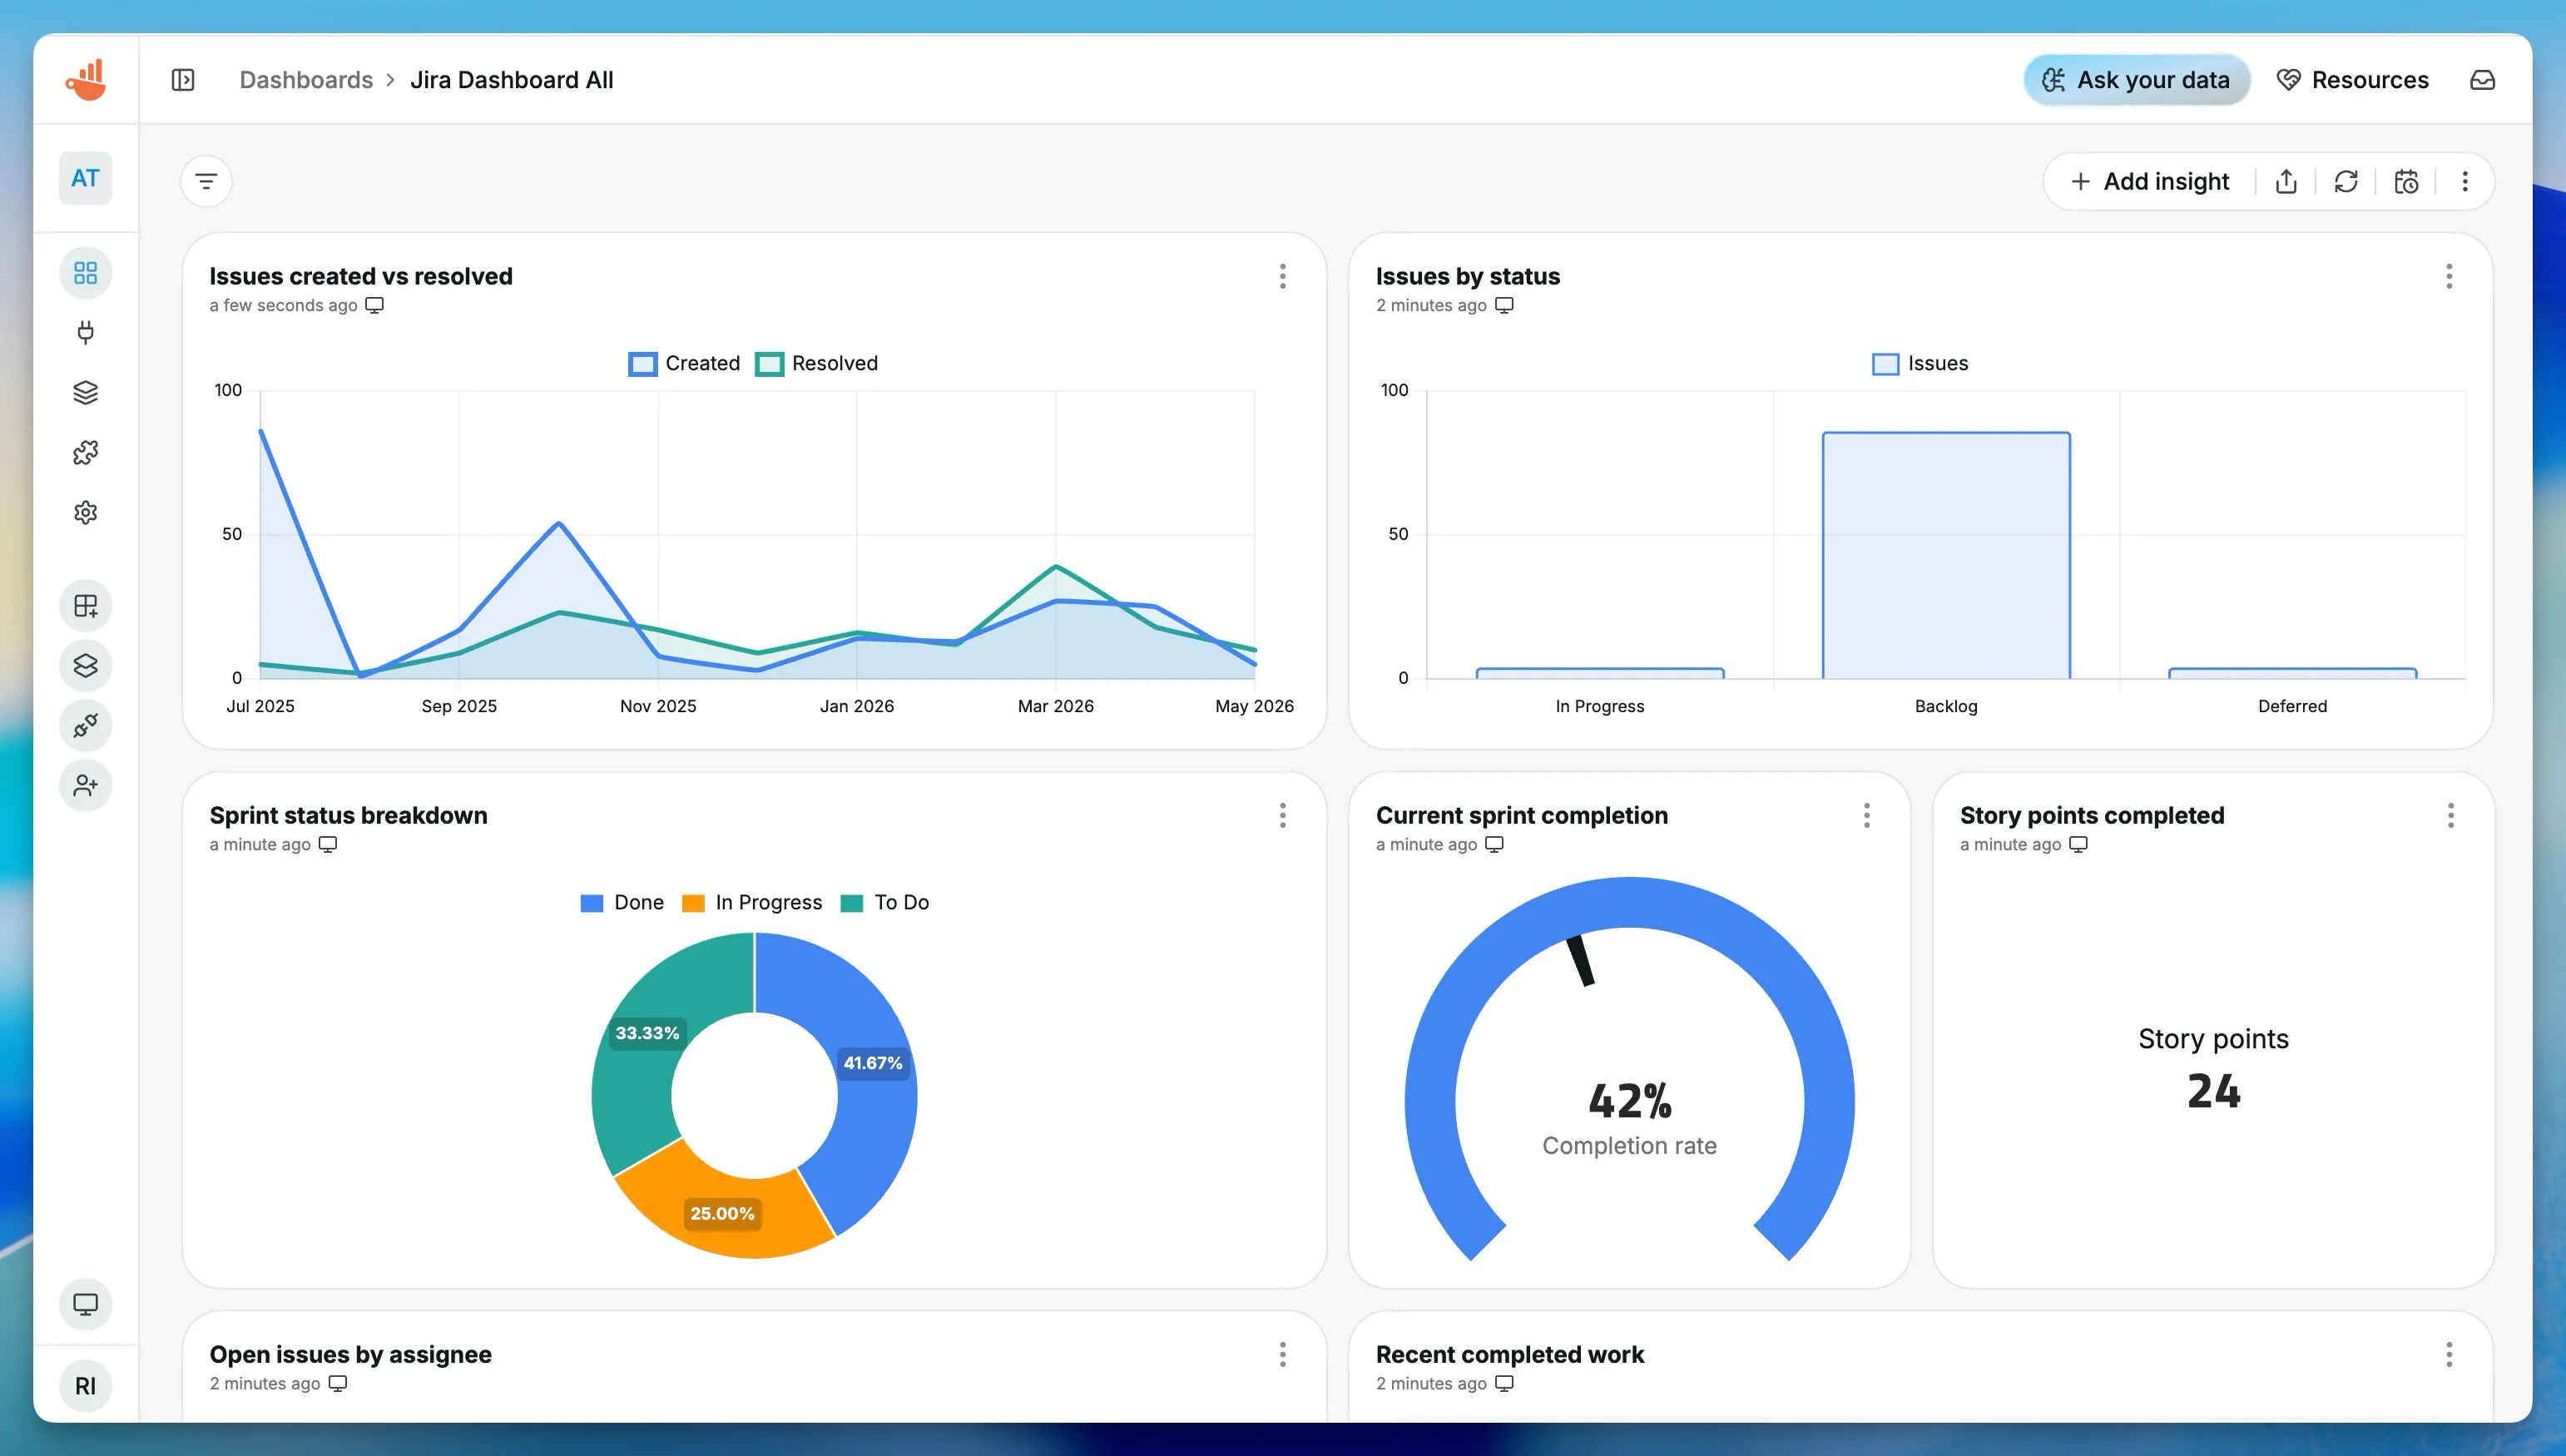
Sprint progress
Track completion rate, committed work, completed issues, story points, and carryover before sprint review.
Issues created vs resolved
Watch delivery throughput over time and spot projects where new work is outpacing completed work.
Bug backlog
Monitor open bugs by priority, bug trends, and the oldest unresolved bugs across one or more projects.
Workload by assignee
See open work, in-progress work, and story points by assignee so bottlenecks are easier to discuss.
Release progress
Use Jira versions and JQL-backed datasets to report on release scope, completed work, and remaining risk.
Stale issues
List issues that have not moved recently and keep daily standups focused on work that needs attention.
Dashboard Templates
Start with Jira reporting templates
Use Jira templates when you want useful dashboards quickly, then adjust datasets, JQL, chart types, filters, and schedule settings for your team.
Jira Sprint Health
Sprint completion, story points, carryover, workload, and status breakdowns.
Jira Bug Tracking
Open bugs, priority breakdowns, oldest bugs, and created versus resolved bug trends.
Jira Project Overview
Project-level KPIs, issue trends, status breakdowns, and recent completed work.
Jira Team Workload
Open work, work in progress, and stale issues grouped by assignee.

How It Works
From Jira Cloud to a live dashboard
The Jira workflow keeps setup direct while still supporting advanced JQL and custom field reporting.
Connect Jira Cloud
Add your Jira Cloud site URL, account email, and API token in Chartbrew.
Choose a project or sprint
Select projects, boards, sprints, versions, users, statuses, and issue types from Jira.
Build datasets
Use visual resources, saved JQL, or templates to turn Jira issues into reusable datasets.
Share live reporting
Publish dashboards, embed charts, or send scheduled snapshots to keep everyone aligned.
Why Chartbrew for Jira
Built for Jira dashboards that people actually check
Chartbrew gives Jira data a reusable reporting layer with templates, AI support, scheduled refreshes, sharing, and embeds.
Native Jira resources
Chartbrew understands Jira projects, boards, sprints, versions, users, issue types, statuses, and custom field mappings.
Flexible JQL reporting
Use JQL when your team needs exact reporting logic, then visualize the results without rebuilding reports manually.
Templates for fast starts
Start from sprint health, bug tracking, project overview, and workload templates instead of a blank dashboard.
AI-assisted exploration
Ask Chartbrew AI for Jira datasets and charts when you want a faster way to inspect delivery metrics.
Scheduled reporting
Refresh Jira dashboards and send snapshots on a schedule so status reporting does not become recurring manual work.
Shareable dashboards
Give product, engineering, support, and leadership the same live Jira reporting layer.
Setup Requirements
What you need before connecting Jira
The Jira connector uses Jira Cloud API credentials and can be refined with project, sprint, board, version, user, and field mapping context.
A Jira Cloud site URL, for example https://company.atlassian.net
A Jira account email with access to the projects you want to report on
A Jira API token for that account
Project, board, sprint, version, or JQL context for the dashboard you want to build
Optional story point, severity, or team field mappings for richer agile metrics
| Dataset idea | What it can power |
|---|---|
| Sprint summary | Completion rate, committed issues, completed issues, story points |
| Issues by status | Open issues grouped by Jira workflow status or status category |
| Created vs resolved trend | Daily issue creation and resolution volume for delivery throughput |
| Open bugs by priority | Bug backlog split by priority for support and QA reviews |
| Work in progress by assignee | Current in-progress issues grouped by owner |
| Stale issue table | Open issues not updated recently, sorted by oldest activity |
| Recent completed work | Done issues over a selected date range for stakeholder updates |
| Release scope | Issues attached to a Jira version with completion and remaining work |
Setup Guide
Follow the step-by-step Jira connection guide
Create a Jira API token, add the Jira Cloud connection in Chartbrew, and start from the sprint health dashboard template.
Related Features
Features that make Jira reporting useful
Combine Jira dashboards with Chartbrew sharing, automation, embeds, and AI workflows.
Report builder
Create Jira dashboard sections with KPI cards, tables, charts, filters, and reusable reporting layouts.
Chartbrew AI
Ask for Jira charts, sprint summaries, bug reports, and workload breakdowns without starting from an empty dataset.
Data update schedules
Refresh Jira dashboards automatically so sprint, issue, and backlog reporting stays current throughout the week.
Dashboard snapshots
Send scheduled Jira dashboard snapshots to stakeholders before planning, standups, reviews, or leadership updates.
Embedded reports
Embed Jira project health, bug tracking, or delivery dashboards into internal portals and client reporting spaces.
Slack assistant
Bring Jira delivery metrics into Slack workflows so teams can discuss project status where conversations already happen.
Related Integrations
Connect Jira with the rest of your reporting stack
Blend Jira delivery metrics with product, customer, revenue, and operational data from other Chartbrew sources.
FAQ
Jira integration questions
Practical details about using Jira Cloud data in Chartbrew dashboards.
Build your Jira dashboard
Turn Jira work into live reporting without another spreadsheet loop
Connect Jira Cloud, start from a template, and share sprint, project, bug, and workload dashboards with the teams that need them.
