

 Customer.io integration
Build Customer.io dashboards for campaigns, segments, people, and lifecycle reporting
Connect Customer.io to Chartbrew and turn people, campaigns, links, actions, segments, object types, message activity, and lifecycle data into live dashboards.
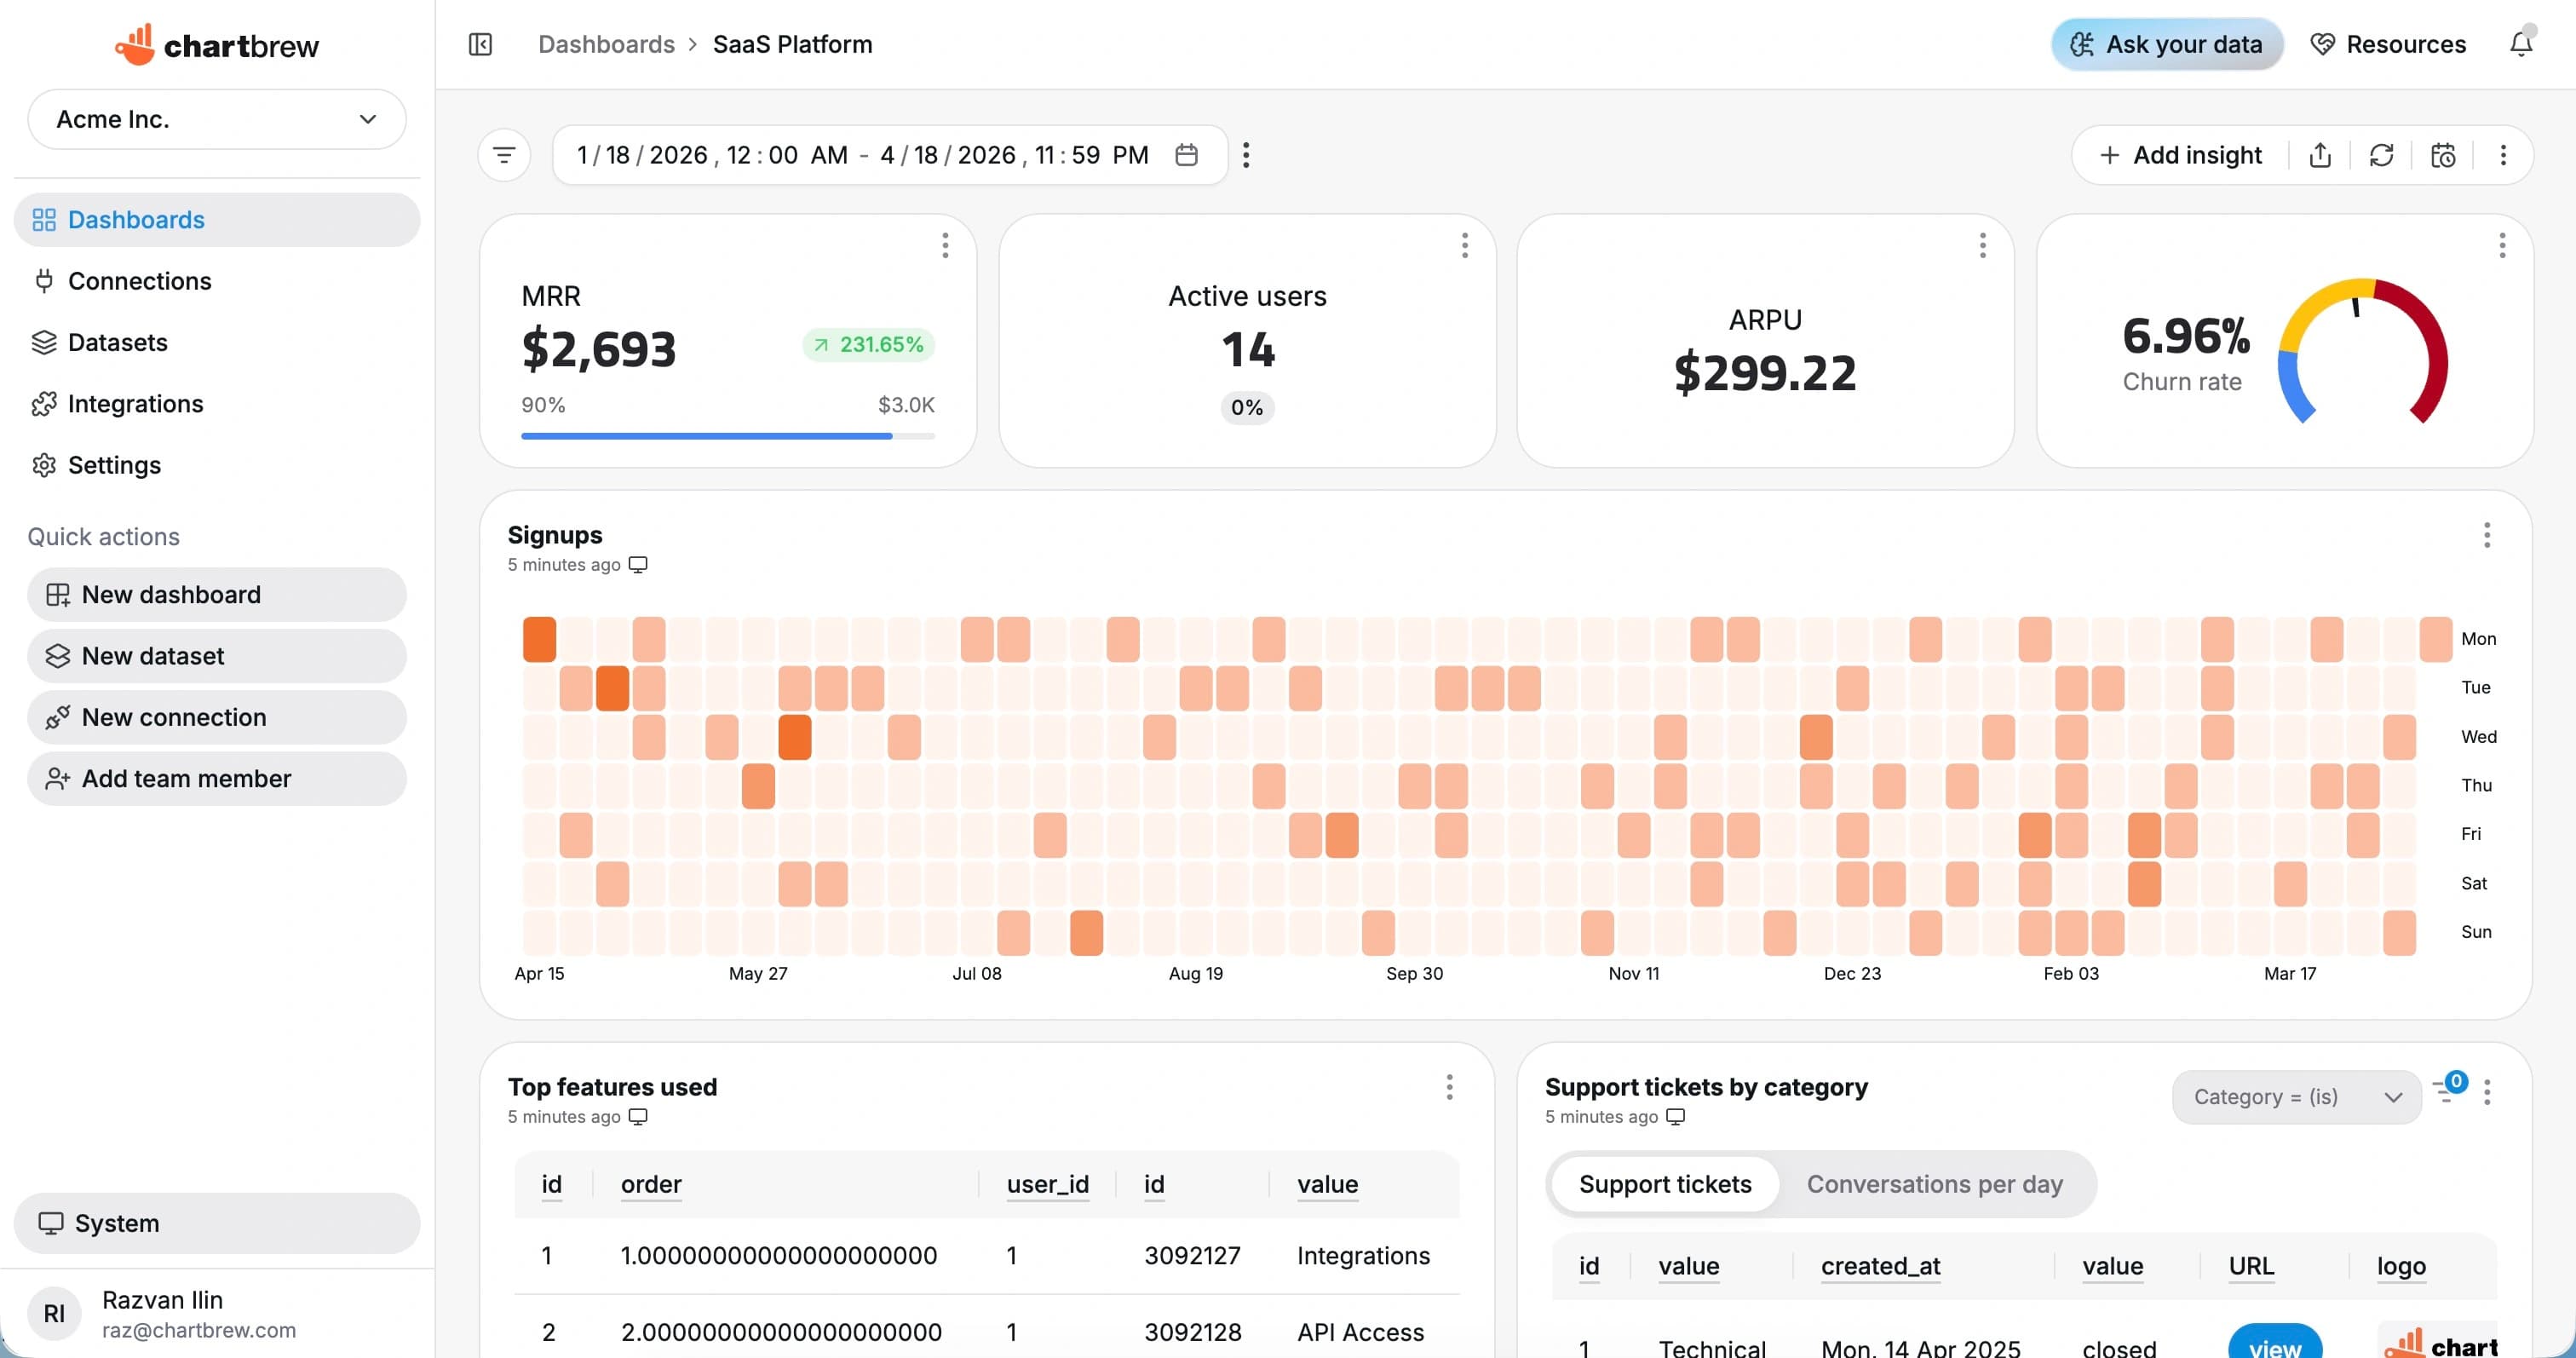
What You Can Track
Customer.io metrics for lifecycle and messaging teams
Report on campaign performance, audience segments, lifecycle movement, and customer activity without rebuilding exports.
Campaign activity
Track campaign sends, actions, and engagement across lifecycle programs.
Segment size
Monitor people and objects by segment so audience changes are visible over time.
Message engagement
Visualize opens, clicks, delivered messages, bounced messages, and other activity fields.
Link performance
Report on campaign links and click activity to understand what content drives response.
Lifecycle movement
Track users by status, plan, journey stage, lifecycle step, or custom attributes.
Recent activity
Create tables of recent events, campaign actions, people, or objects for operational review.
How It Works
From Customer.io connection to live dashboard
The Customer.io workflow is built around a source connection, reusable datasets, scheduled refreshes, and shareable dashboards.
Connect Customer.io
Add your Customer.io bearer token and test the source in Chartbrew.
Choose the reporting scope
Choose people, campaigns, campaign links, campaign actions, segments, or object types as the reporting scope.
Create datasets
Turn the response fields you need into KPI, chart, and table datasets with filters and date ranges.
Share live reporting
Publish dashboards, embed reports, or send scheduled snapshots so reporting stays repeatable.
Why Chartbrew for Customer.io
Customer.io reporting that can sit beside product and revenue data
Chartbrew gives lifecycle teams reusable dashboards, scheduled snapshots, and cross-source reporting around Customer.io activity.
Native Customer.io resources
Chartbrew can work with Customer.io people, campaign, link, action, segment, and object-type data.
Lifecycle dashboards
Turn campaign and audience data into dashboards that are easier to share than one-off exports.
AI-assisted exploration
Use Chartbrew AI to plan campaign, audience, and lifecycle dataset ideas faster.
Scheduled reporting
Refresh Customer.io dashboards and send snapshots for weekly lifecycle reviews.
Cross-source context
Place Customer.io metrics beside Stripe revenue, product database, GA4, and support data.
Client-ready dashboards
Share or embed lifecycle reporting without giving viewers direct access to Customer.io.
Setup Requirements
What you need before connecting Customer.io
Start with the right Customer.io access, a clear reporting scope, and a few fields that map to useful dashboard metrics.
A Customer.io workspace with the people, campaign, segment, or object data you want to report on
A Customer.io bearer token with access to the relevant APIs
Campaign, segment, object type, or people fields for your first dashboard
Date, status, channel, campaign, and link fields for trends and breakdowns
Optional product, customer, revenue, or lifecycle context from other sources
| Dataset idea | What it can power |
|---|---|
| Campaign actions | Campaign actions grouped by campaign, action, or date |
| Segment overview | People or objects grouped by lifecycle segment |
| Link clicks | Campaign links ranked by click activity |
| People by attribute | People grouped by plan, status, lifecycle stage, or region |
| Recent activity | Latest campaign actions or people records for review |
| Audience growth | People added over a selected reporting period |
| Channel performance | Email, push, SMS, or in-app activity by channel if present |
| Campaign comparison | Campaign-level engagement and action totals |
Setup Guide
Follow the Customer.io reporting guide
Use the guide to connect Customer.io, choose campaign and audience resources, and build your first lifecycle dashboard.
Related Features
Features that make Customer.io reporting useful
Use Customer.io dashboards with Chartbrew automation, AI workflows, sharing, embeds, filters, and reporting tools.
Reporting API
Use Chartbrew alongside API-driven reporting workflows when teams need dashboards and programmable access.
Webhooks
Trigger reporting workflows and keep dashboards aligned with events from the rest of your stack.
Chartbrew AI
Turn API, product, marketing, and operational questions into chart and dataset ideas faster.
Data update schedules
Keep API dashboards refreshed on the cadence your reporting workflow needs.
Dashboard snapshots
Send recurring API dashboard snapshots to stakeholders without rebuilding weekly status reports.
Embedded reports
Publish API-powered charts inside client portals, internal tools, and shared reporting pages.
Related Integrations
Connect Customer.io with the rest of your reporting stack
Blend Customer.io metrics with product, customer, revenue, analytics, project, and operational data from other Chartbrew sources.
FAQ
Customer.io integration questions
Practical details about using Customer.io data in Chartbrew dashboards.
Build your Customer.io dashboard
Turn Customer.io lifecycle data into dashboards your team can use
Connect Customer.io, build reusable campaign and audience datasets, and share lifecycle reporting across marketing, product, and revenue teams.
