
Jira reporting can get messy quickly. The data is there, but the useful dashboard usually depends on context: which project, which board, which sprint, which issue types, and which fields your team actually uses.
The new Jira Cloud source in Chartbrew is built for that kind of reporting. You can connect Jira once, create dashboards from project and sprint templates, build custom Jira datasets, and use Chartbrew AI to turn Jira questions into Jira-specific chart configurations.
What the Jira source is for
The Jira source is meant for product, engineering, support, and delivery dashboards. It reads Jira data and helps you build live views for project health, sprint progress, bug triage, workload, stale issues, and recently completed work.
The starter templates cover the common dashboards most teams need first:
| Template | Use it when you want to track |
|---|---|
| Jira Project Overview | Issues created vs resolved, issues by status, open issues by assignee, recent completed work |
| Jira Sprint Health | Sprint completion, completed story points, sprint work by assignee, sprint status breakdown, carryover issues |
| Jira Bug Tracking | Bugs by priority, bug trend, oldest open bugs |
| Jira Team Workload | Open issues by assignee, work in progress by assignee, stale issues |
Connect Jira
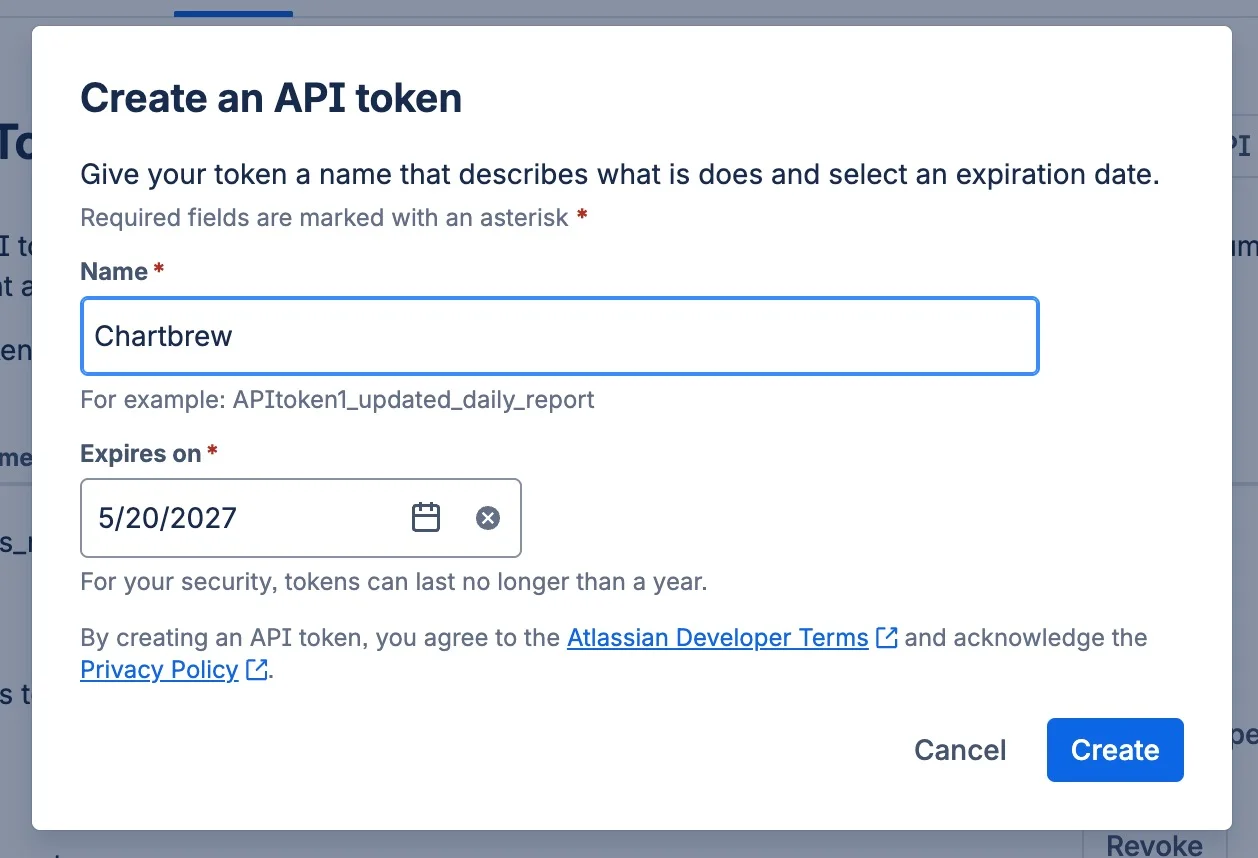
Start by creating a Jira API token from your Atlassian account security settings. Use the Jira account that has access to the projects, boards, sprints, and issues you want to chart. If that user cannot see a project in Jira, Chartbrew will not be able to report on it either.
You can create or manage tokens here: Atlassian API tokens.
In Chartbrew, open the project where you want the dashboard, go to Connections, and choose Jira. The connection form asks for your Jira Cloud site URL, account email, and API token. The site URL should look like https://example.atlassian.net.
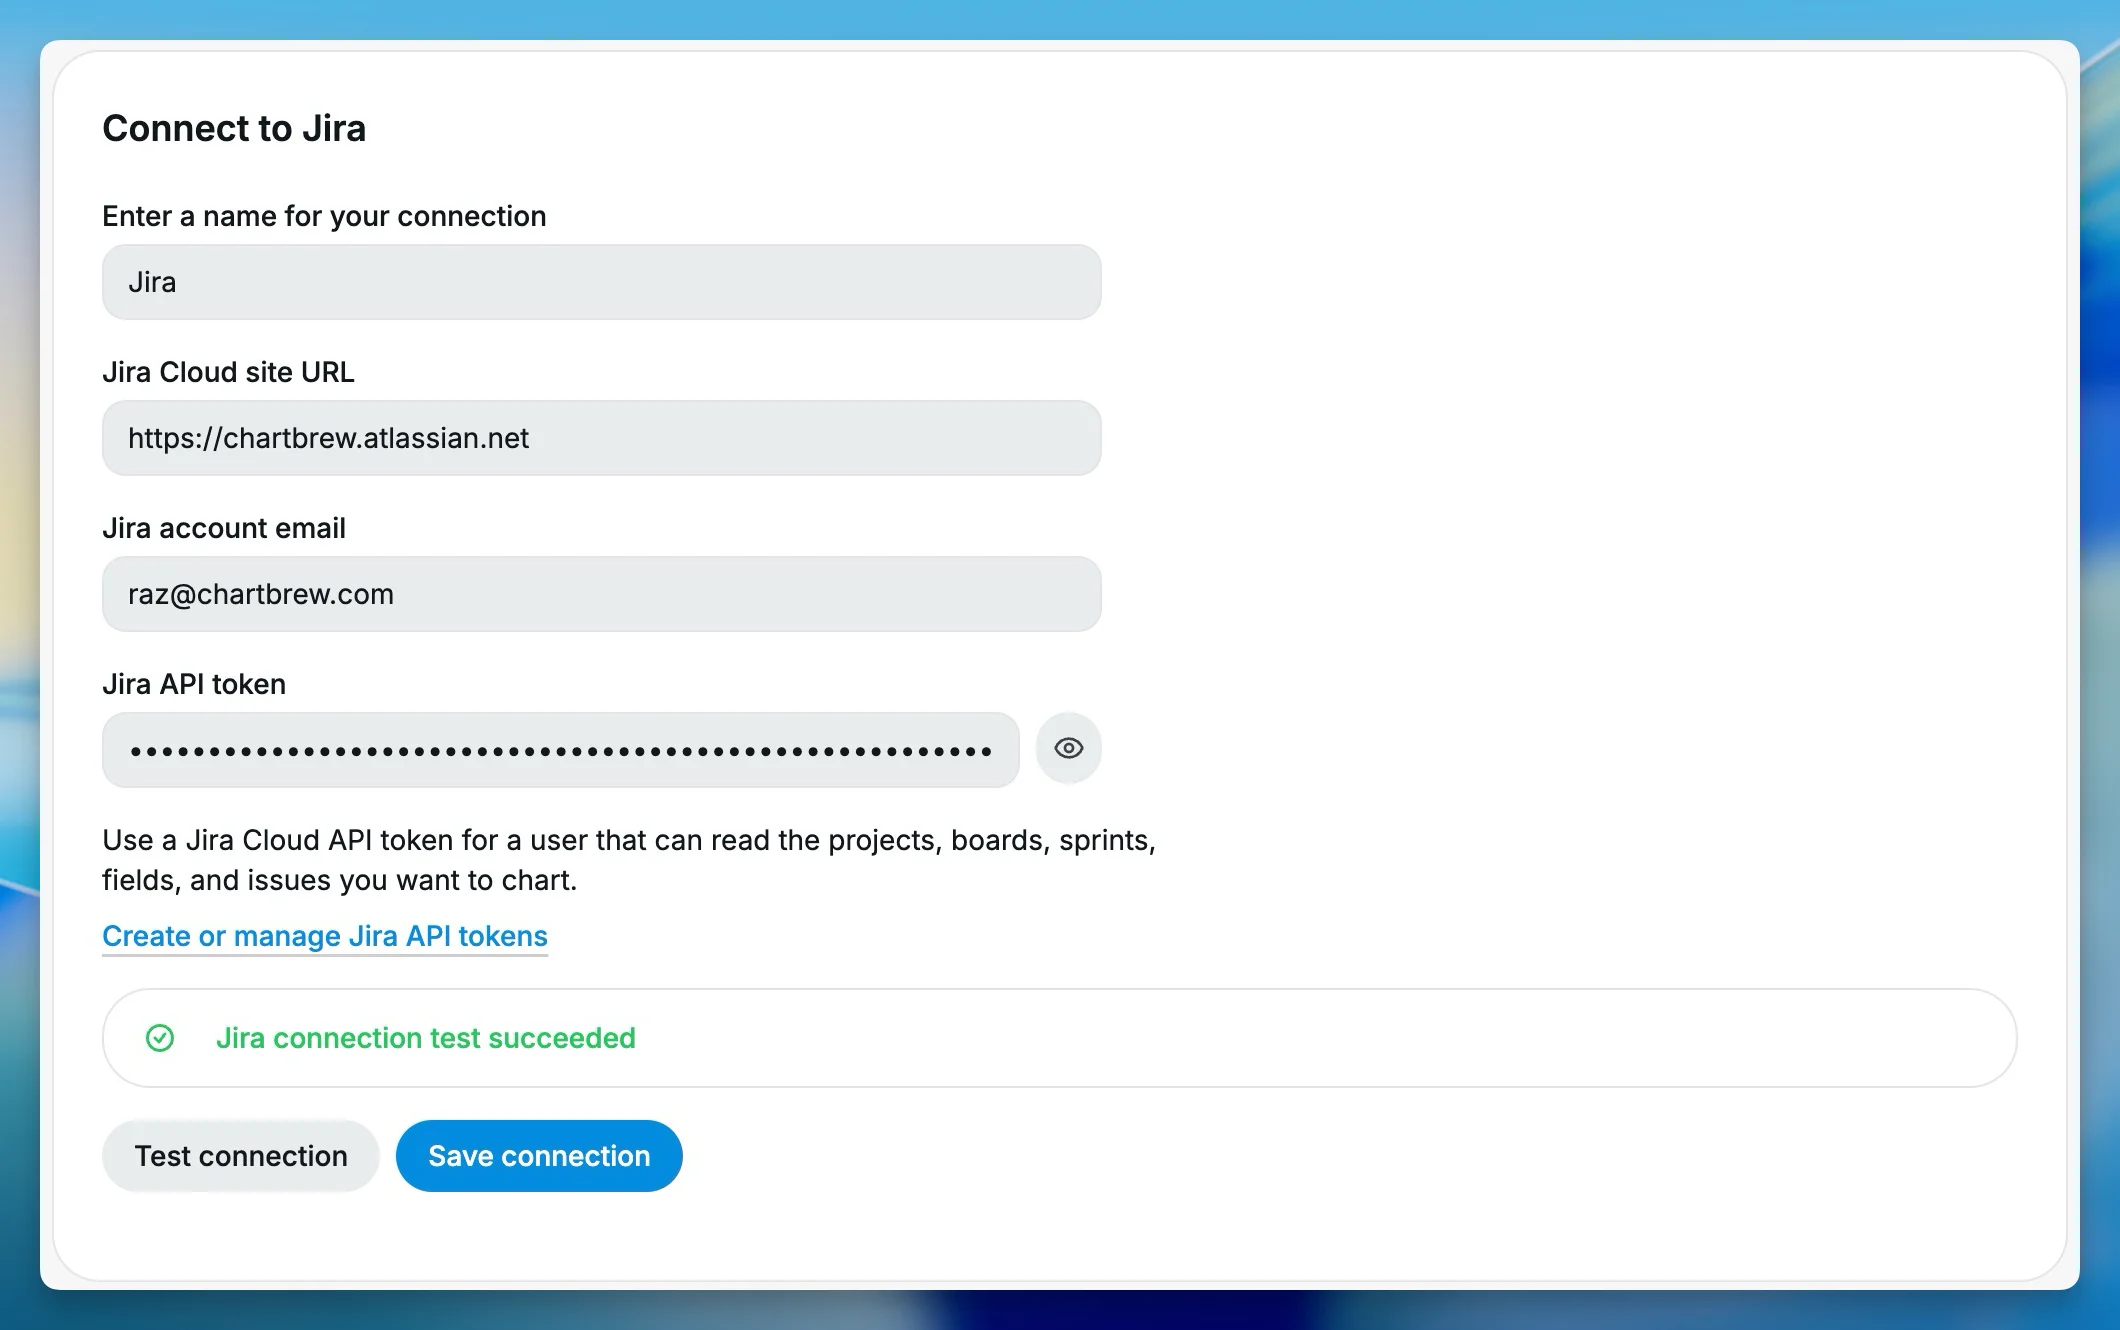
Run Test connection before saving. Chartbrew validates the Jira Cloud URL and checks whether the token can read Jira data. Once the test succeeds, save the connection and move on to templates.
Create the first Jira dashboard
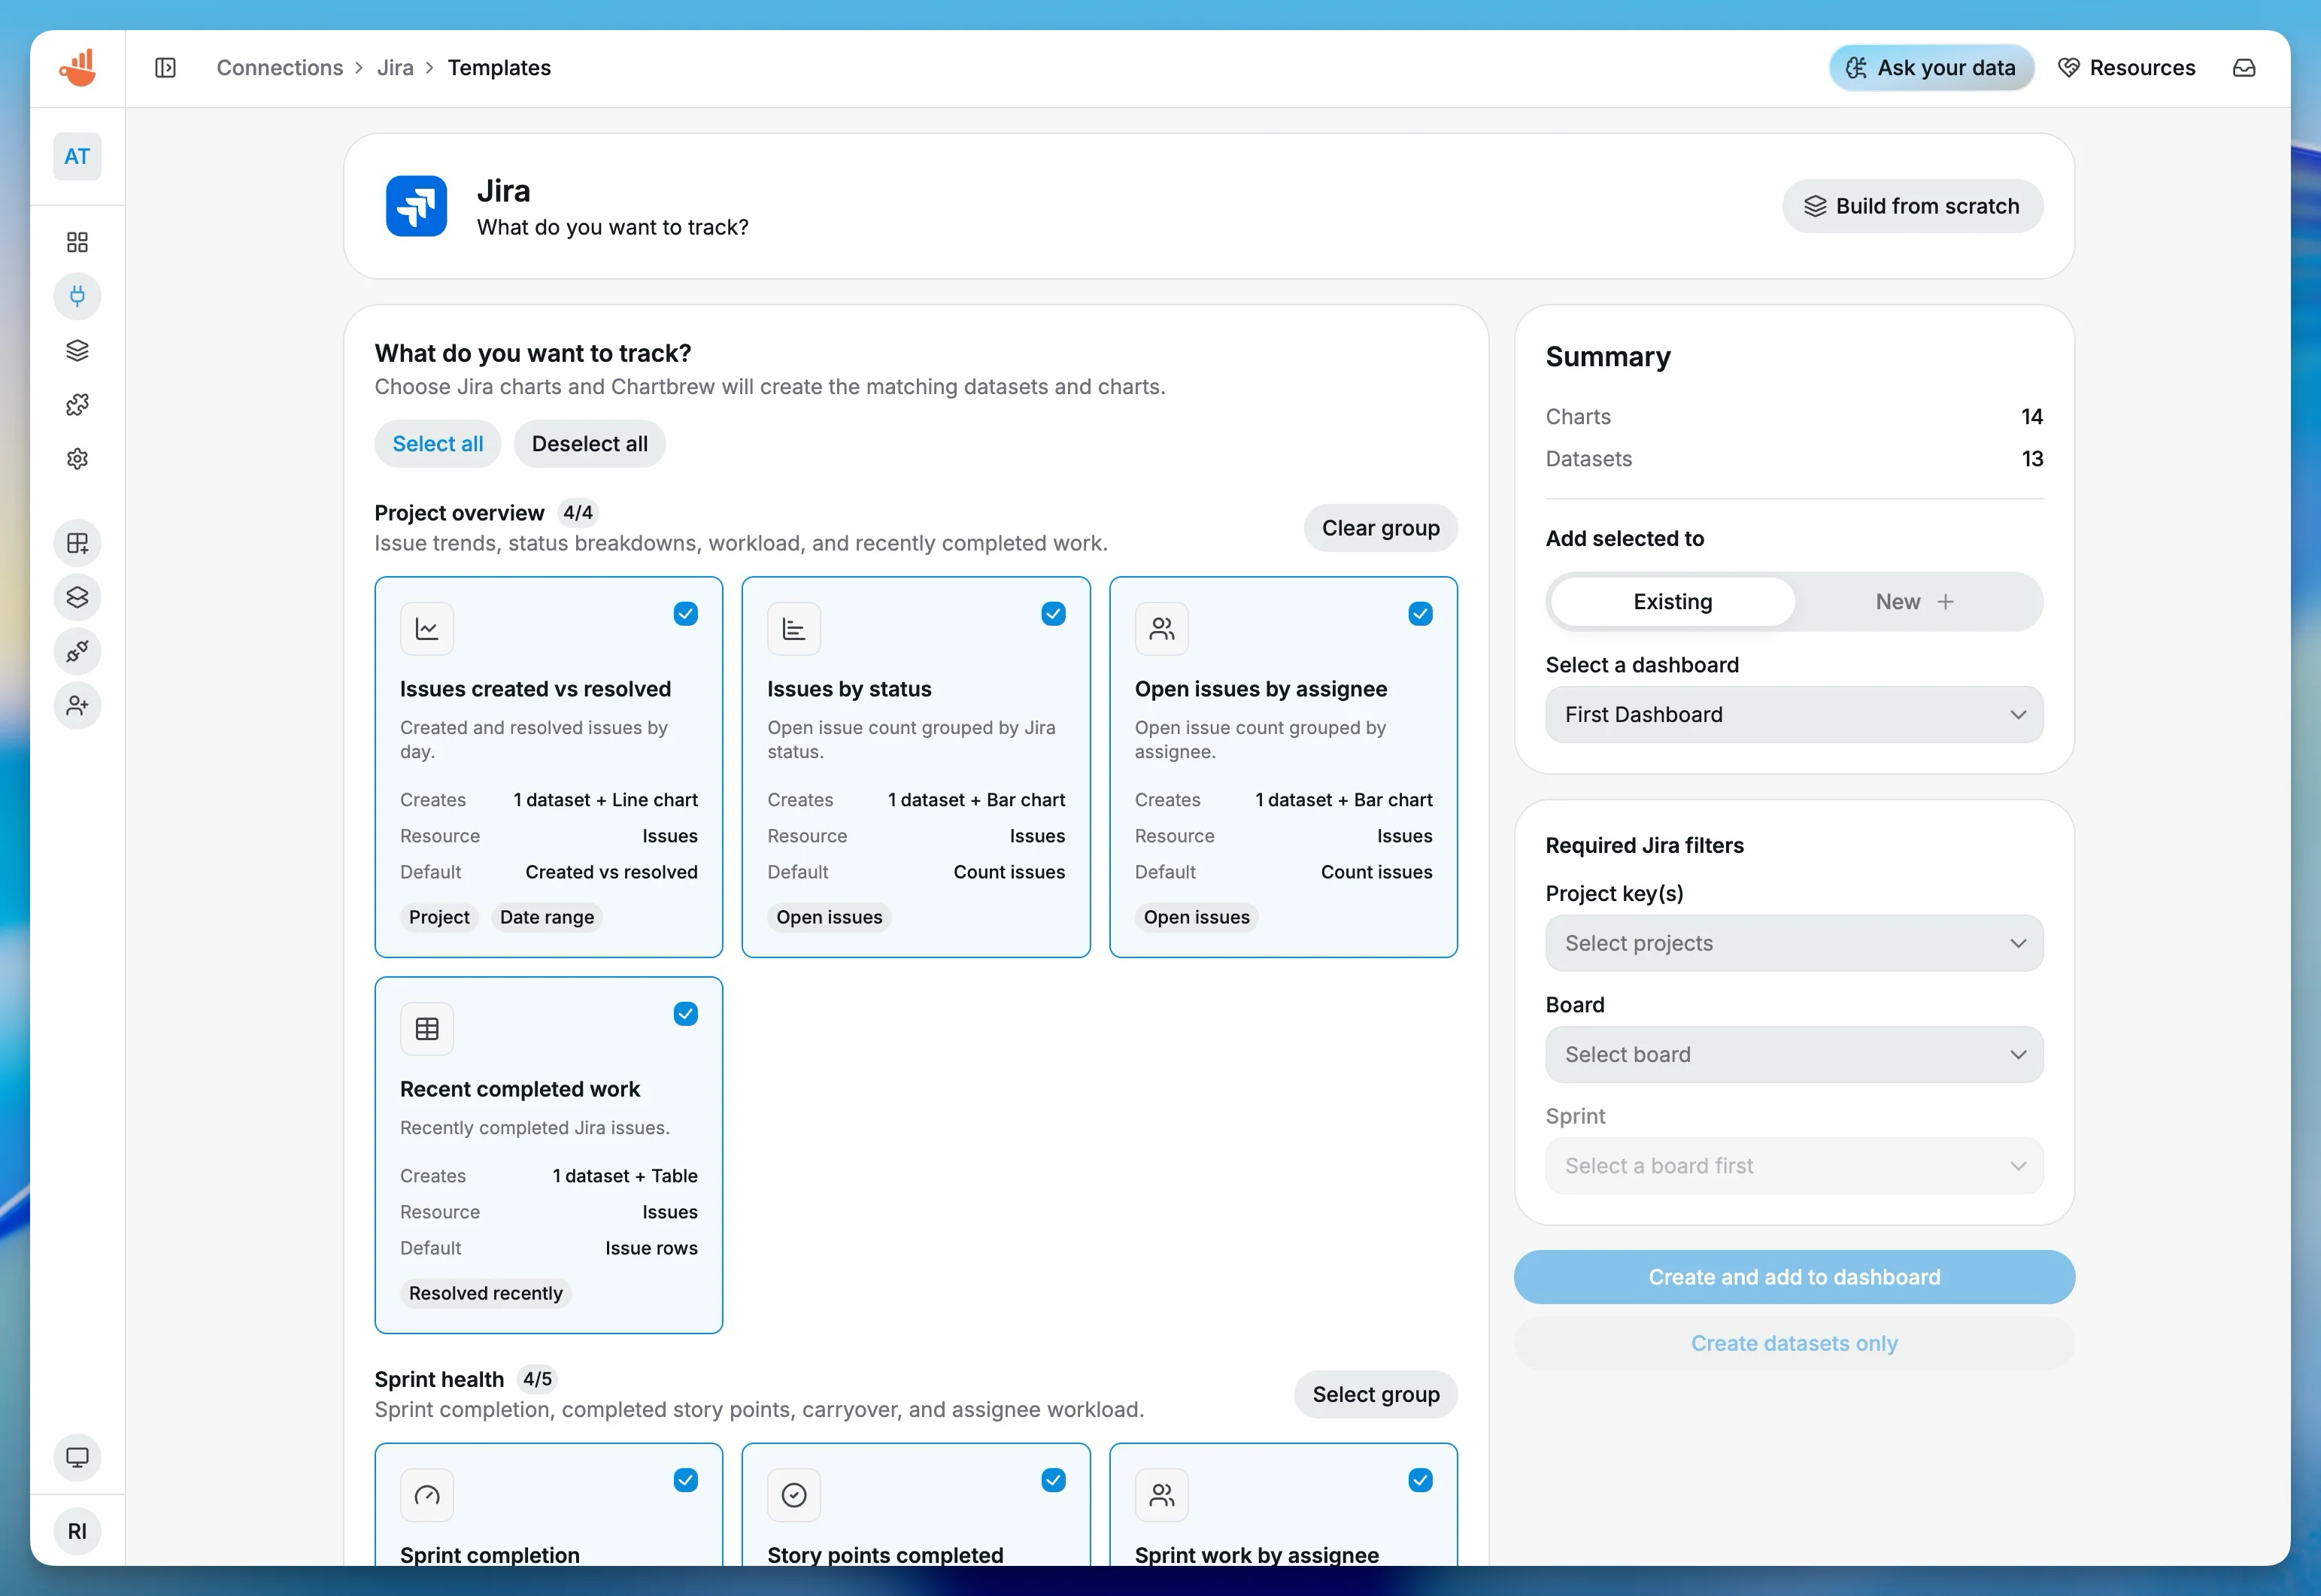
Open the Jira template setup screen from the saved connection. You can create the charts inside an existing Chartbrew dashboard or start a new one, for example Jira Dashboard.
For a general engineering or product view, start with Jira Project Overview. It gives you created vs resolved trends, open work by status, open work by assignee, and recently completed issues. For sprint reviews, use Jira Sprint Health instead. That template focuses on completion, story points, workload, status breakdown, and carryover work.
Some Jira templates need context before Chartbrew can build the charts. A project dashboard needs project keys. A sprint dashboard needs the right board and sprint. Chartbrew loads projects, boards, and sprints from your Jira connection so you can choose them without looking up IDs manually.
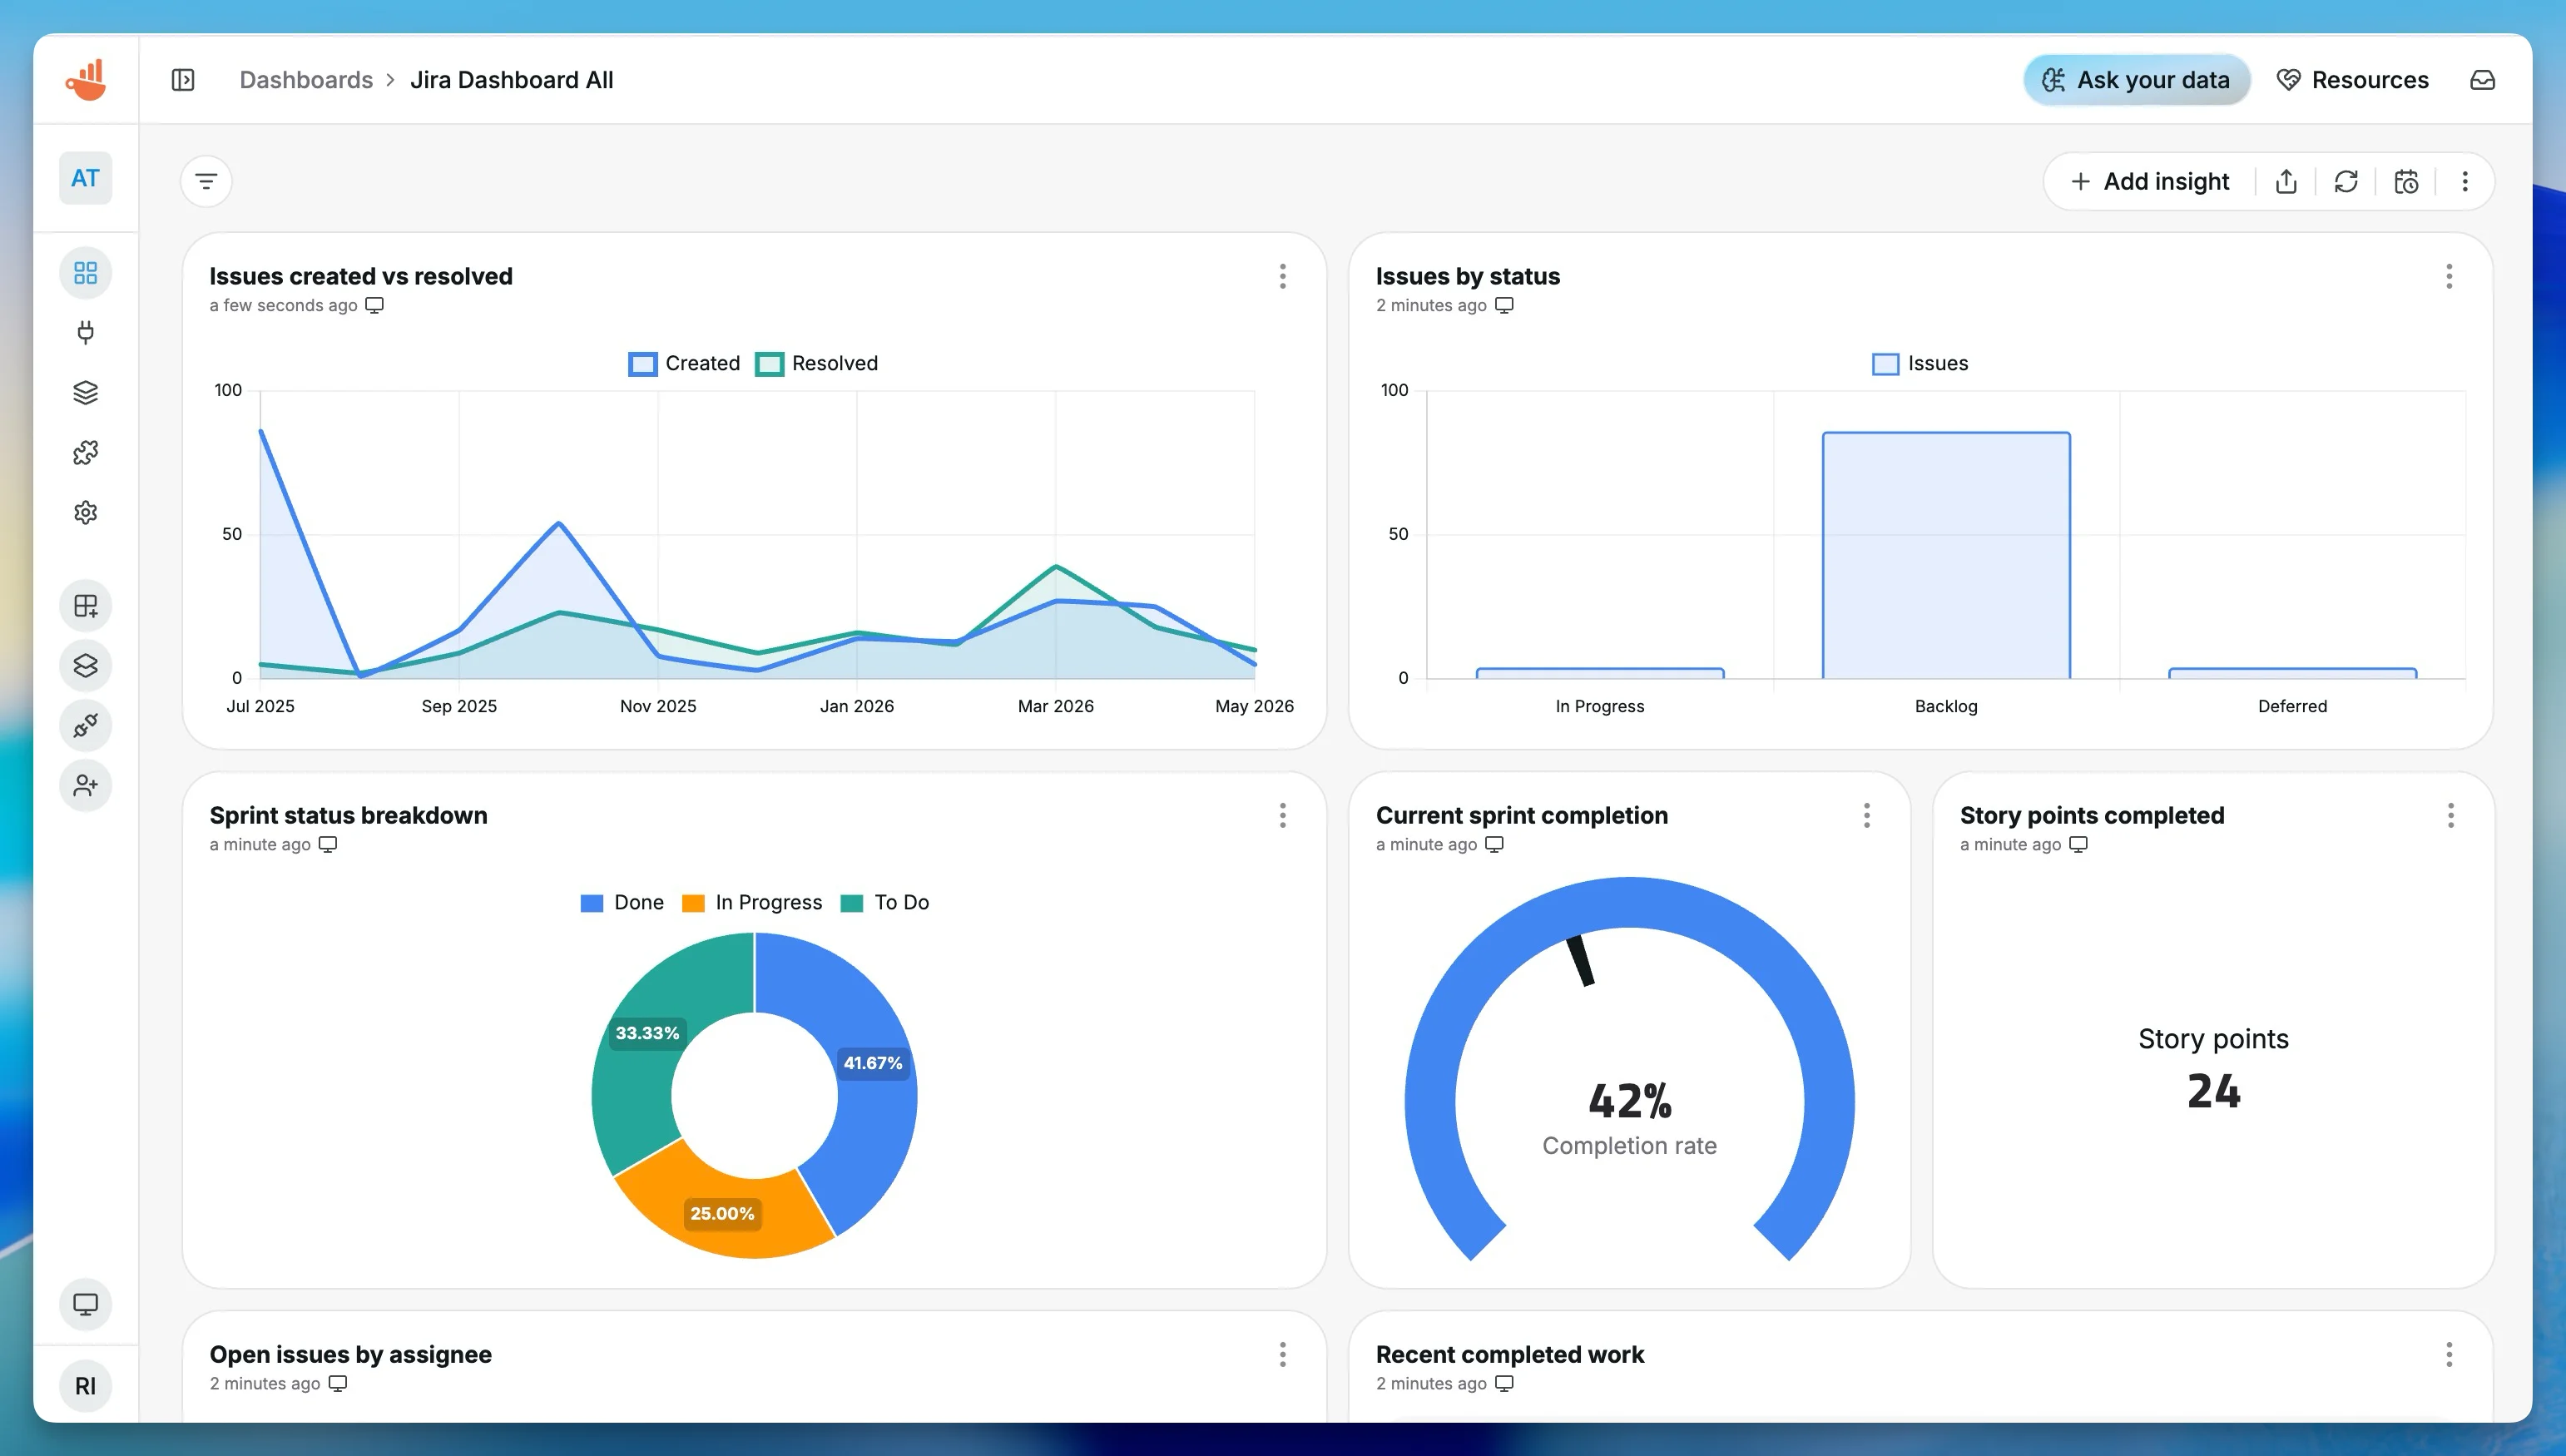
After creating the charts, open the dashboard and check whether the selected project or sprint matches the way your team talks about the work. Jira setups vary a lot from team to team, so this first review matters. If the chart is technically correct but not useful, the fix is usually to adjust the project, board, sprint, status category, or issue type filters.
Build a custom Jira dataset
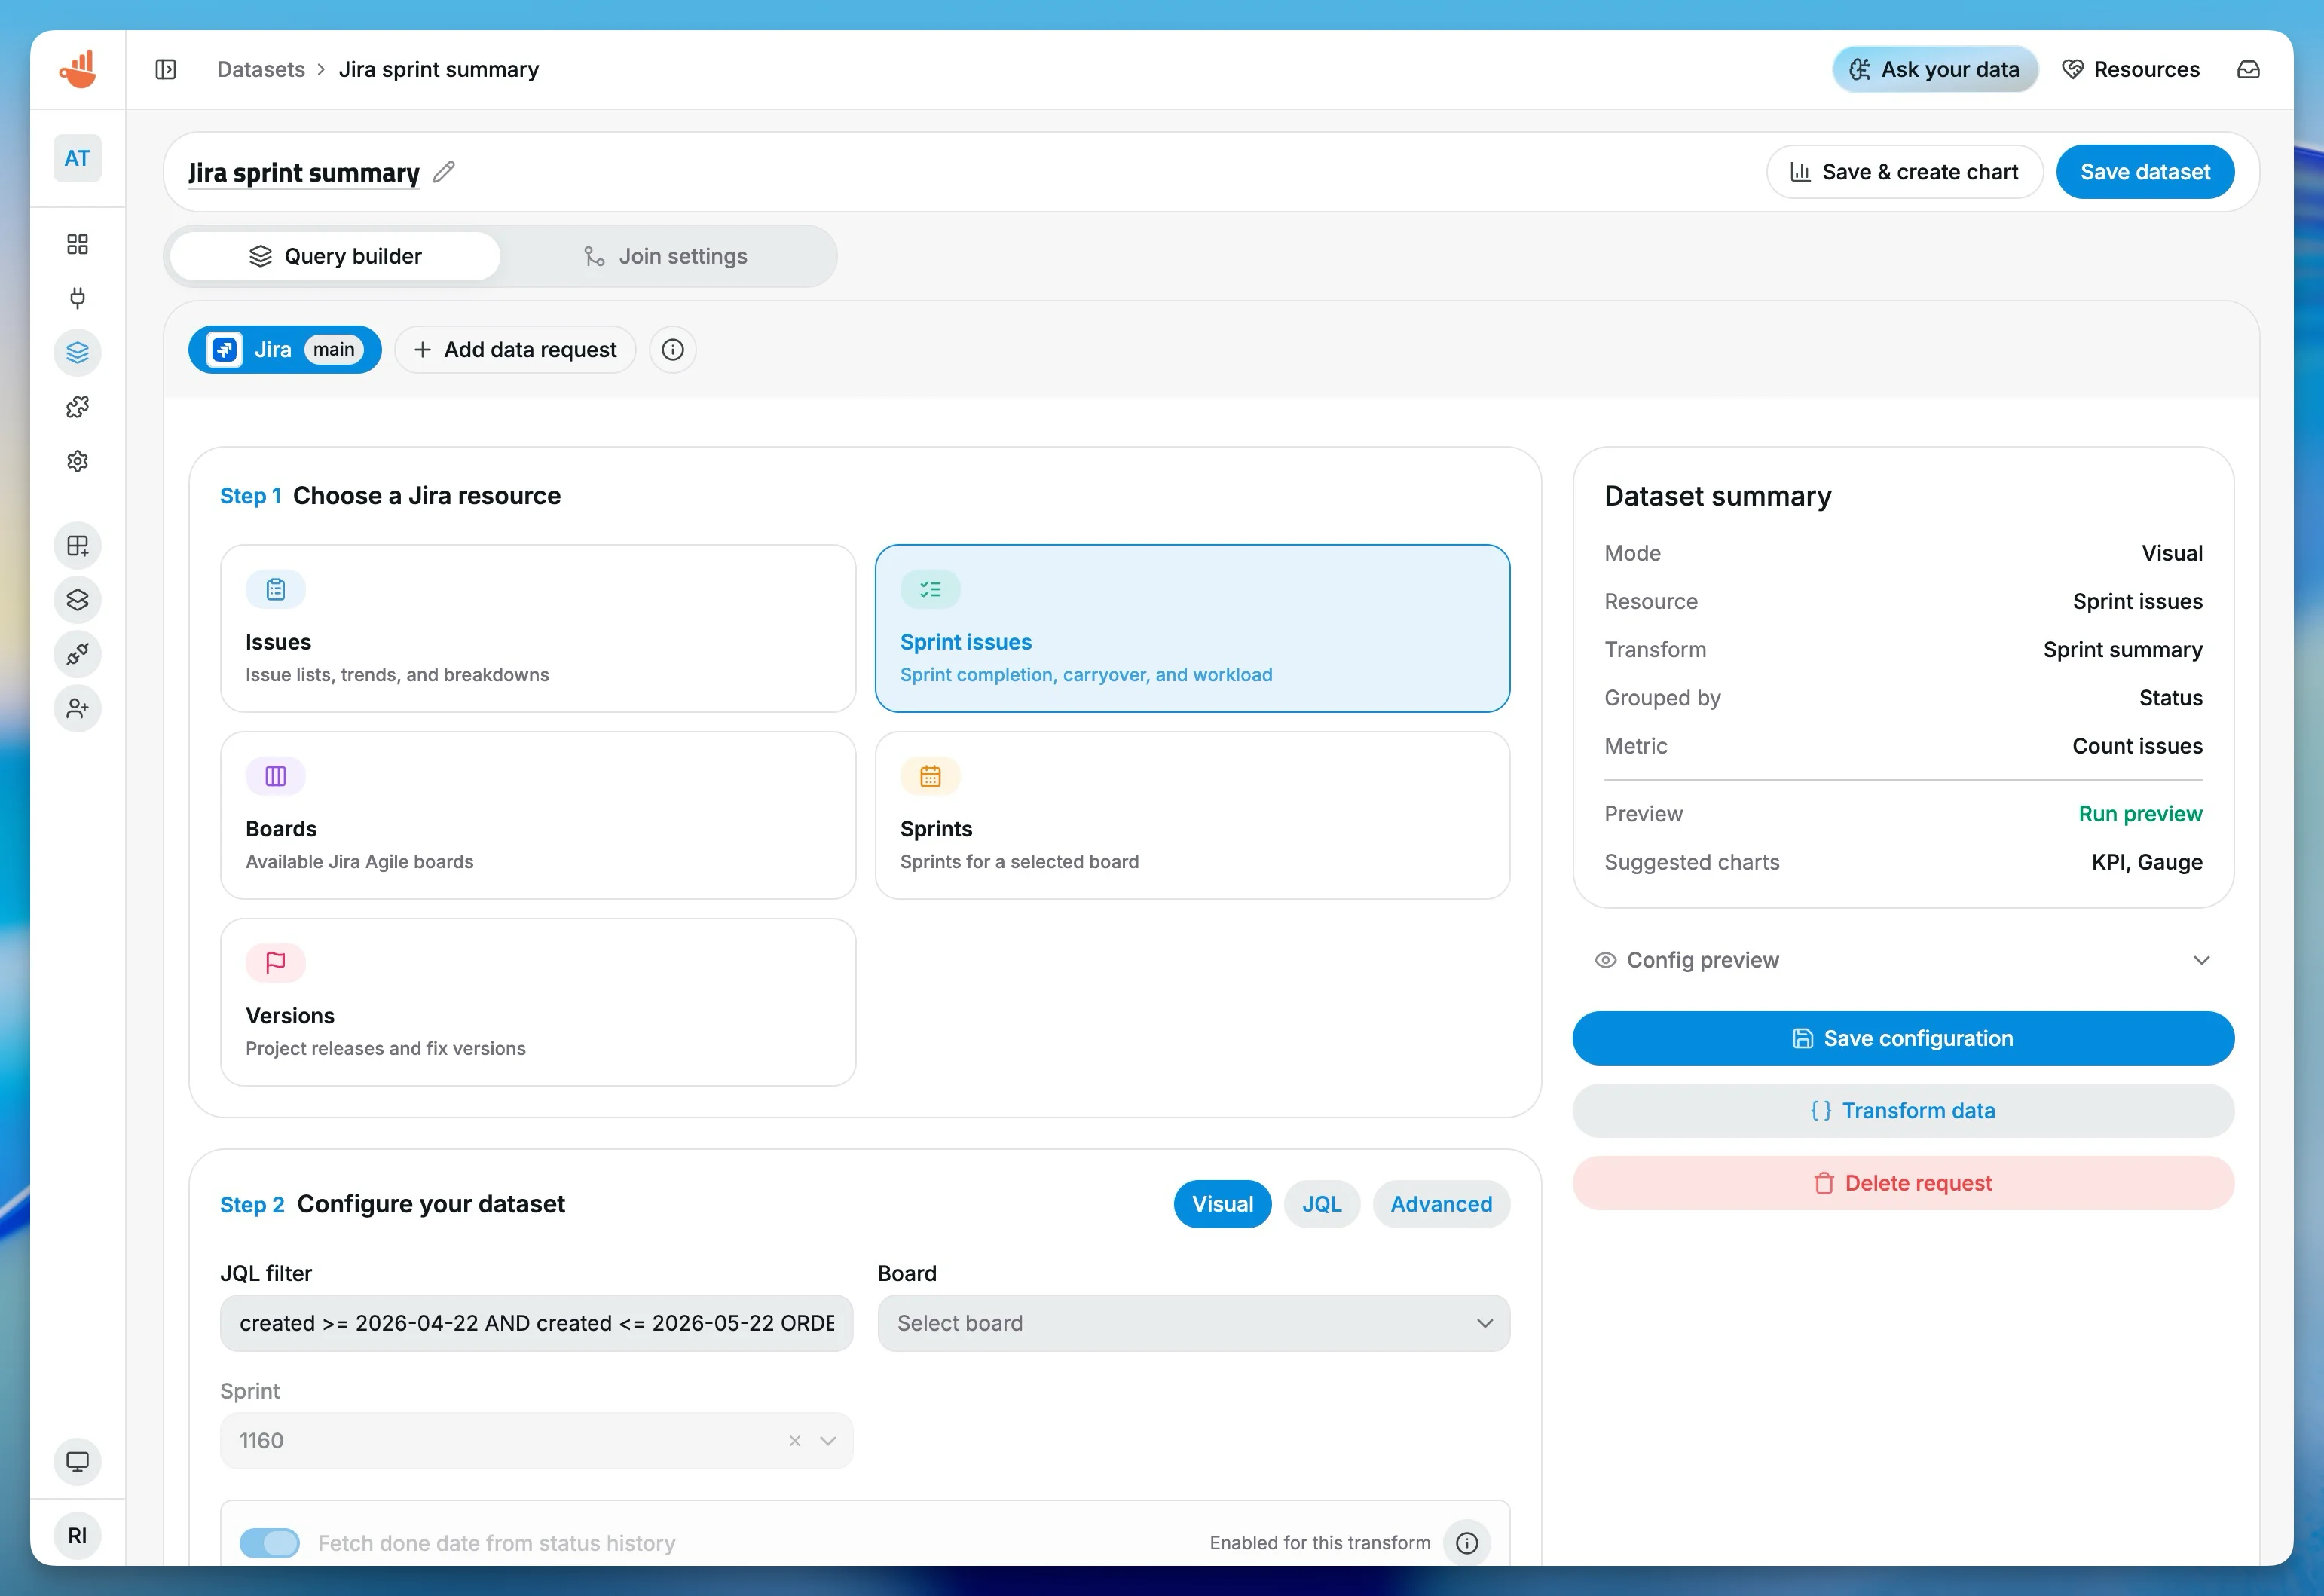
Templates are the fastest way to get started, but you can also build a Jira dataset from the chart editor. The Jira builder supports visual configuration, JQL, and an advanced mode for more specific cases.
Visual mode is the best place to start if you want Chartbrew to handle the query shape. You choose the Jira resource, filters, date range, metric, grouping, and transform. JQL mode is there when you already know the exact Jira Query Language you want. Advanced mode gives you more control when the visual builder does not cover the case.
The Jira source can work with issues, boards, sprints, sprint issues, versions, fields, and users. For issue charts, the most useful dimensions are usually status, status category, assignee, reporter, priority, issue type, project, fix version, label, and date fields.
Make Jira dashboards reusable
Jira dashboards are rarely one-and-done. You might want the same dashboard to work for multiple projects, or the same sprint health view to work across different teams.
This is where variables help. You can use Chartbrew variables for project keys, dates, sprint IDs, status categories, or assignees, then connect those variables to dashboard filters or report URL parameters. That keeps one dashboard flexible instead of forcing you to duplicate the same charts for every team.
If you have not used variables yet, start with the Chartbrew variables tutorial.
Ask Chartbrew AI for Jira charts
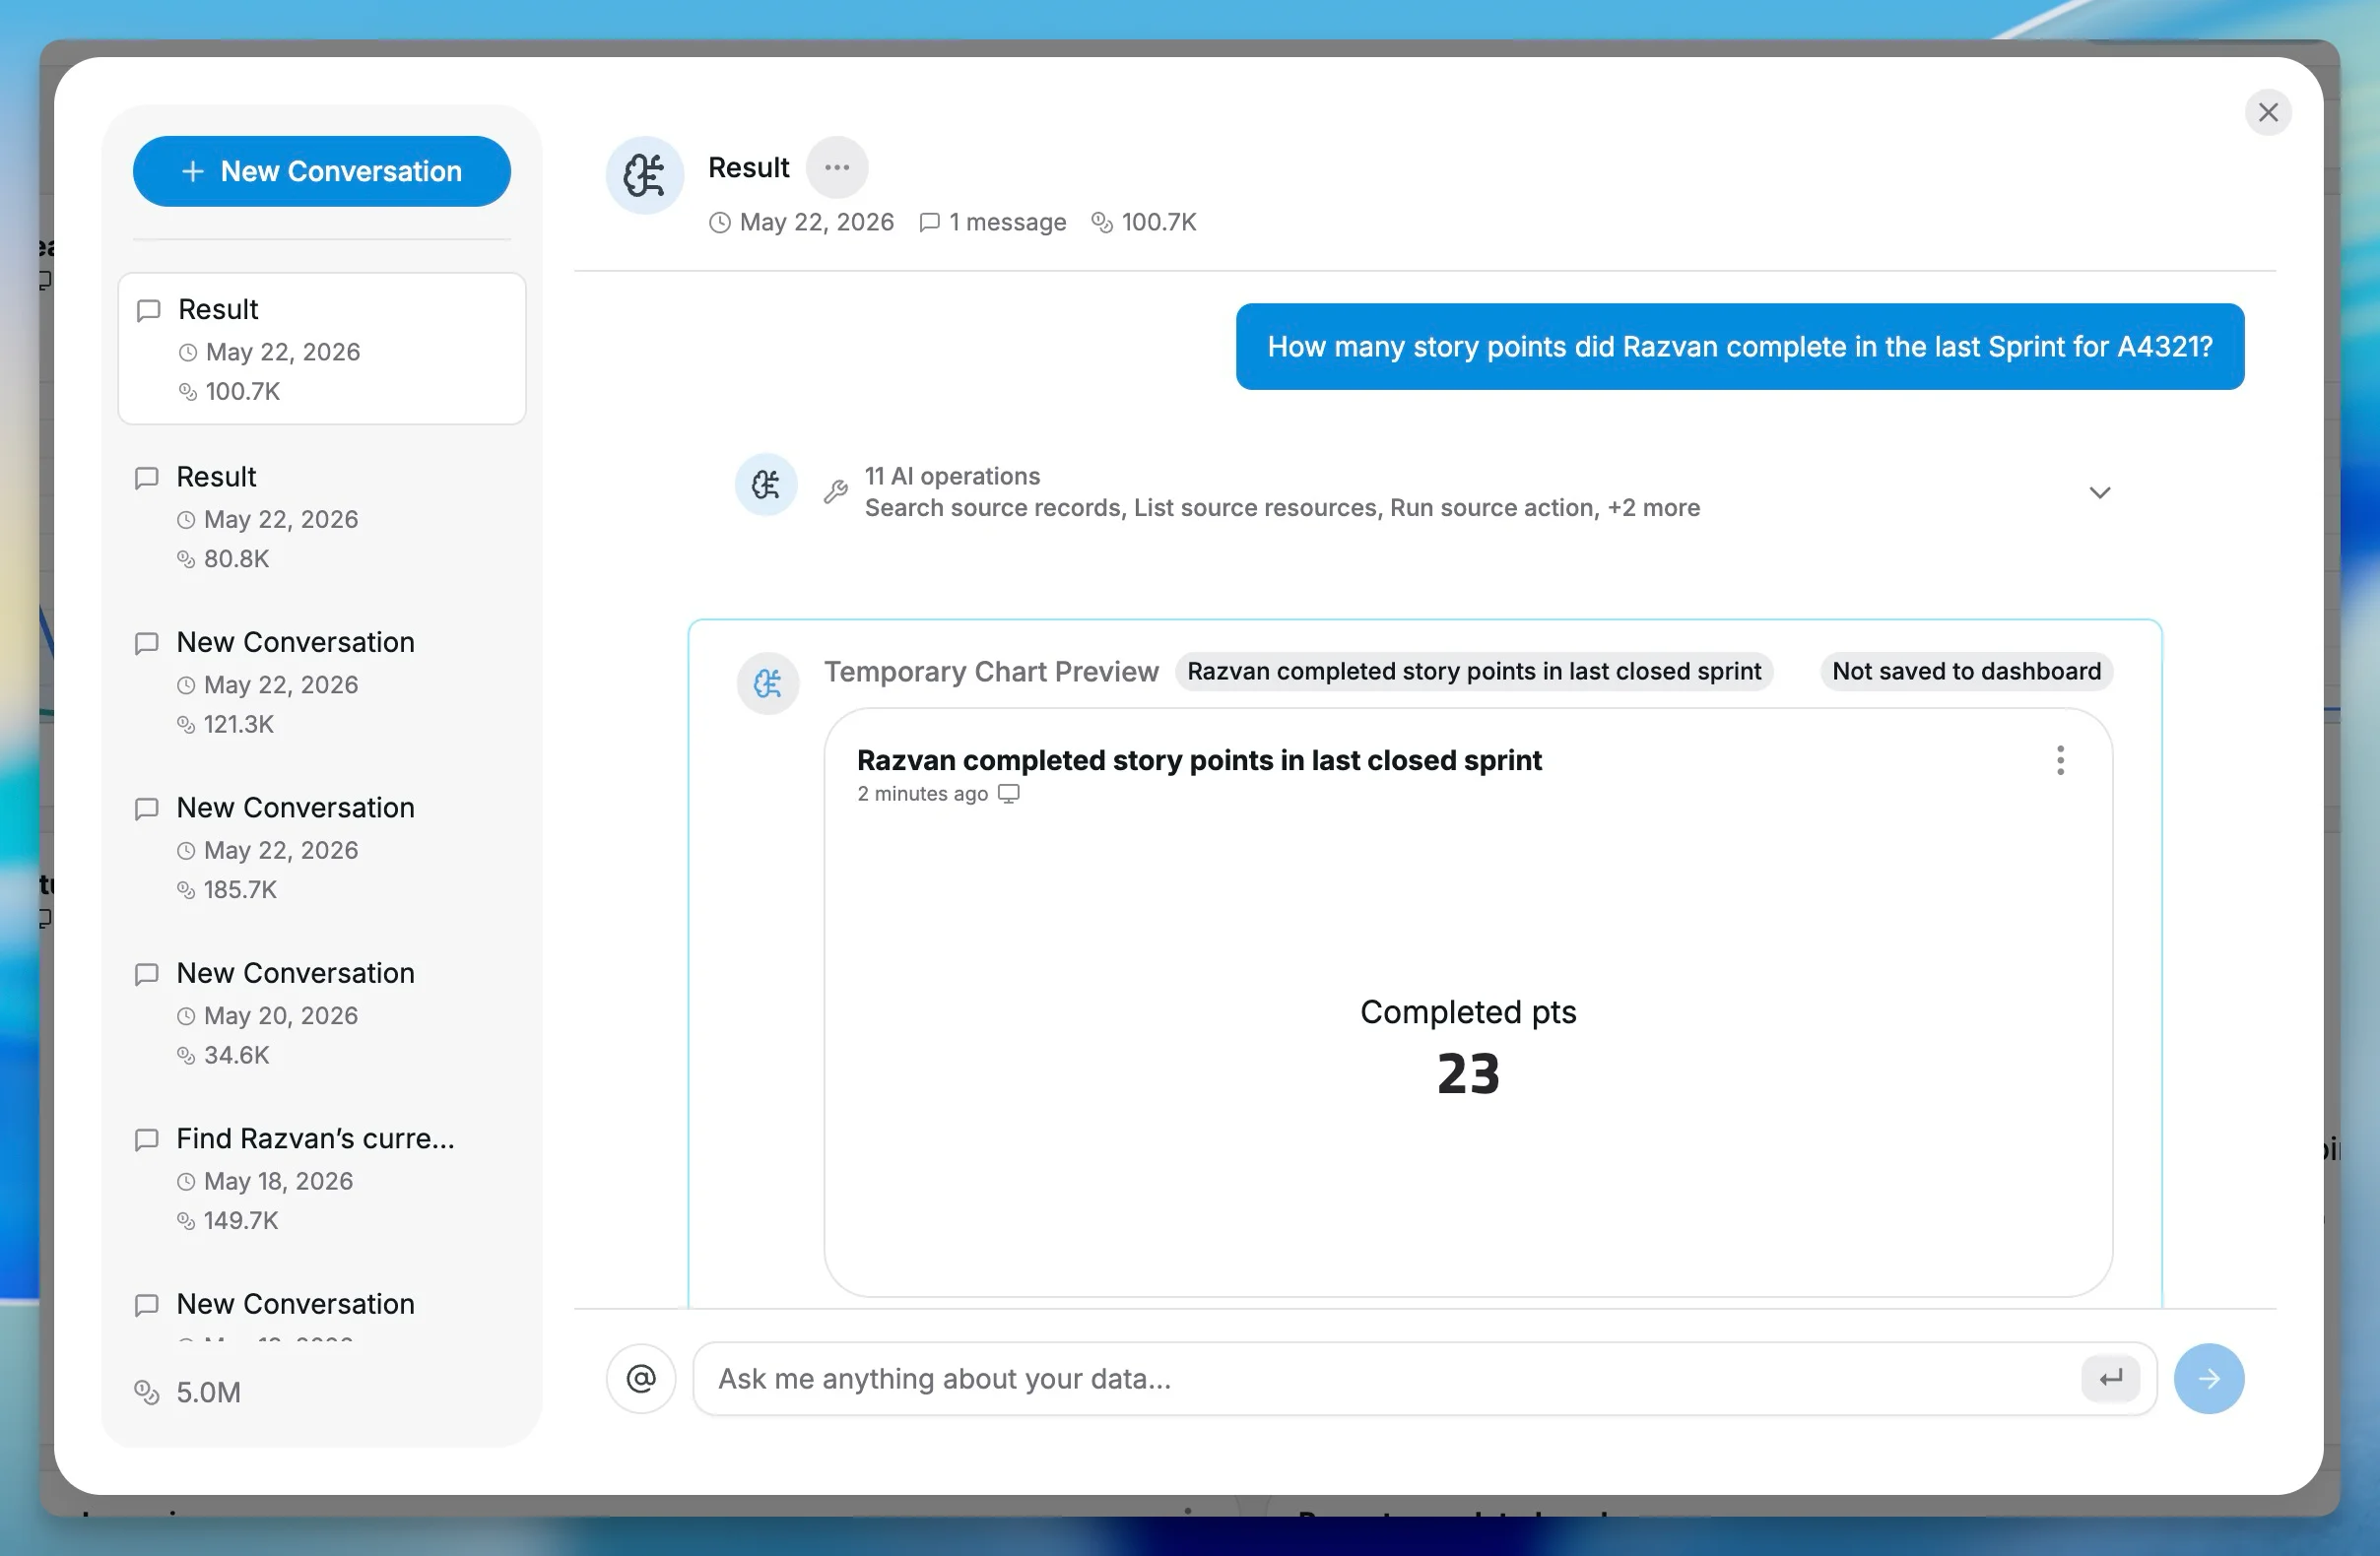
The Jira source also includes source-owned AI planning. In practice, that means Chartbrew AI should plan Jira datasets as Jira configurations, not as generic API calls.
You can ask questions like:
Show me active sprint status for project A4321 in Jira
Create a bug breakdown by priority for the last 90 days
Show open work by assignee for the current sprint
When Jira can resolve the context confidently, Chartbrew can work out details such as the project, board, active sprint, version, user, or field. When the context is ambiguous, it should ask for clarification instead of guessing the wrong sprint or board.
Jira dashboard ideas
These are good starting points before you get into team-specific reporting:
| Dashboard | Useful charts |
|---|---|
| Engineering weekly review | Issues created vs resolved, open issues by assignee, stale issues, recent completed work |
| Sprint review | Sprint completion, story points completed, carryover issues, sprint status breakdown |
| Bug triage | Bugs by priority, bug trend, oldest open bugs |
| Delivery health | Created vs resolved trend, work in progress by assignee, stale issues |
| Product leadership | Project overview, bug trend, completed work, sprint completion |
FAQ
Can Chartbrew connect directly to Jira?
Yes. Chartbrew connects directly to Jira Cloud with your Jira site URL, account email, and API token. It can read Jira issues, boards, sprints, versions, fields, and users for dashboards and reports.
What Jira dashboards can I create in Chartbrew?
You can create Jira project dashboards, sprint dashboards, bug tracking dashboards, and team workload dashboards. Chartbrew includes templates for project overview, sprint health, bug tracking, and team workload.
Does Chartbrew support Jira AI dashboards?
Yes. Chartbrew's Jira source includes source-owned AI planning. You can ask for Jira charts in natural language, and Chartbrew can generate Jira-specific dataset configurations and chart previews.
Do I need to know Jira board IDs or sprint IDs?
Not always. The Jira source can resolve common context such as project, board, and active sprint when Jira returns a confident match. If the context is ambiguous, Chartbrew should ask you to choose the correct value.
Conclusion
The Jira source helps you turn Jira from a place where work is tracked into a live reporting source for Chartbrew dashboards. Start with a project or sprint template, check the context carefully, then customize the dashboard around the way your team reviews work.
For reusable Jira reporting, add variables and dashboard filters. For faster exploration, ask Chartbrew AI for the Jira chart you want and refine the generated dashboard from there.
