

 PostgreSQL integration
Build PostgreSQL dashboards for product, revenue, customer, and operational reporting
Connect PostgreSQL to Chartbrew and turn SQL queries, tables, joins, users, orders, product events, operational records, and customer data into live dashboards.
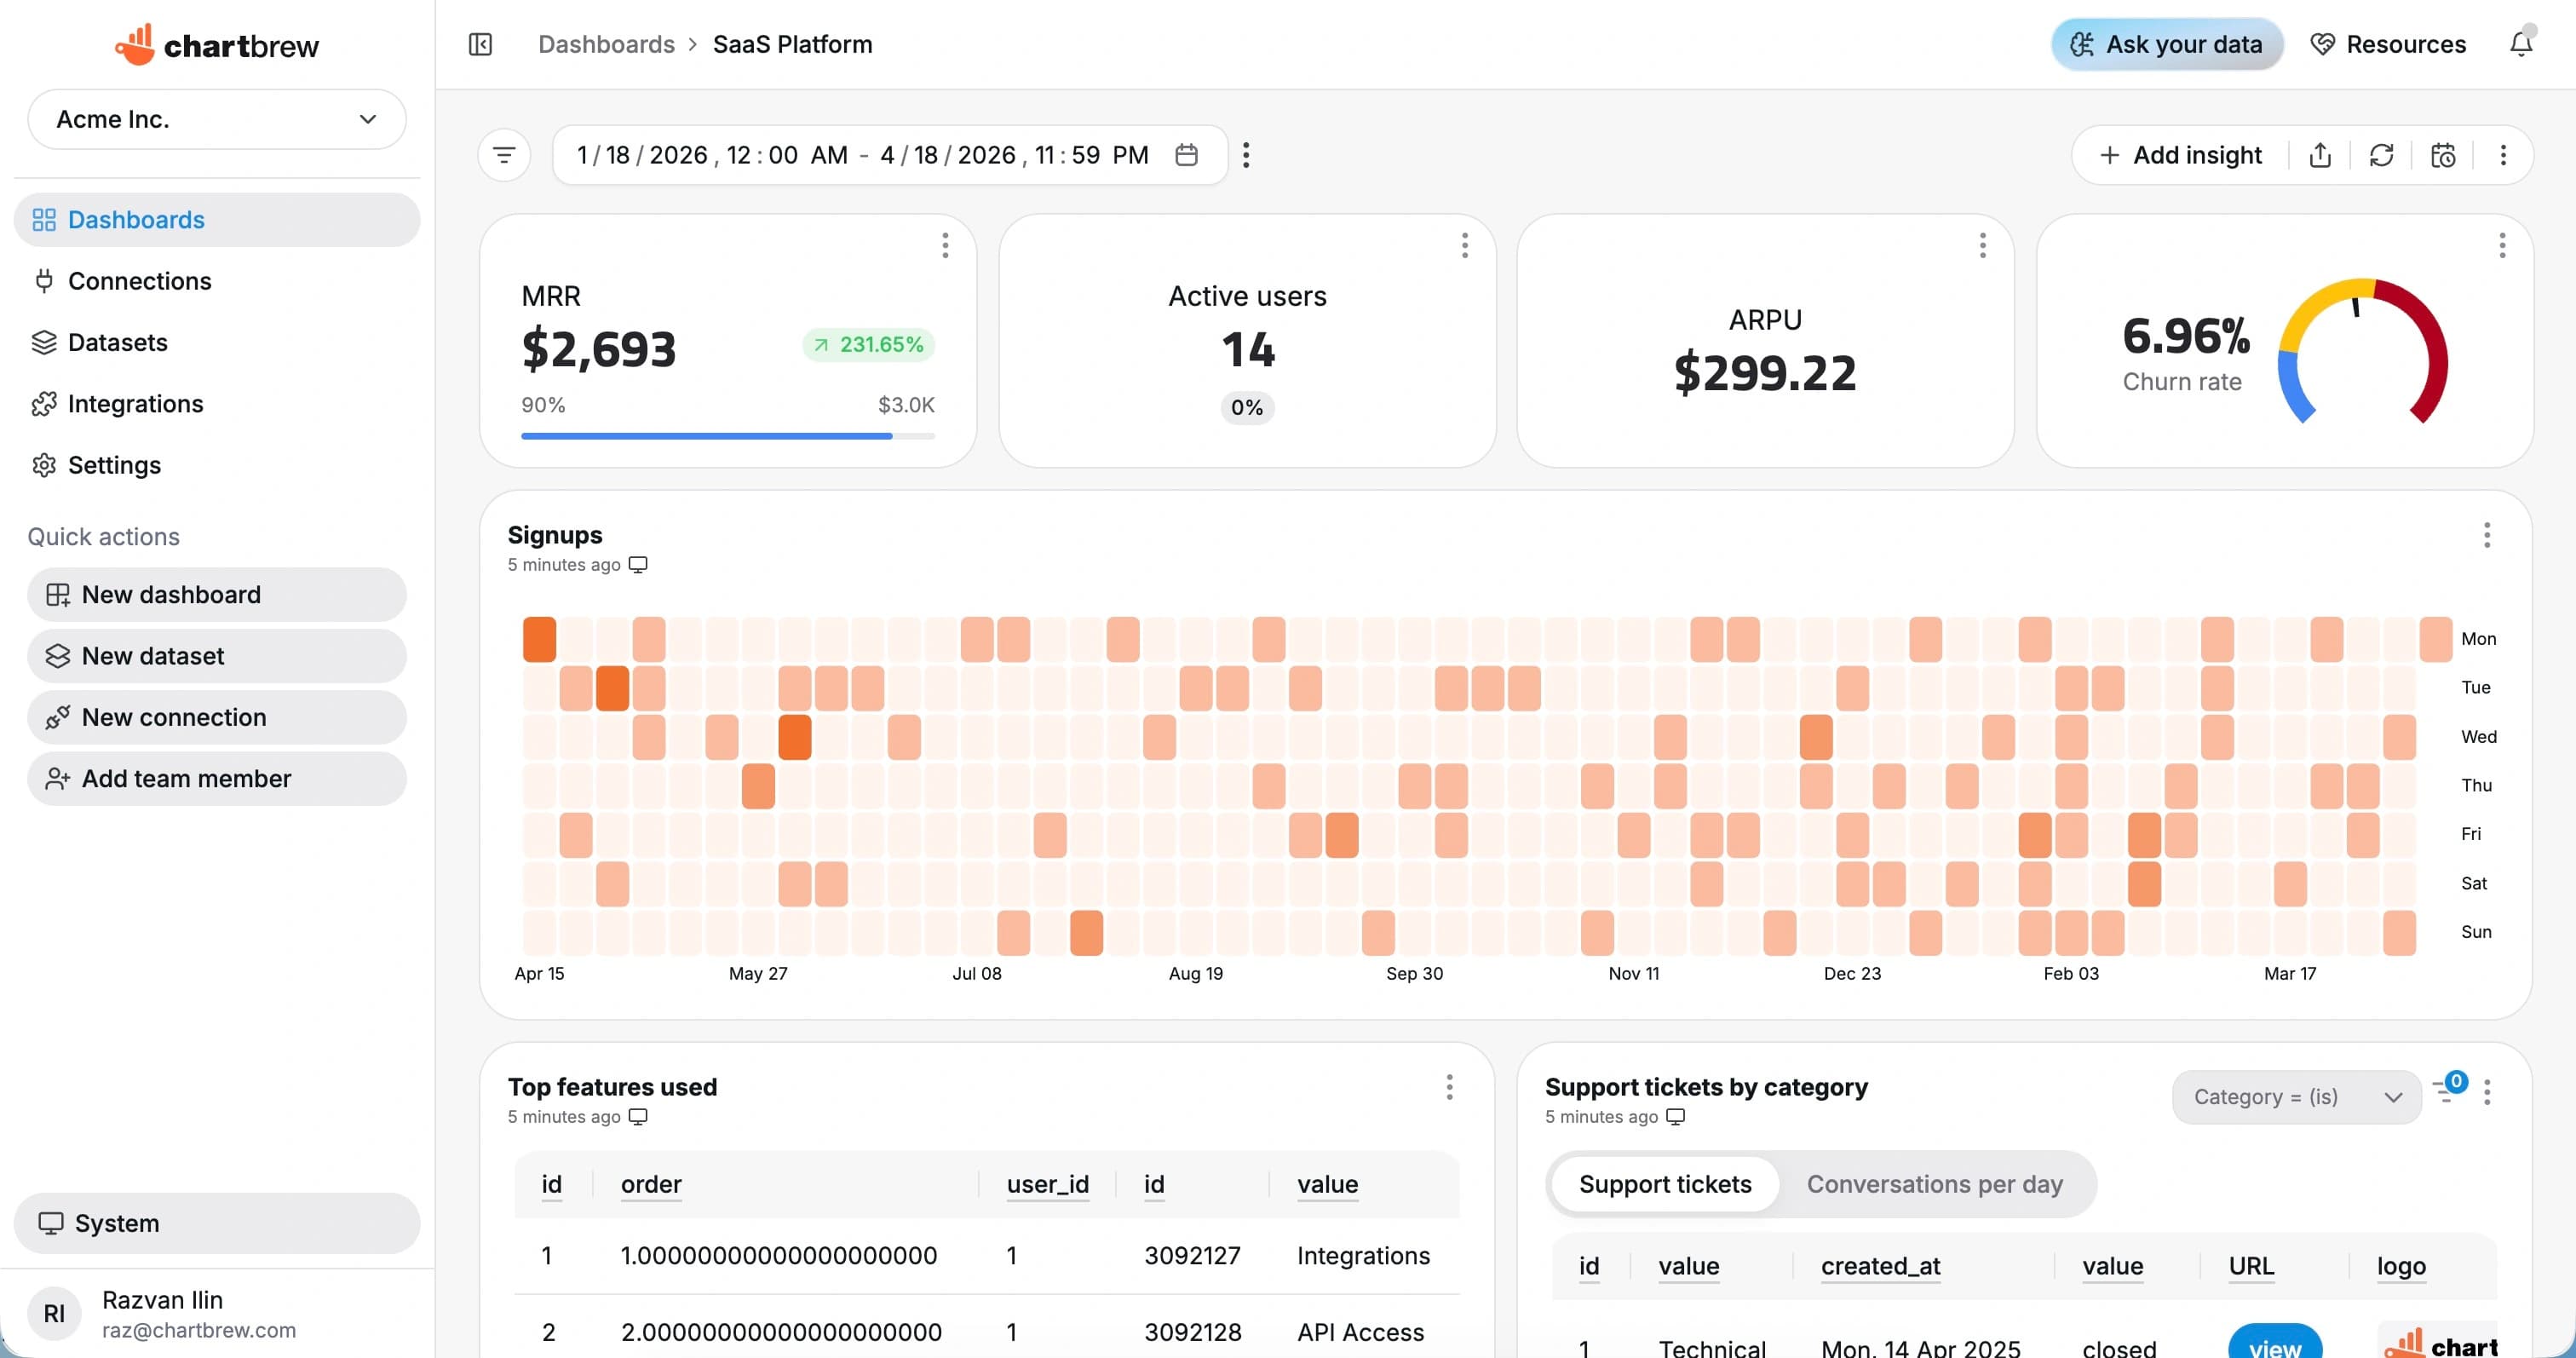
What You Can Track
PostgreSQL metrics for business and product dashboards
Use Chartbrew to visualize the relational data that already powers your product, operations, and customer reporting.
Revenue and orders
Report on paid orders, invoices, refunds, subscriptions, and customer lifetime value.
User growth
Chart signups, activated accounts, teams, workspaces, and retention signals over time.
Product events
Turn audit logs and event tables into usage, adoption, and engagement dashboards.
Operational workflows
Track tickets, jobs, tasks, applications, bookings, or shipments by status.
SQL summaries
Build KPI cards from counts, sums, averages, joins, filters, and calculated fields.
Tenant reporting
Reuse dashboards across clients, organizations, accounts, products, and regions.
How It Works
From PostgreSQL connection to live dashboard
The PostgreSQL workflow is built around a source connection, reusable datasets, scheduled refreshes, and shareable dashboards.
Connect PostgreSQL
Add your PostgreSQL host, database, user, password, and connection options in Chartbrew.
Inspect tables and fields
Use your schema, tables, columns, and joins to decide which reporting datasets should power the dashboard.
Build reusable datasets
Write queries for KPIs, trends, breakdowns, and tables that can be reused across dashboards and clients.
Share live reporting
Publish dashboards, embed charts, and send scheduled snapshots to keep stakeholders aligned.
Why Chartbrew for PostgreSQL
A flexible reporting layer for PostgreSQL
Chartbrew lets teams build live PostgreSQL dashboards with reusable SQL datasets, AI help, scheduled refreshes, snapshots, embeds, and secure sharing.
Native PostgreSQL connection
Use Chartbrew as a reporting layer on top of PostgreSQL without exporting tables into a separate spreadsheet workflow.
Schema-aware reporting
Build datasets from tables, fields, joins, and query results so charts stay grounded in the structure of your data.
AI-assisted queries
Use Chartbrew AI to draft dataset ideas and query starting points when you want to move faster from schema to chart.
Scheduled refreshes
Keep dashboards up to date with automatic refresh schedules for daily, weekly, monthly, or operational reporting.
Secure sharing
Share dashboards, embedded reports, and snapshots without giving every stakeholder direct database access.
Multiple sources together
Place database metrics beside API, analytics, product, customer, payment, and project management data.
Setup Requirements
What you need before connecting PostgreSQL
Start with the right PostgreSQL access, a clear reporting scope, and a few fields that map to useful dashboard metrics.
A PostgreSQL database reachable from Chartbrew
Host, port, database name, user, password, and SSL settings
A read-only database user with access to reporting tables or views
Known tables, joins, or reporting questions for your first dashboard
Date, status, customer, account, numeric, or category fields for useful charts
| Dataset idea | What it can power |
|---|---|
| Daily revenue | Orders, payments, or invoices grouped by day |
| New users | Users, accounts, or organizations created over time |
| Active accounts | Accounts with recent events, orders, sessions, or usage |
| Workflow status | Tickets, jobs, tasks, or records grouped by status |
| Top customers | Customers ranked by revenue, usage, activity, or count |
| Feature adoption | Events grouped by feature, plan, or account |
| Failed jobs | Operational failures, stale records, or overdue tasks |
| Client summary | KPIs filtered by tenant, customer, organization, or workspace |
Setup Guide
Follow the PostgreSQL visualization guide
Use the guide to connect PostgreSQL, write SQL datasets, and create the first Chartbrew dashboard from relational data.
Related Features
Features that make PostgreSQL reporting useful
Use PostgreSQL dashboards with Chartbrew automation, AI workflows, sharing, embeds, filters, and reporting tools.
SQL query builder
Write, test, and reuse SQL datasets for operational charts, tables, filters, and dashboard sections.
AI SQL assistant
Ask Chartbrew to draft SQL queries and chart ideas from your schema when you need a faster starting point.
Data update schedules
Refresh database dashboards automatically so recurring reports stay current without manual exports.
Dashboard snapshots
Send scheduled dashboard snapshots to clients, operators, founders, and internal reporting channels.
Filter variables
Reuse one dashboard across customers, regions, products, statuses, date ranges, and team-specific views.
Embedded reports
Embed live database dashboards into portals, admin panels, client workspaces, or internal tools.
FAQ
PostgreSQL integration questions
Practical details about using PostgreSQL data in Chartbrew dashboards.
Build your PostgreSQL dashboard
Turn PostgreSQL tables into live dashboards without exports
Connect PostgreSQL, create reusable SQL datasets, and share product, revenue, customer, and operational dashboards.
