April 27, 20254 min read
Chartbrew v4 - what's new
Chartbrew v4 is here with scheduled snapshots, smarter dashboard filters, a refreshed design, and major performance upgrades for client reporting.
updates
Tutorials, product updates, and reporting guides for connecting your data to Chartbrew and building clear client-facing dashboards.
Page 2 of 6
Chartbrew v4 is here with scheduled snapshots, smarter dashboard filters, a refreshed design, and major performance upgrades for client reporting.
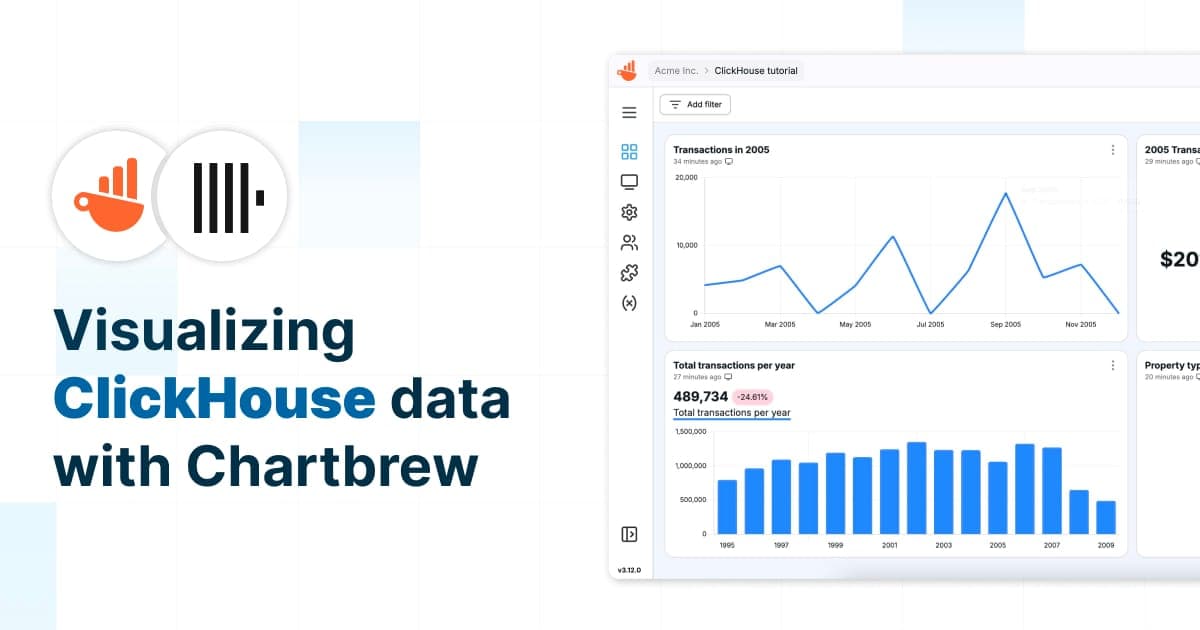
Learn how to connect ClickHouse to Chartbrew, write SQL queries, and build dynamic charts. This guide walks you through setting up a data source, creating datasets, and automating updates for real-time insights.
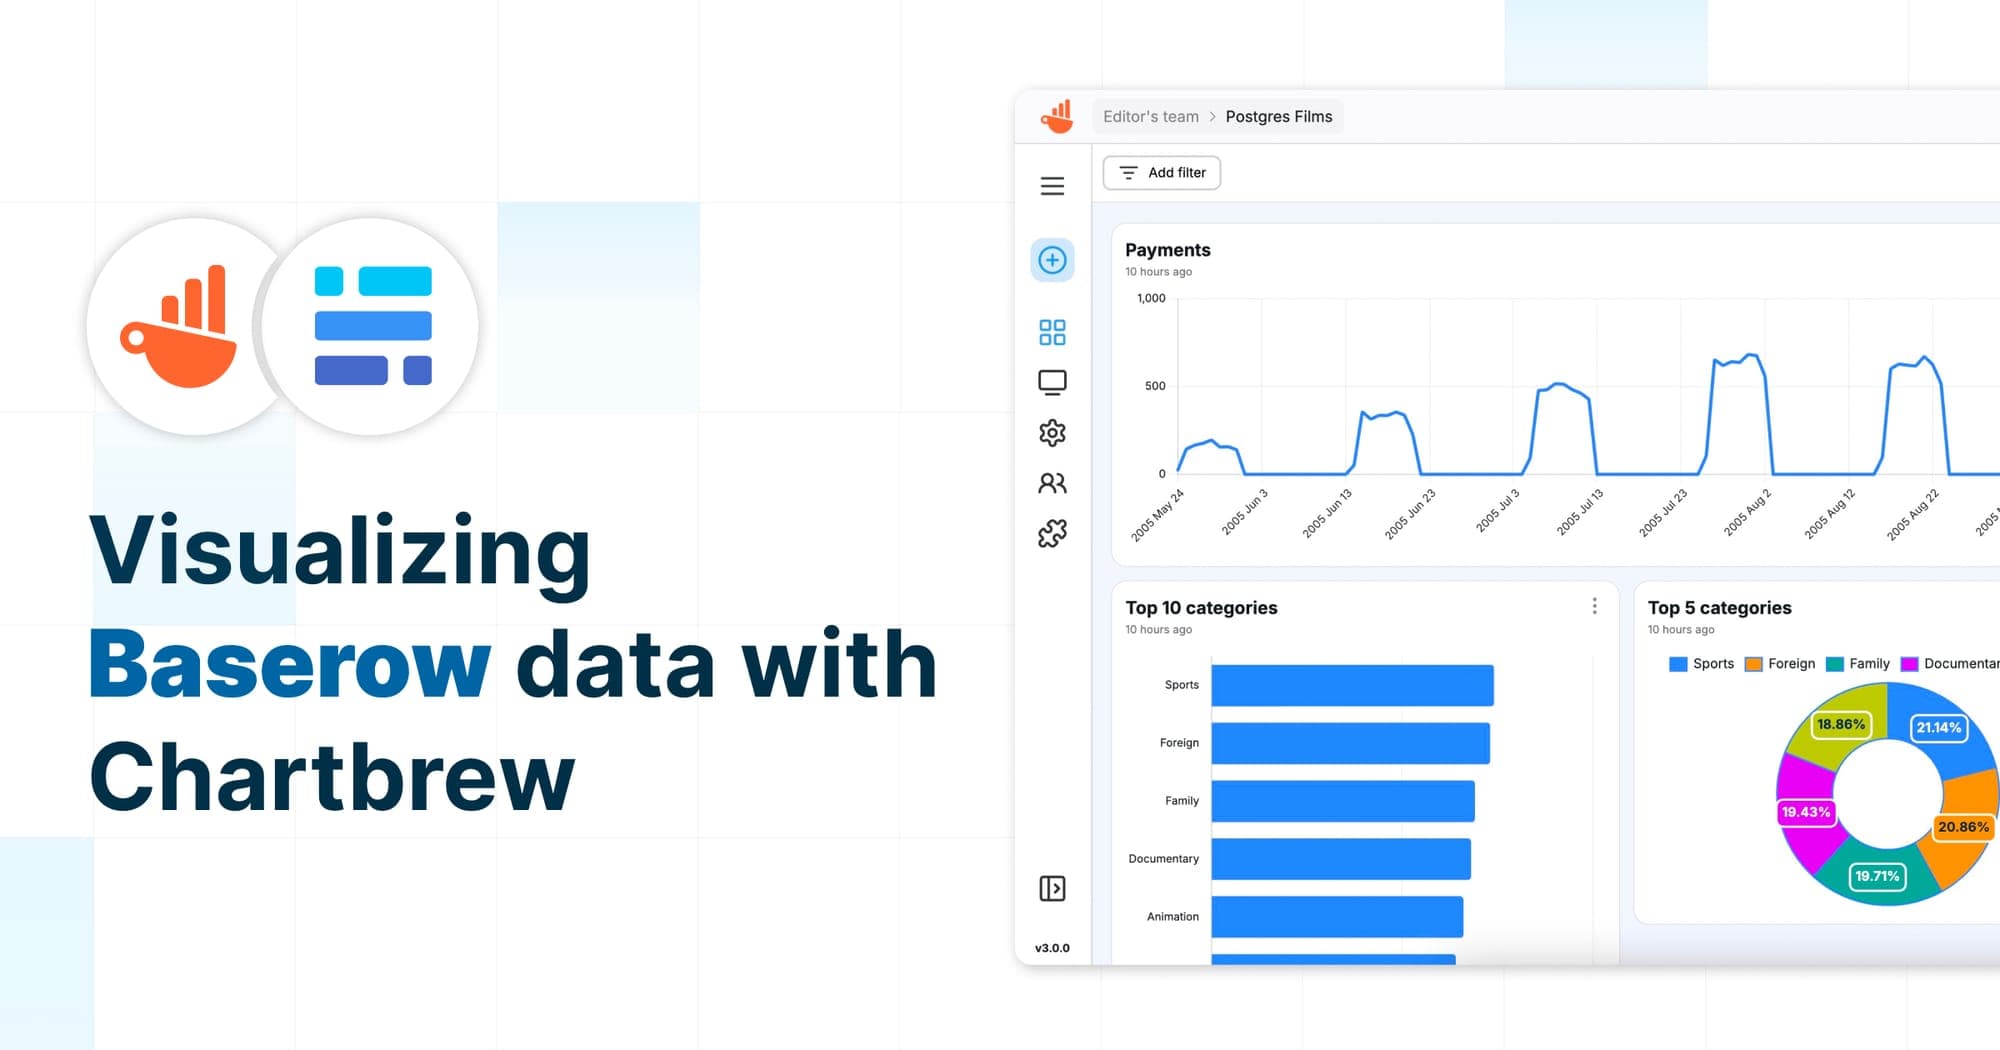
Learn how to visualize Baserow data in Chartbrew with this step-by-step guide. From setting up an API connection to configuring datasets, handling pagination, and creating interactive charts, this tutorial will help you build a Baserow dashboard effortlessly.
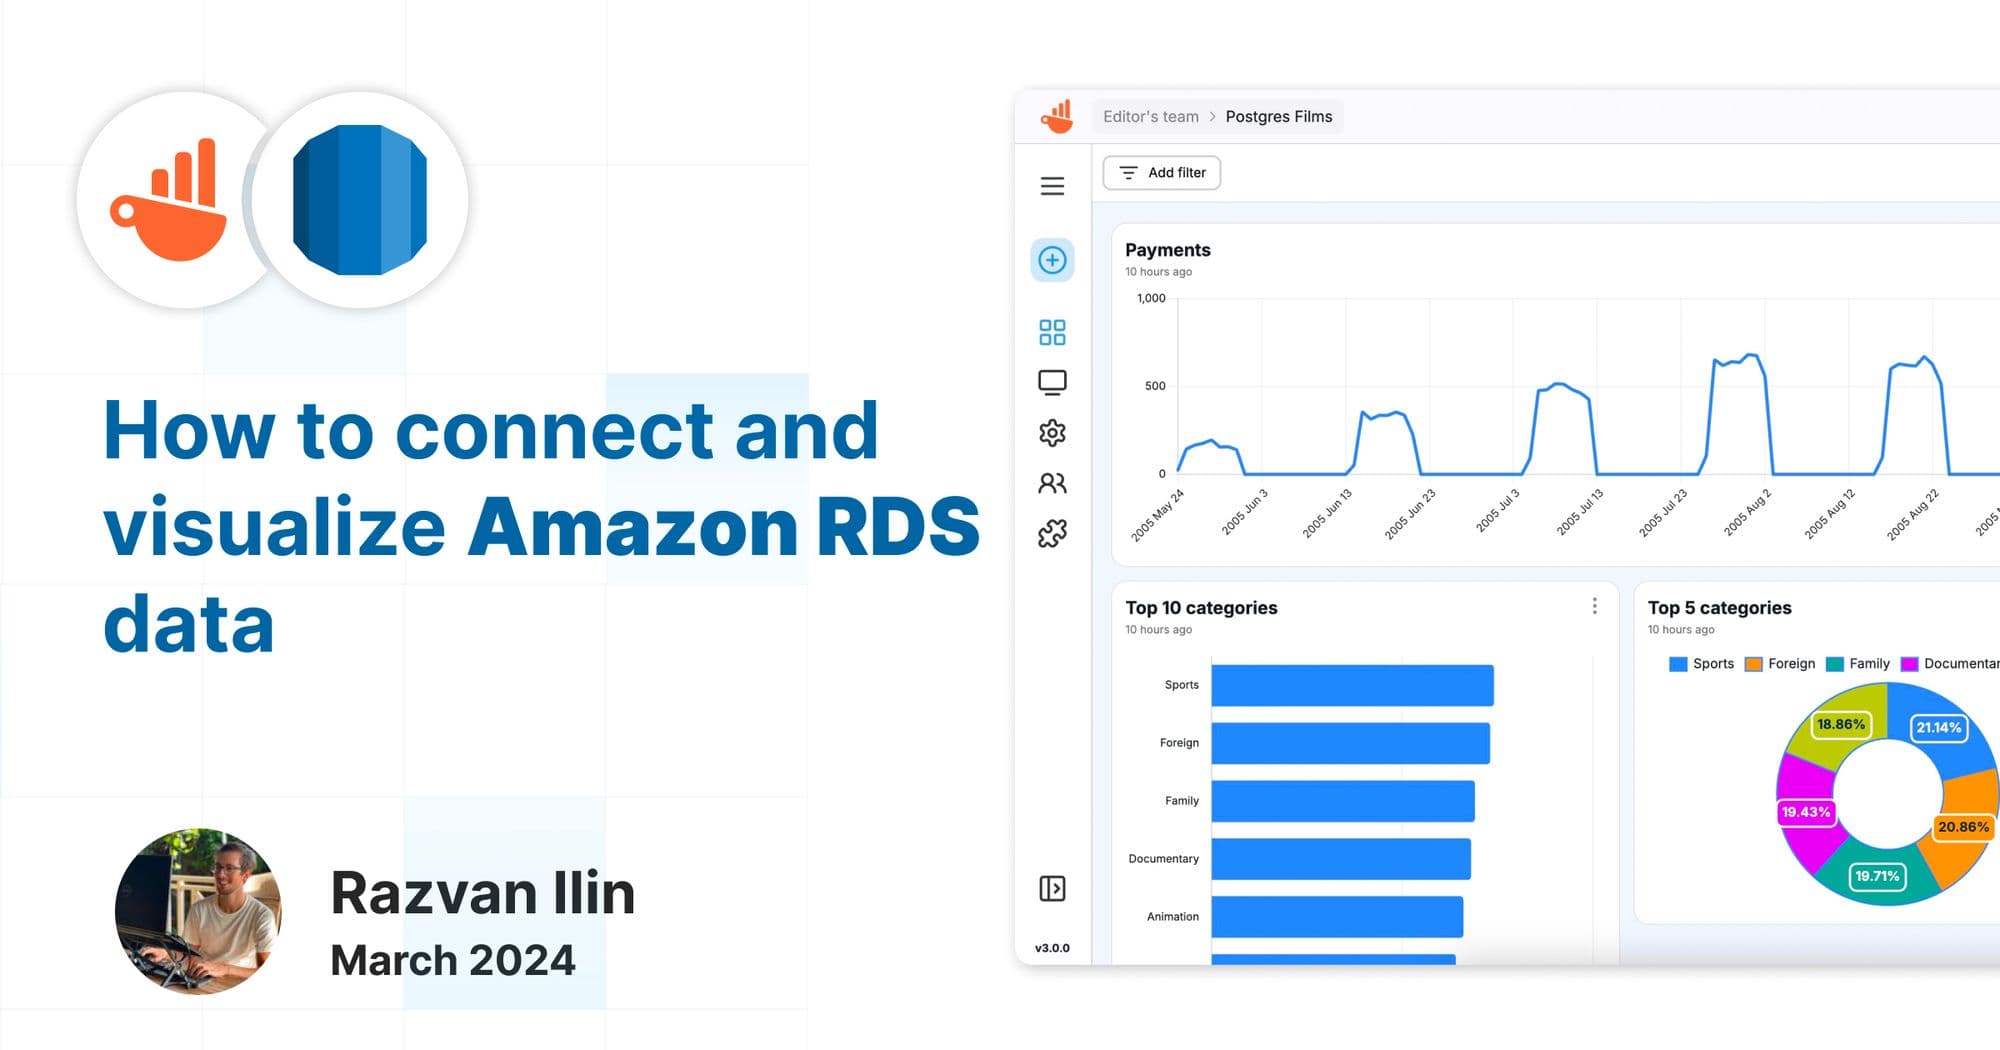
In this tutorial, we'll guide you through the steps to connect your Amazon RDS databases, specifically Postgres and MySQL, with Chartbrew
This tutorial shows you how to connect, query, and visualize your Supabase database with Chartbrew. Create Supabase client reports with ease.
In this tutorial, we are going to connect Heroku Postgres to Chartbrew, fetch some data, and create charts to visualize our data.
In this short tutorial, we will show how you can connect any MySQL database to Chartbrew. Once we connect the database, we are going to write a few simple queries to fetch some data and create datasets to be visualized in multiple ways.
The new Chartbrew v3 is out after 6 months of development. Brand new design, improved UX, faster chart building, and many more updates.
Ready to start
Connect your data, build live dashboards, and give your team one place to check the numbers that matter.
