Book a demo
See Chartbrew in action
Book a live walkthrough with Raz, the founder, and see how Chartbrew can turn your databases, APIs, and product data into dashboards your team and clients can actually use.






Customer story
“Chartbrew has helped us move away from having to constantly update clunky Google-based charts, but what most impresses me is the responsiveness and the helpfulness of the people behind Chartbrew.”

Schuyler
Full-stack developer, Fairchain
What we can explore
Bring your reporting questions. We will shape the demo around them.
Every team's data setup is different, so the call is flexible. We can walk through the parts of Chartbrew that matter most to you, from connecting sources to sharing dashboards with your team or clients.
Connecting your data
Databases, APIs, analytics tools, and how your current sources fit into Chartbrew.
Building useful dashboards
Charts, KPI cards, filters, datasets, and dashboard layouts for your team's workflow.
Sharing reports
Client access, embeds, public links, scheduled snapshots, and internal reporting flows.
Choosing the right setup
Hosted vs. self-hosted, permissions, refresh schedules, and what makes sense for your team.
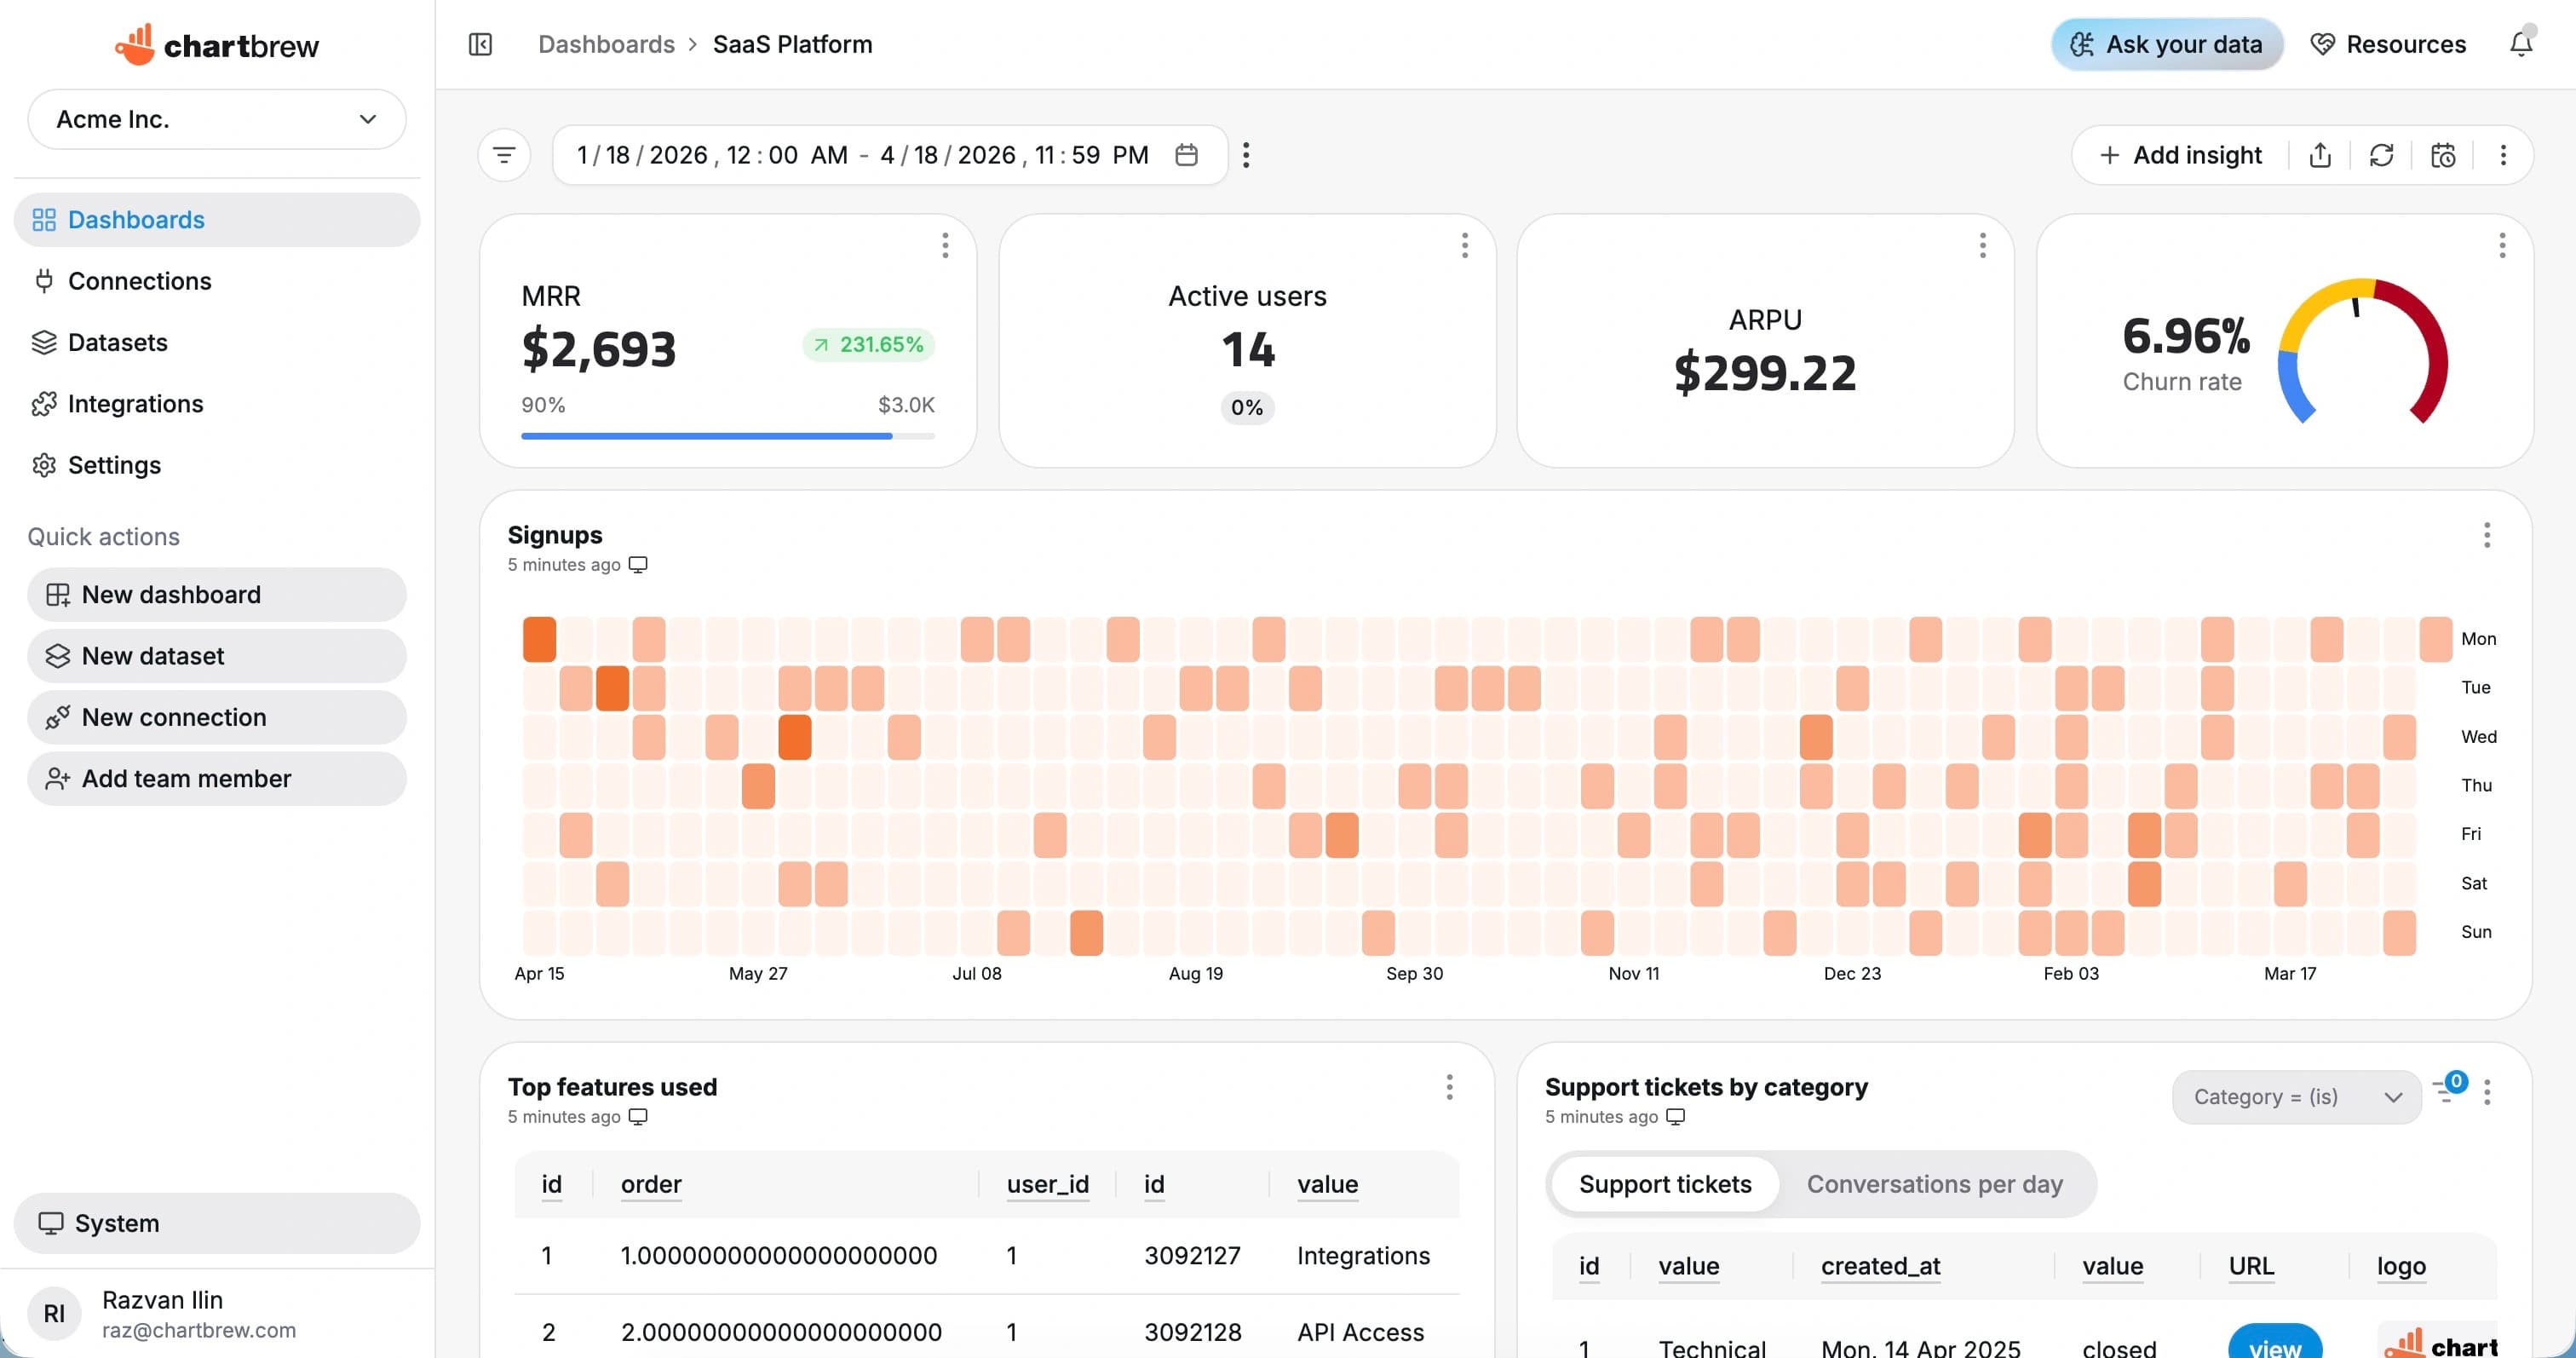
Why teams choose Chartbrew
Chartbrew is for teams that need useful dashboards without BI sprawl.
- Live dashboards from your own databases and APIs
- Client-ready reporting without rebuilding the same charts
- Open source option when you need full control
- Automated snapshots, alerts, embeds, and share controls
Ready to start
Start tracking your KPIs with Chartbrew
Connect your data, build live dashboards, and give your team one place to check the numbers that matter.
