
In this tutorial, we'll walk you through connecting Chartbrew to a ClickHouse database and creating dynamic data visualizations.
Get the connection details from ClickHouse
Before connecting Chartbrew to ClickHouse, you need to gather the necessary connection details. If you're self-hosting ClickHouse, ensure you have:
- Host Address: The IP or domain where ClickHouse is hosted
- Port Number: Usually
8443for HTTPS connections - Database Name: The specific database you want to connect to
- Username & Password: Your ClickHouse credentials
If you're using ClickHouse Cloud, these details can be found in your service's connection settings. Access your database and click on the Connect button.
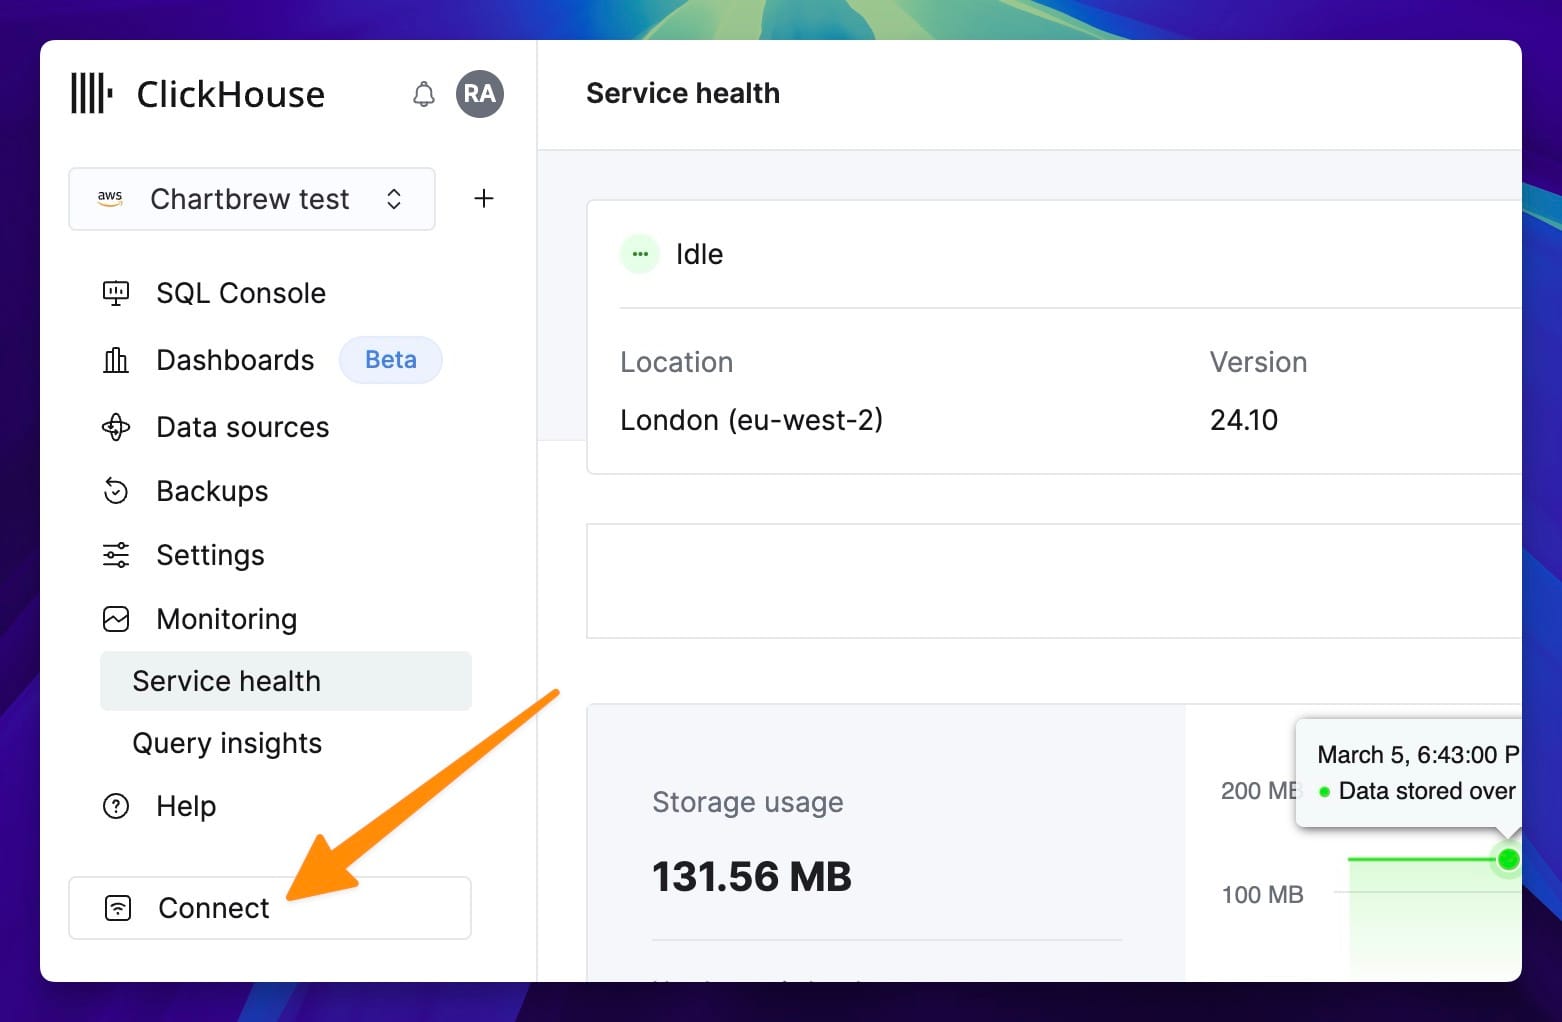
A new window will pop up, and it will display most of the information we need to connect Chartbrew to the ClickHouse database.
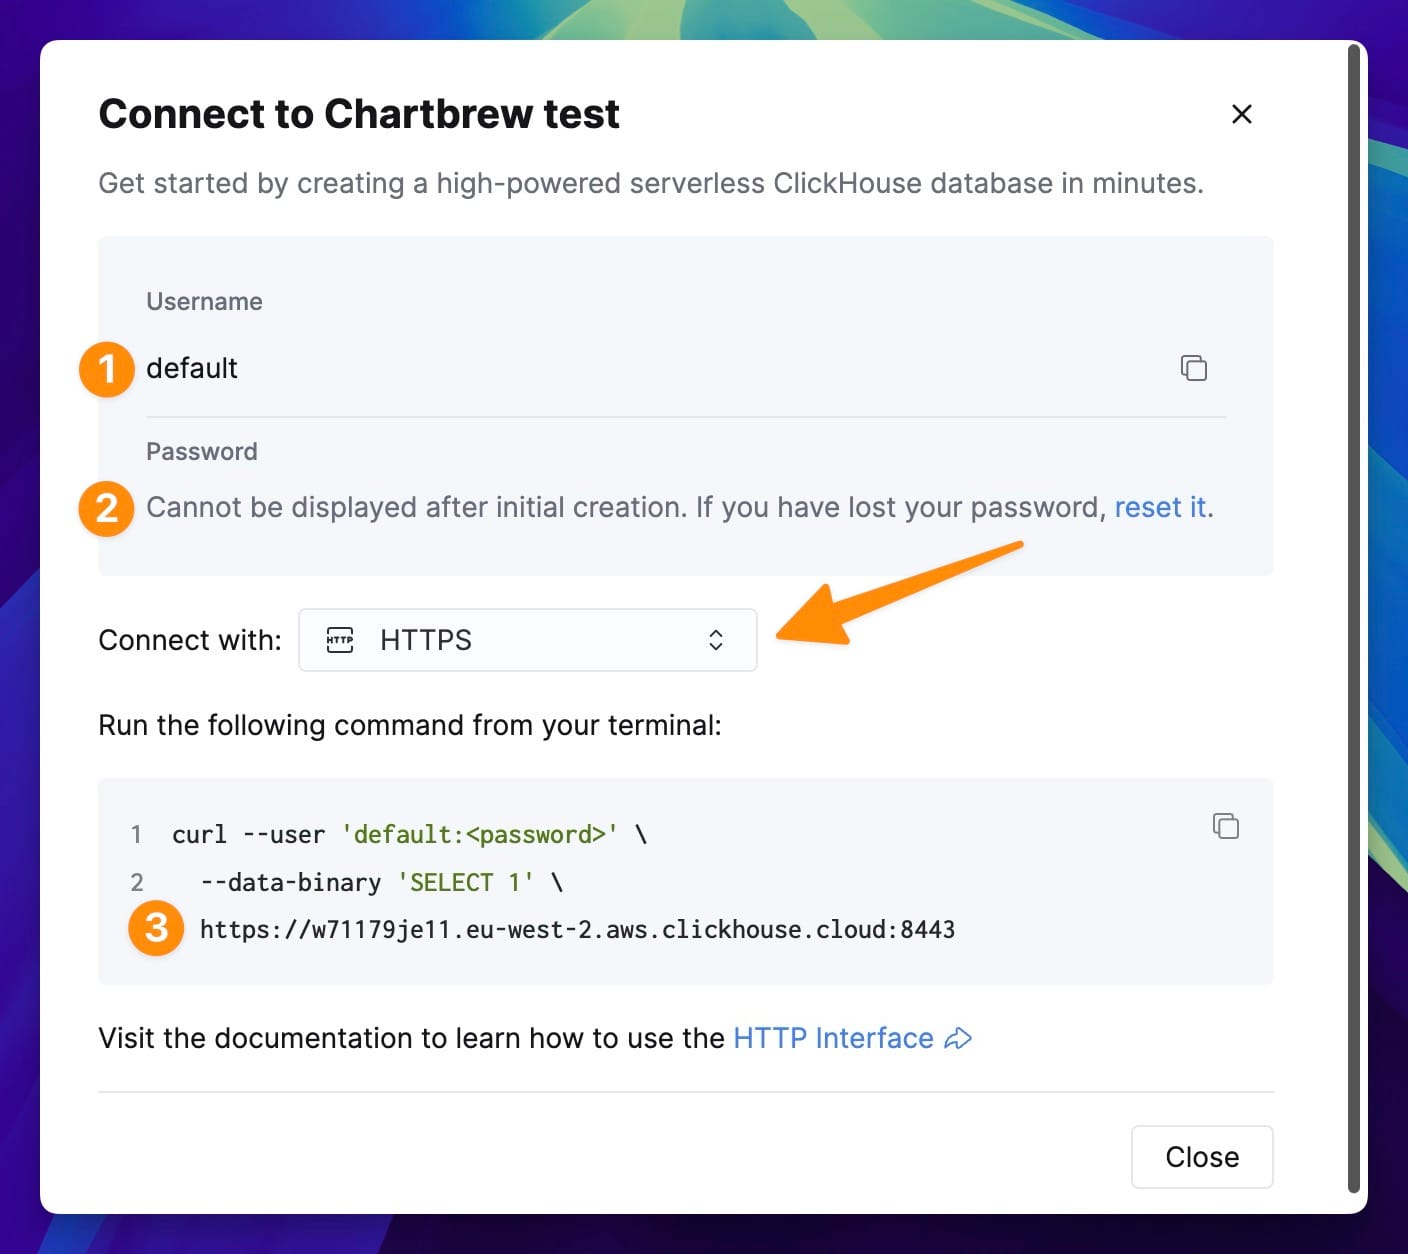
From here, we need the following:
- Username
- Password (this one is not displayed here)
- The hostname and port
You can leave this page open to copy the information to Chartbrew during the next step.
Connect Chartbrew to ClickHouse
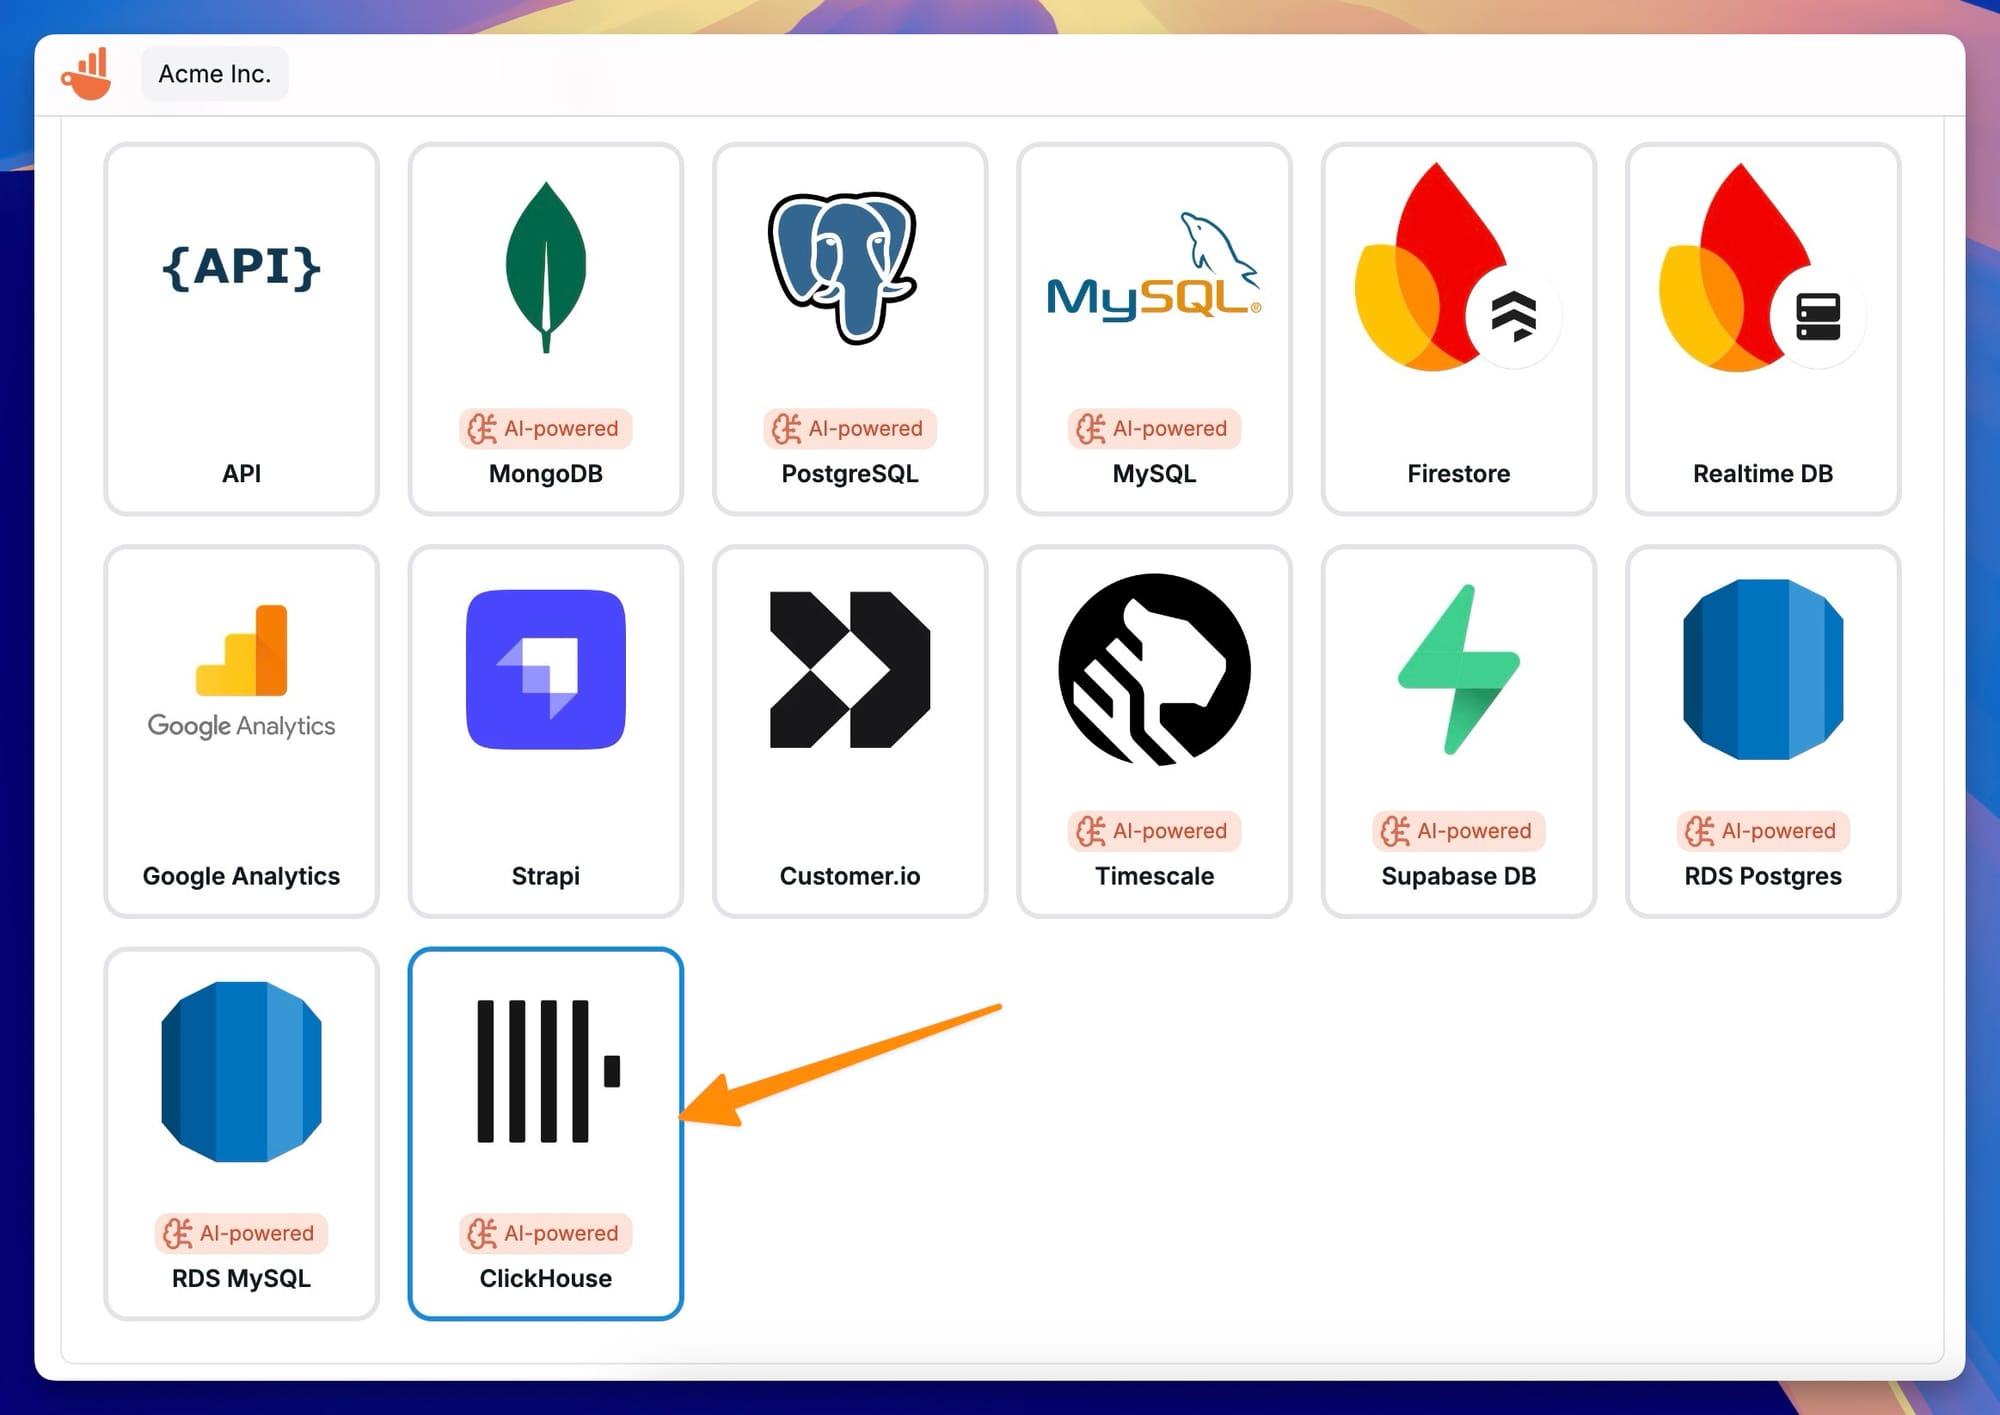
Once you have the connection settings, log in to Chartbrew, click on the Connections tab on your home page, and then click Create connection. Select ClickHouse from the list:
Copy the required information from ClickHouse connection to Chartbrew's connection form. We will need a name to identify the connection within Chartbrew, your hostname, port, and database credentials.
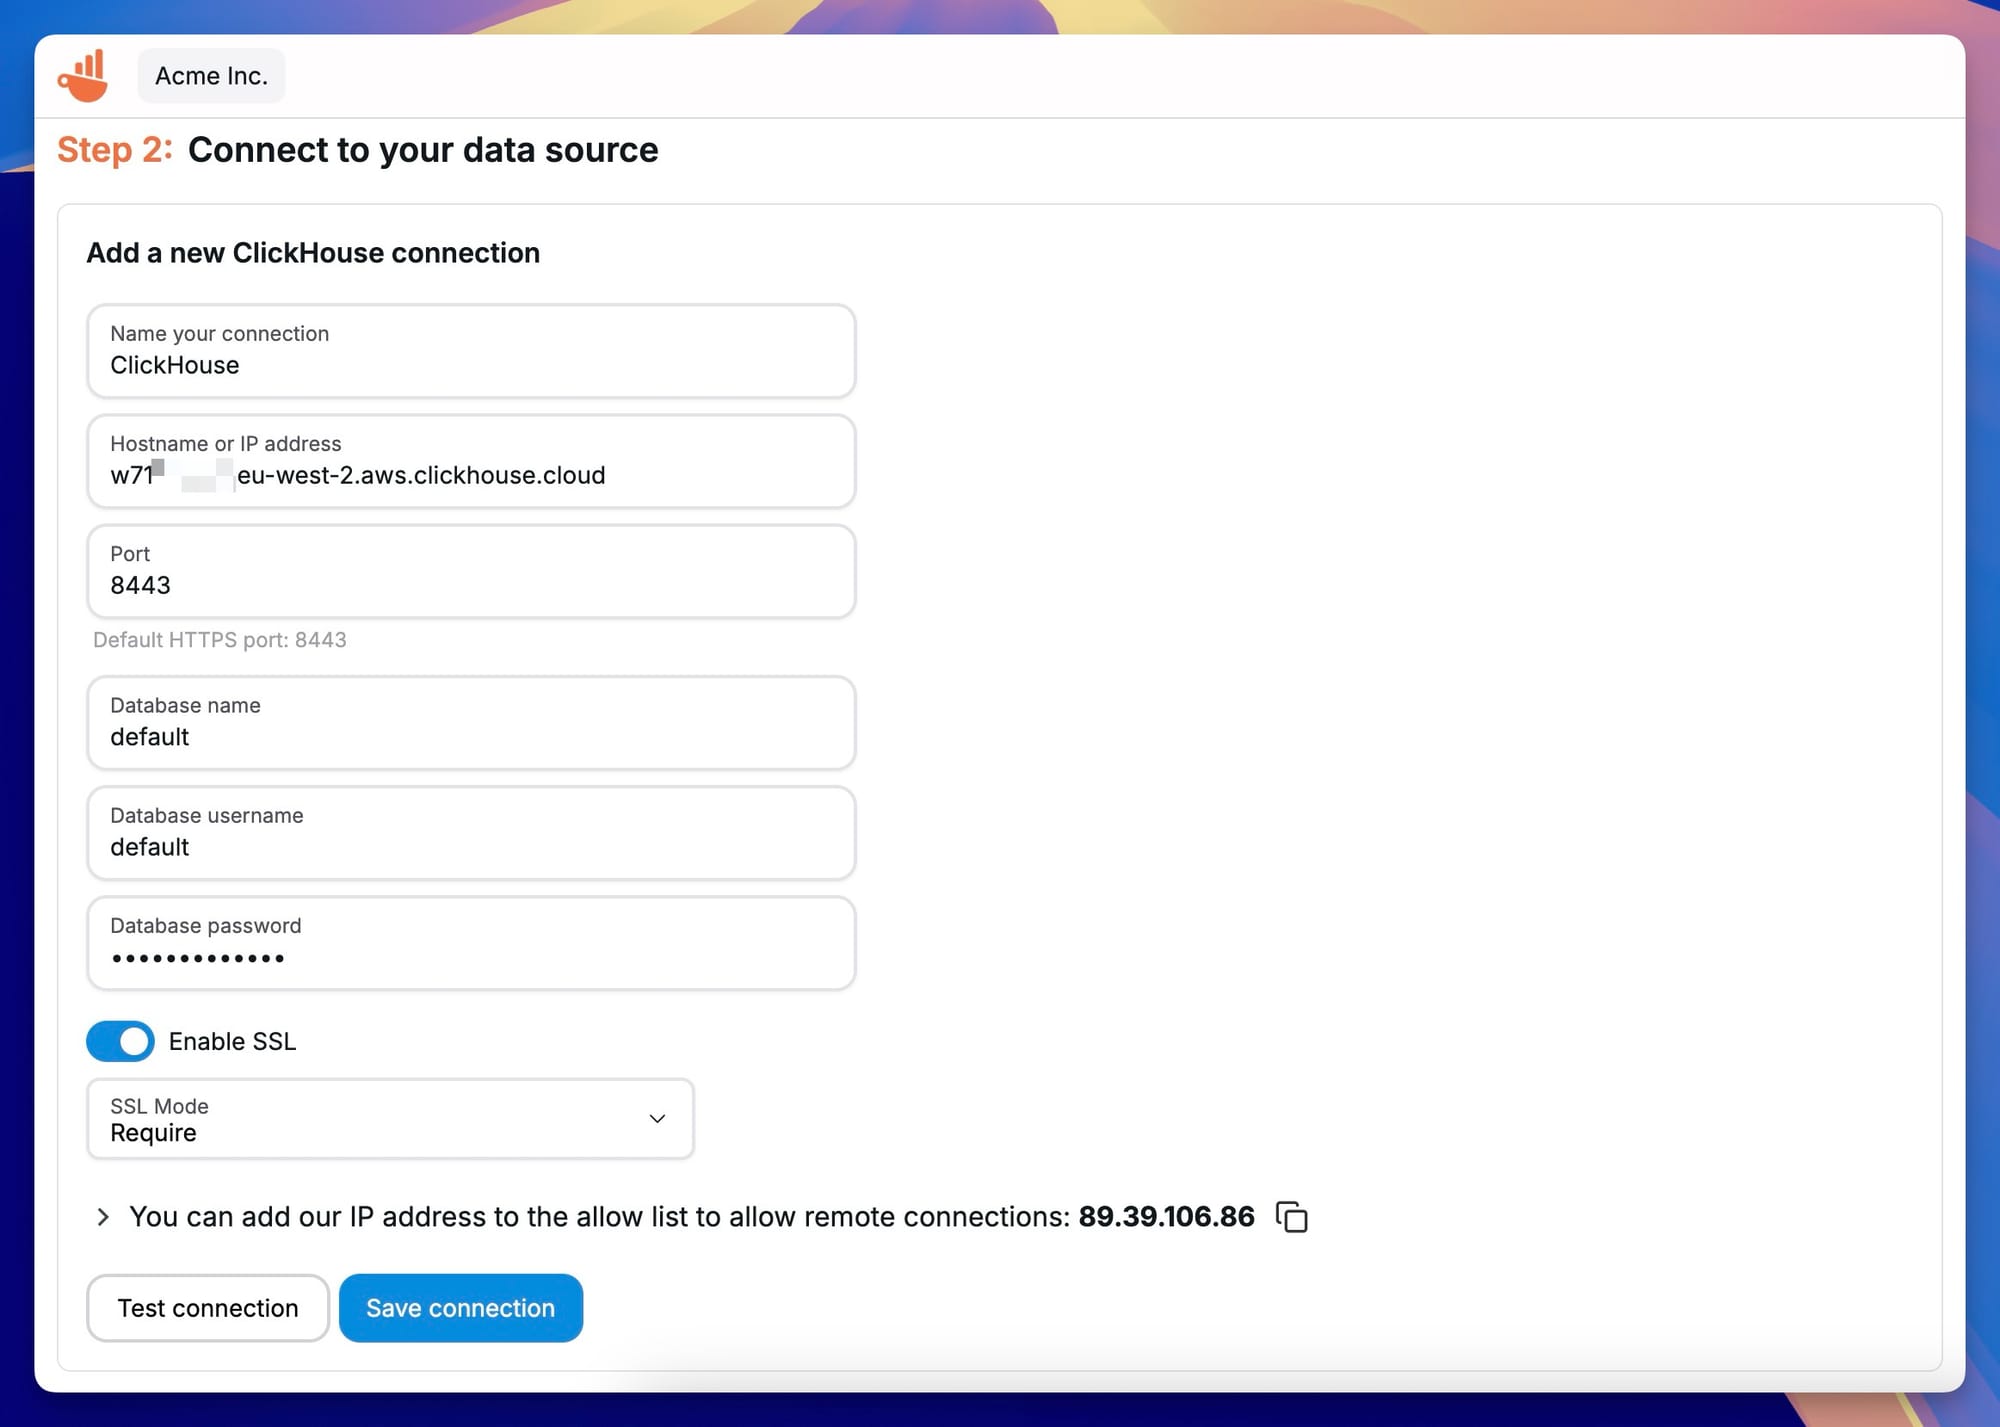
After you fill in the form, you can test and save the connection. If the test is successful, you should see your database schema in JSON format.
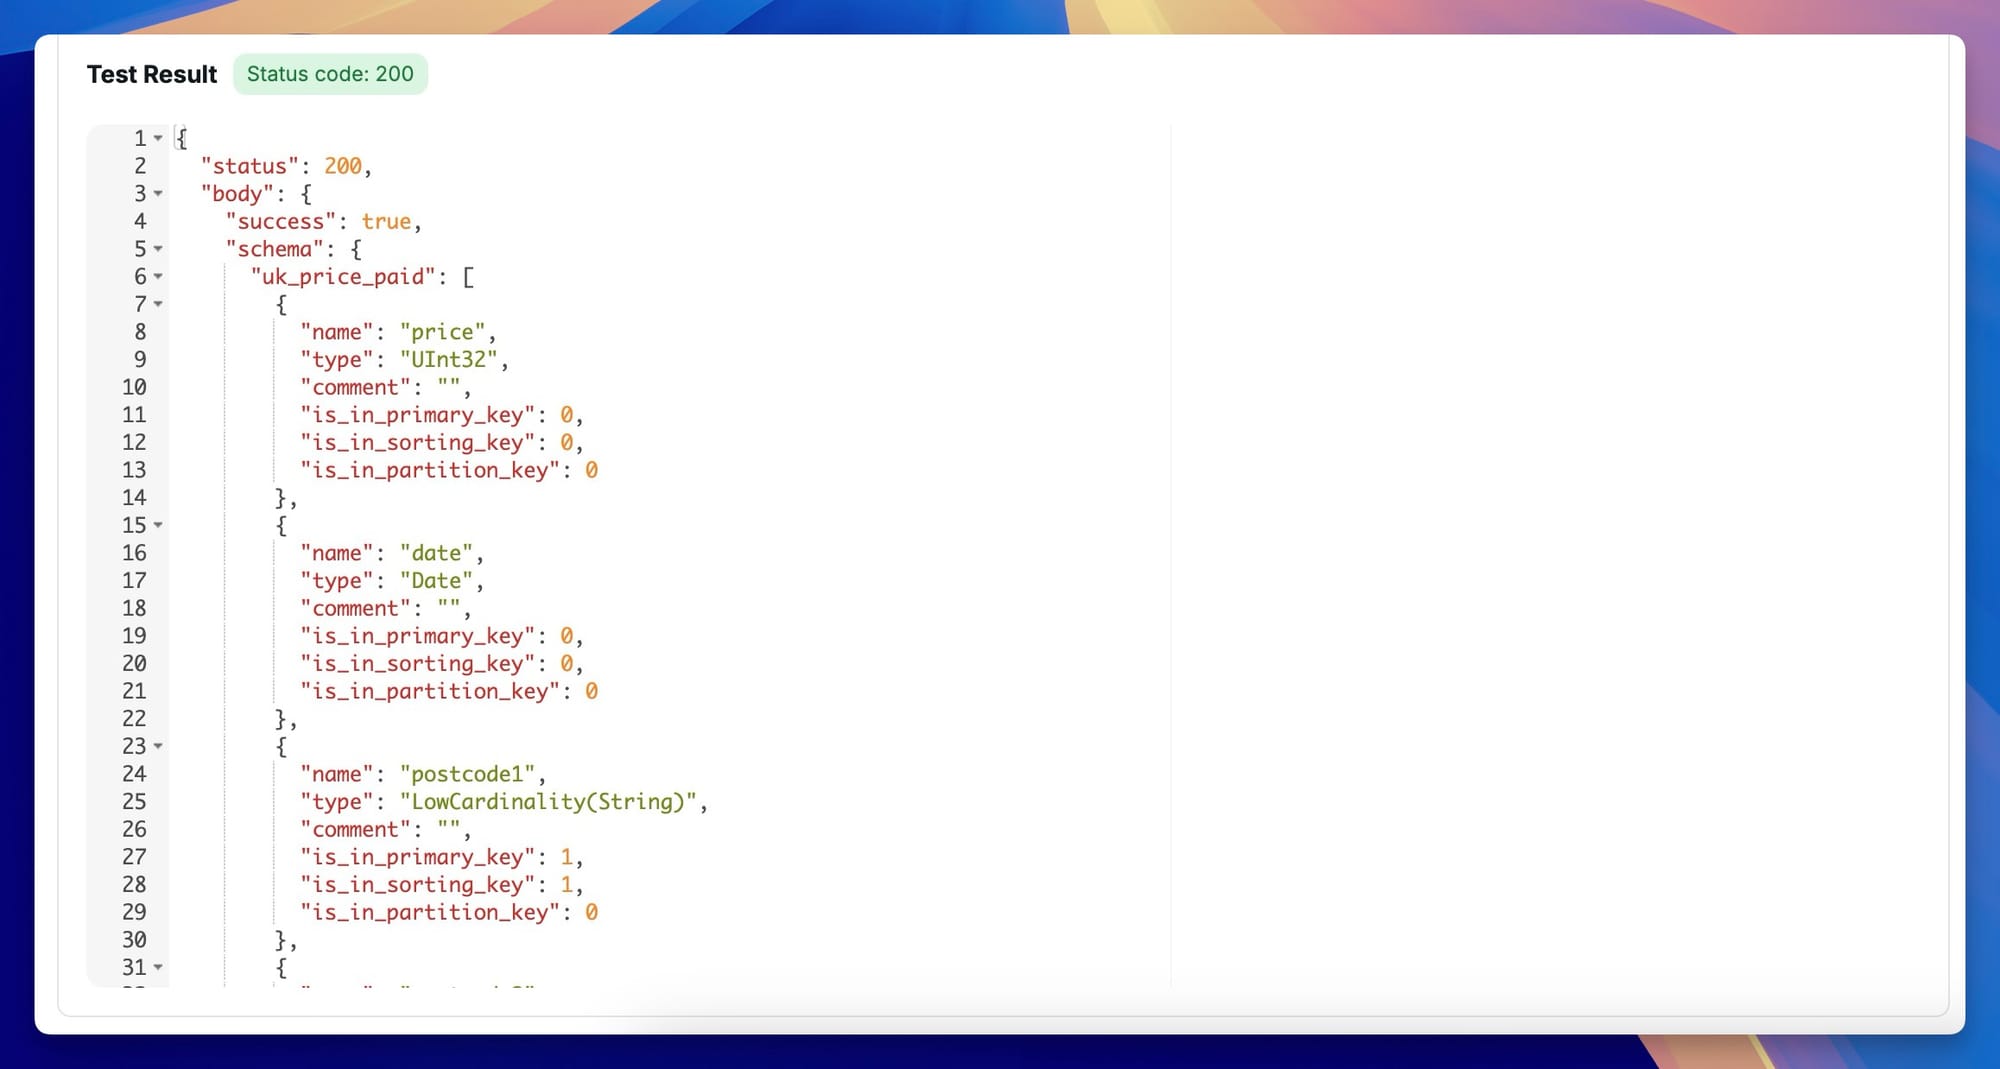
Now that we successfully connected to ClickHouse, let's proceed with creating the first dataset!
Create the first ClickHouse dataset
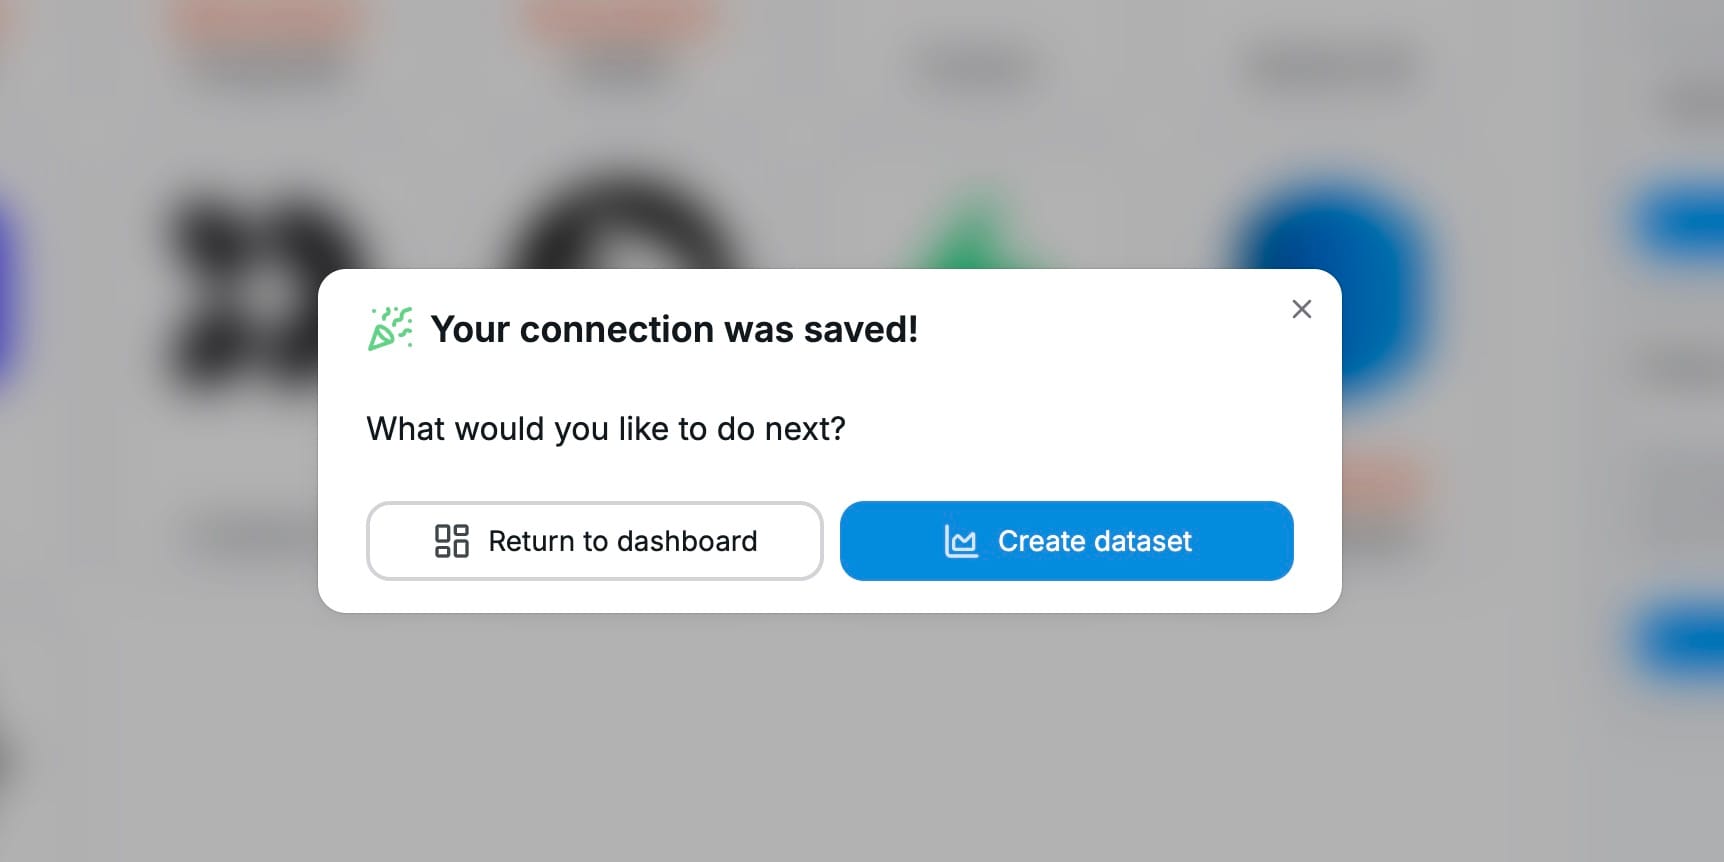
With the connection set up, it's time to pull some data. Click the Create dataset button or navigate to the datasets menu from your homepage to create new datasets.
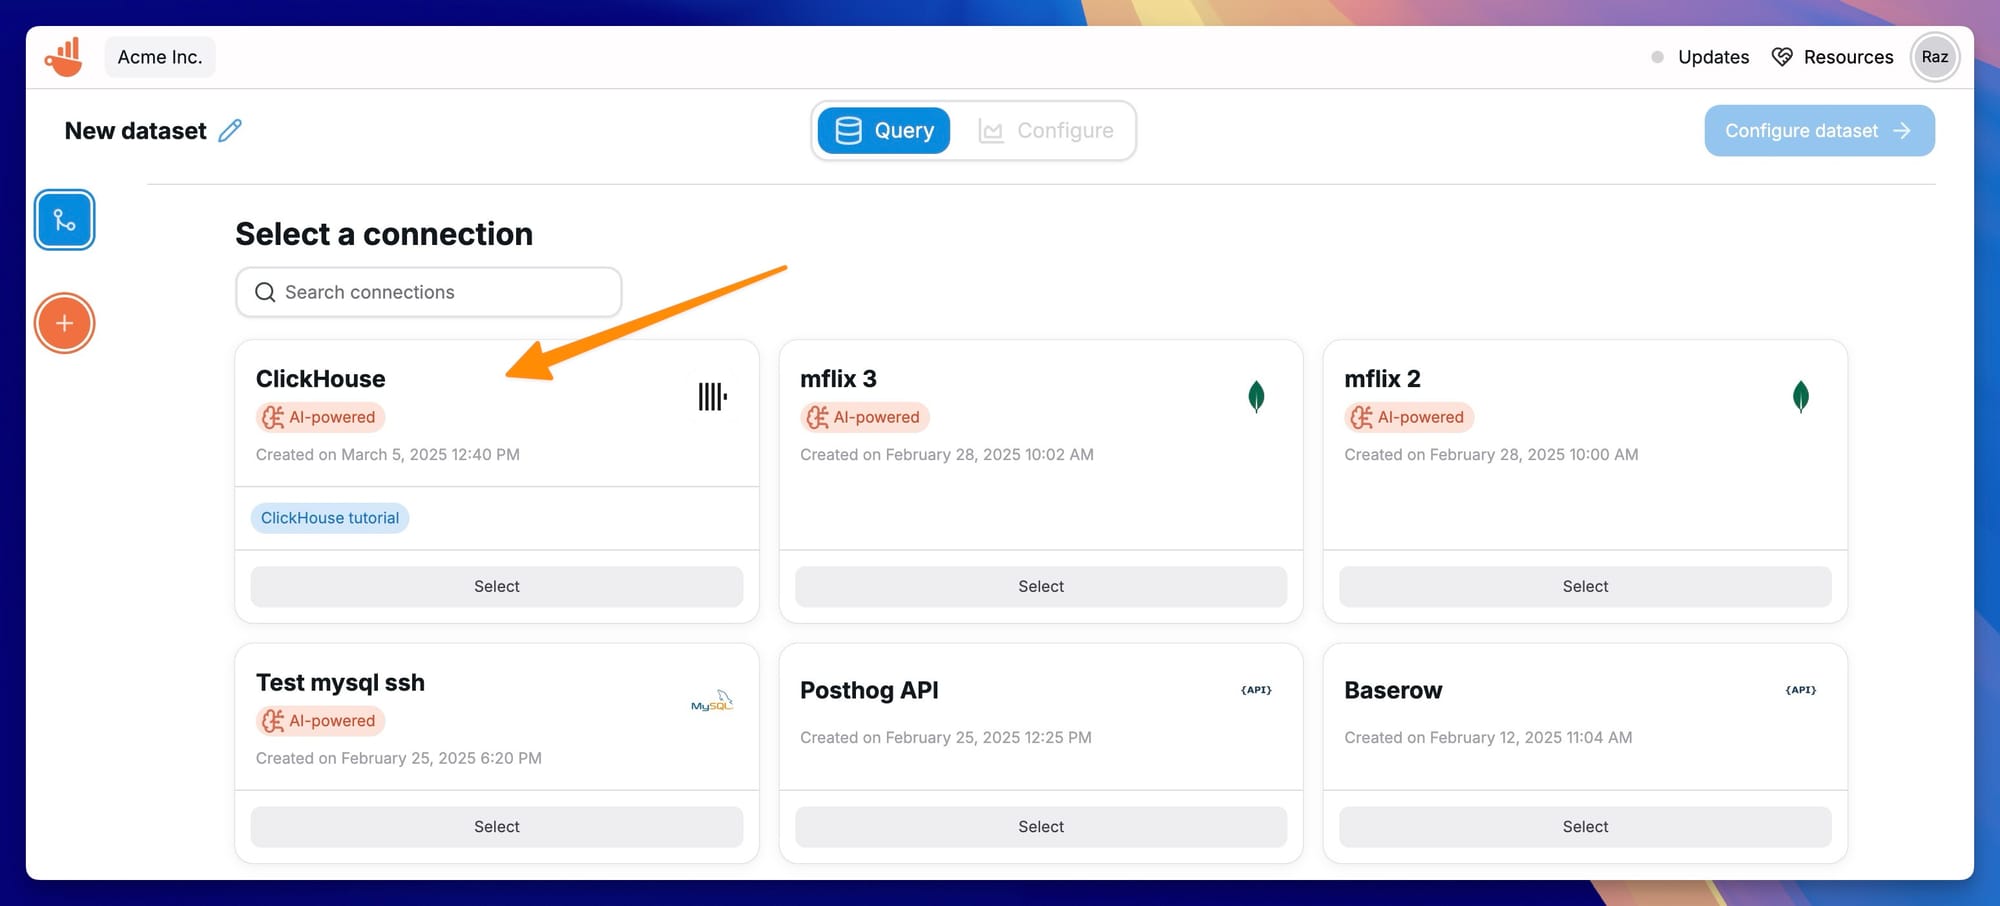
Once you are on the datasets page, Chartbrew is going to ask you to select a connection from where you want to pull data. Select the ClickHouse connection we created earlier.
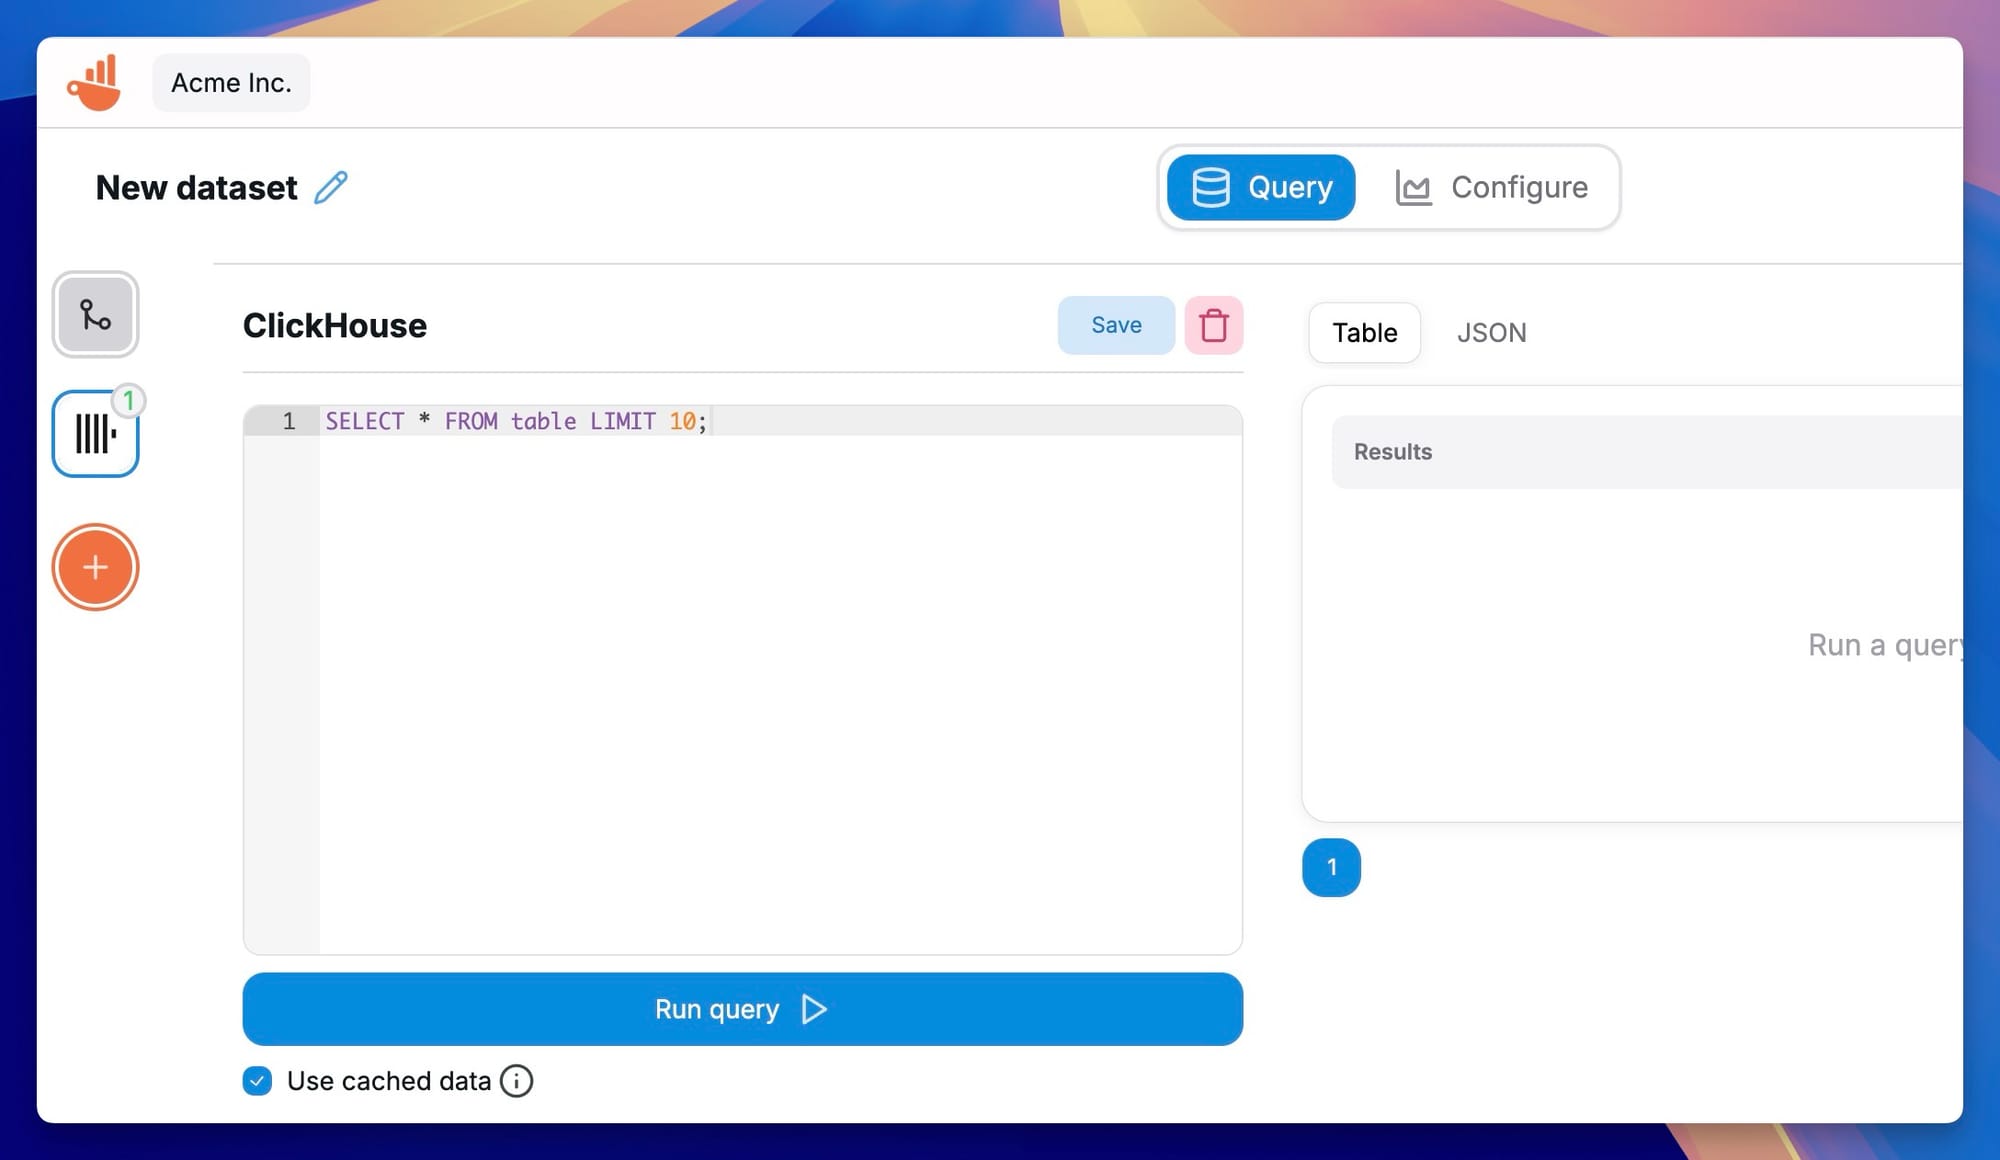
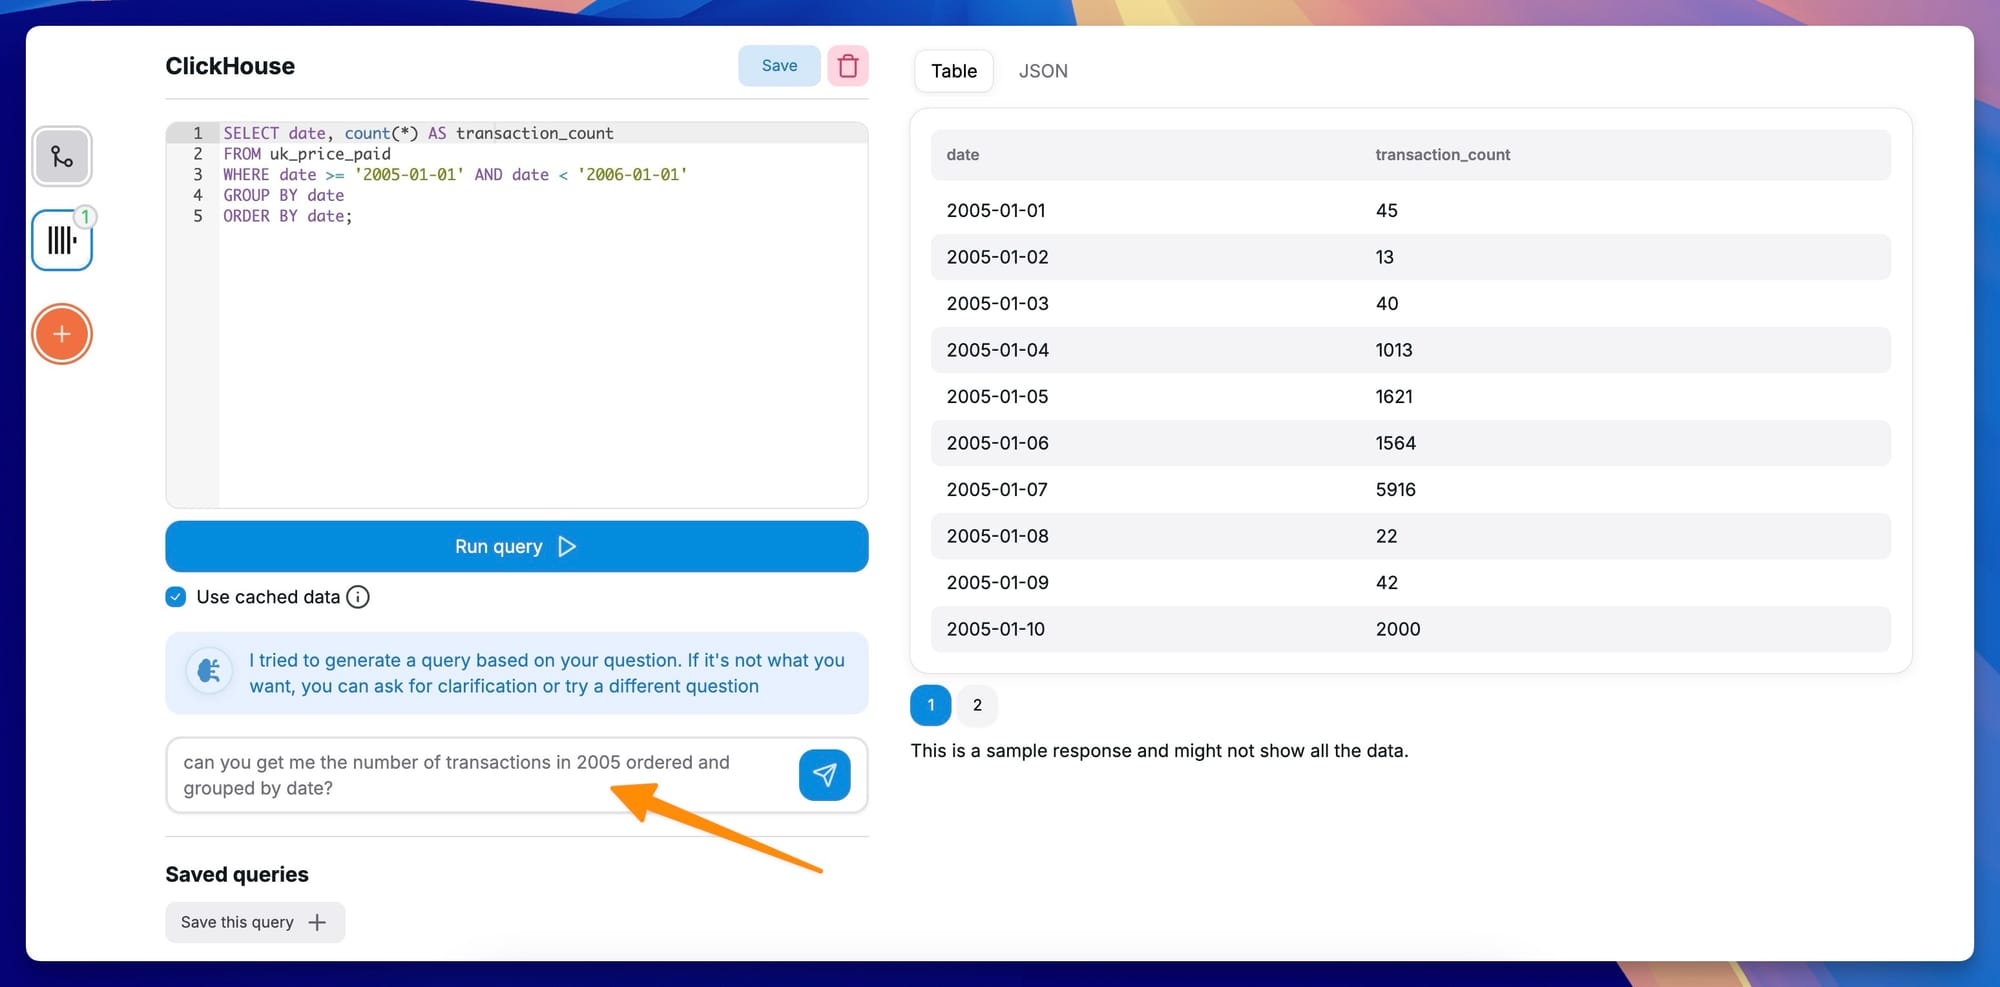
You can then proceed to write SQL queries to pull the data you want to visualize in Chartbrew. Feel free to write any query that ClickHouse supports here.
If you are unsure on where to start, you can ask our AI assistant to help you with the queries. Chartbrew is already aware of your database's schema so the AI is quite good at writing efficient SQL code. You can even ask follow-up questions to tweak your SQL code as the assistant is aware of your previous conversations.
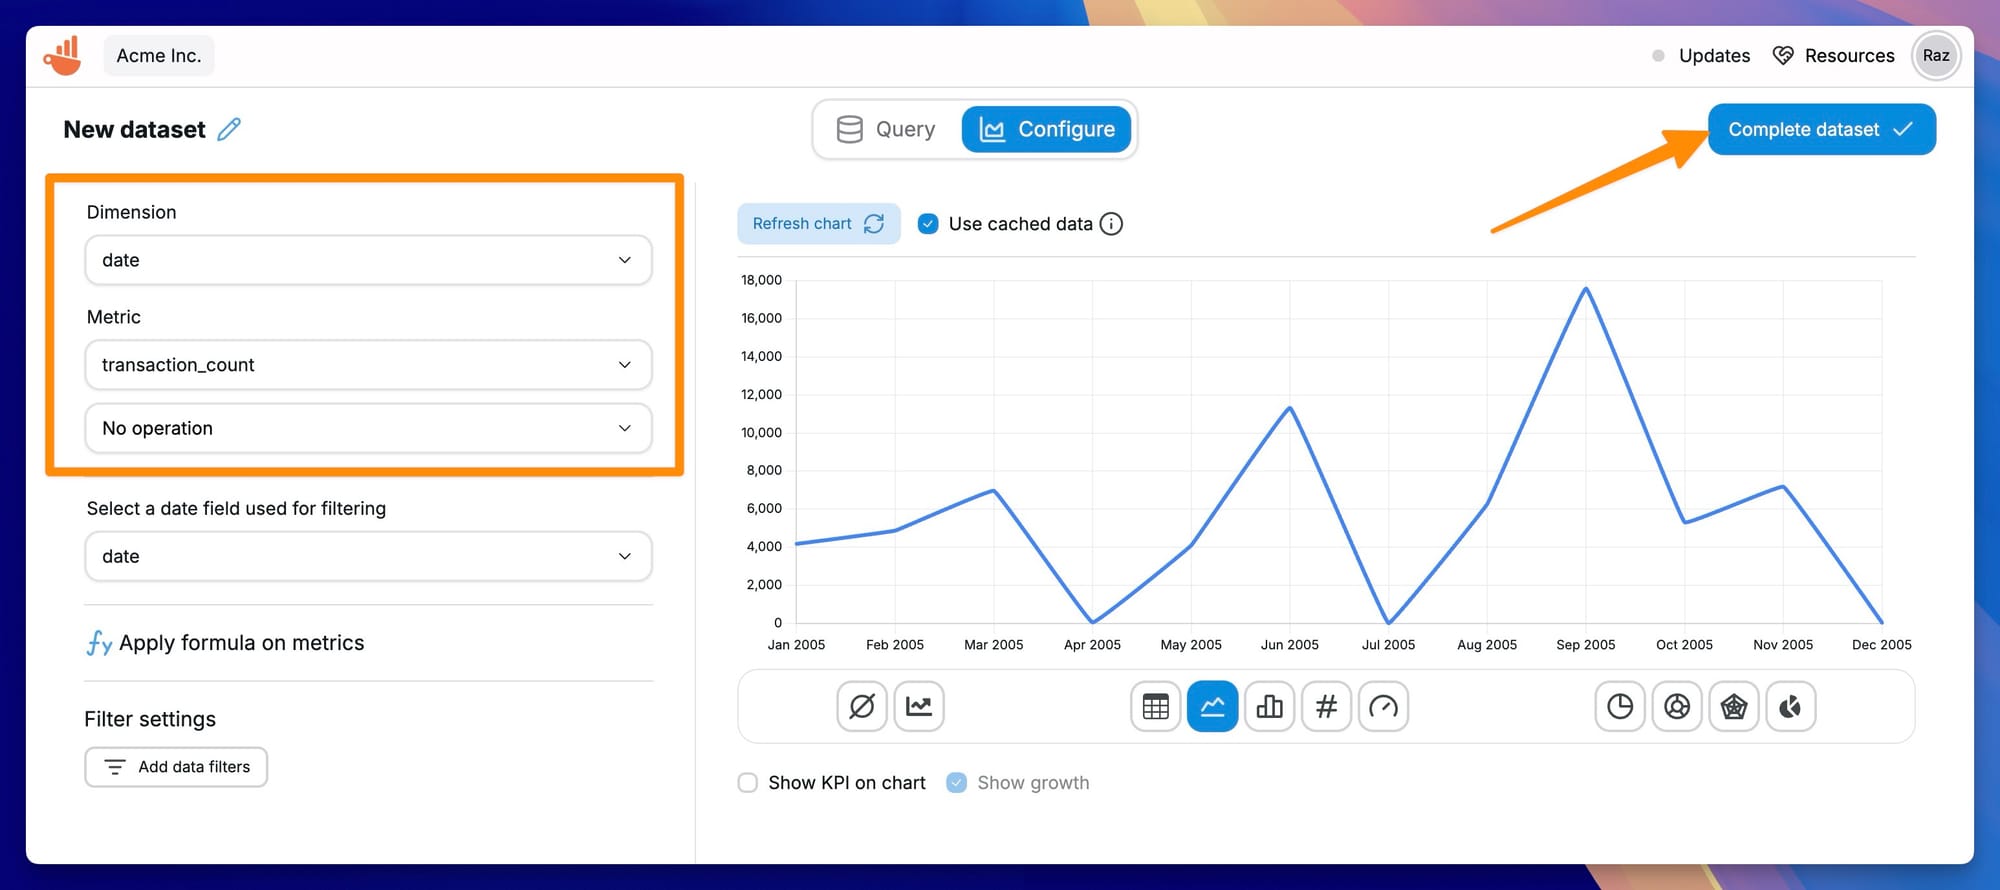
Once you're happy with the data, click on the Configure dataset in the corner to define the metric and dimension for visualization, as well as preview how your dataset can be visualized.
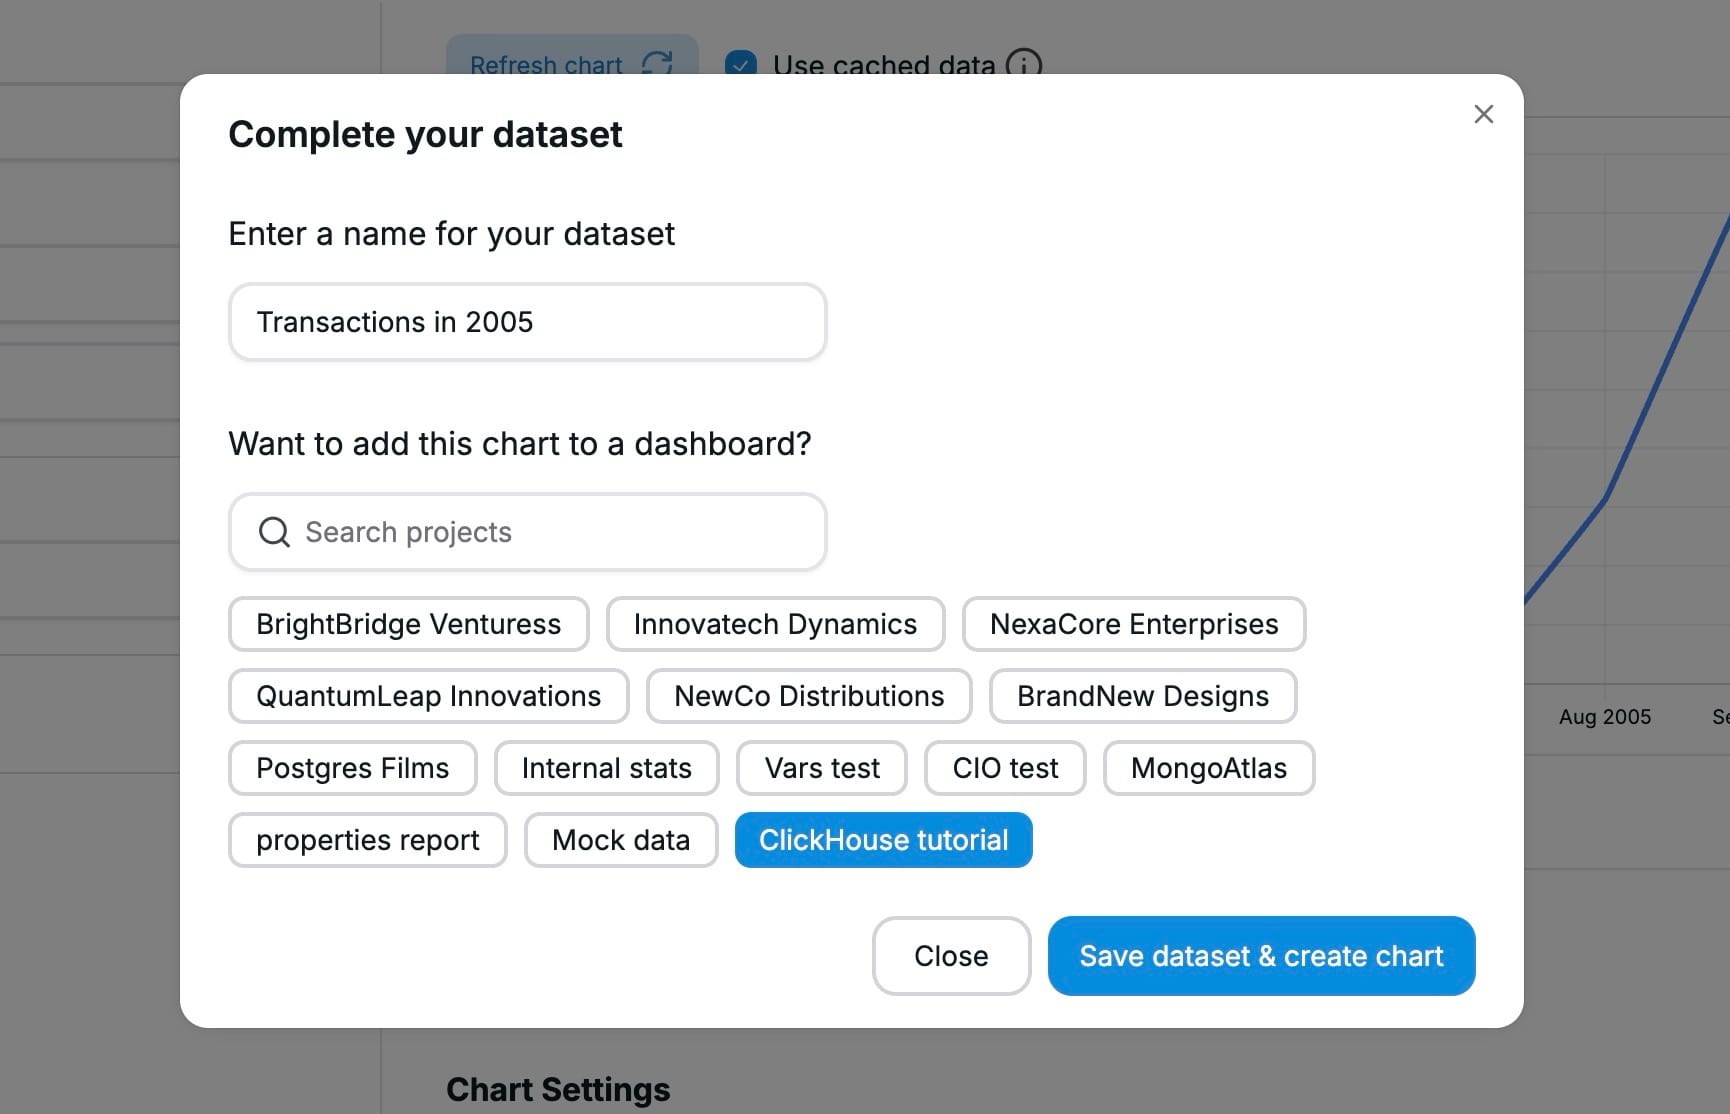
When you click on the Complete dataset, Chartbrew is going to ask you to name your dataset and if you'd like to create the same chart in the preview in one of your dashboards. Your dataset will be saved nonetheless and you can create any number of charts from it later on. In this tutorial we are going to place this chart into one of our dashboards.
You can repeat these steps to create multiple datasets and charts. This way your dashboard can give you insights into your data and you will be able to create a dashboard like below:
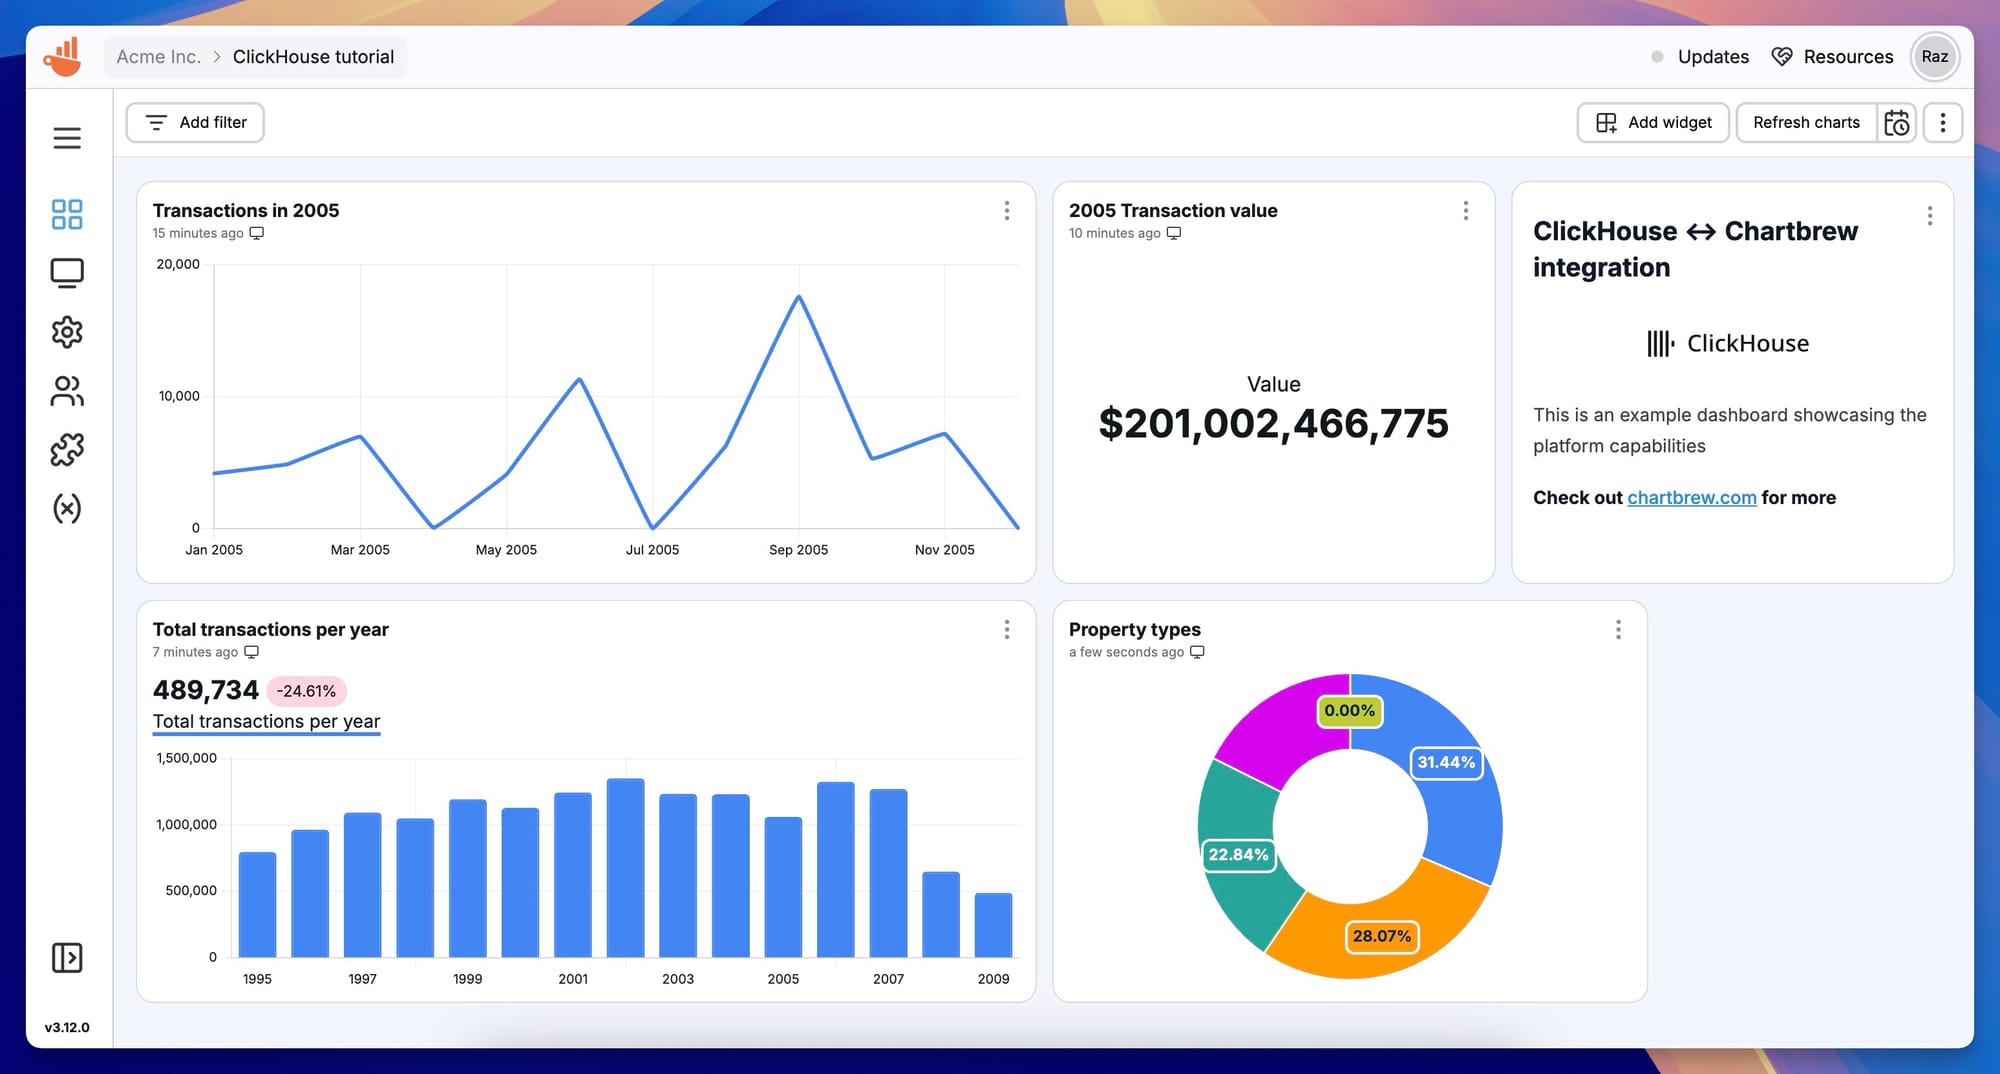
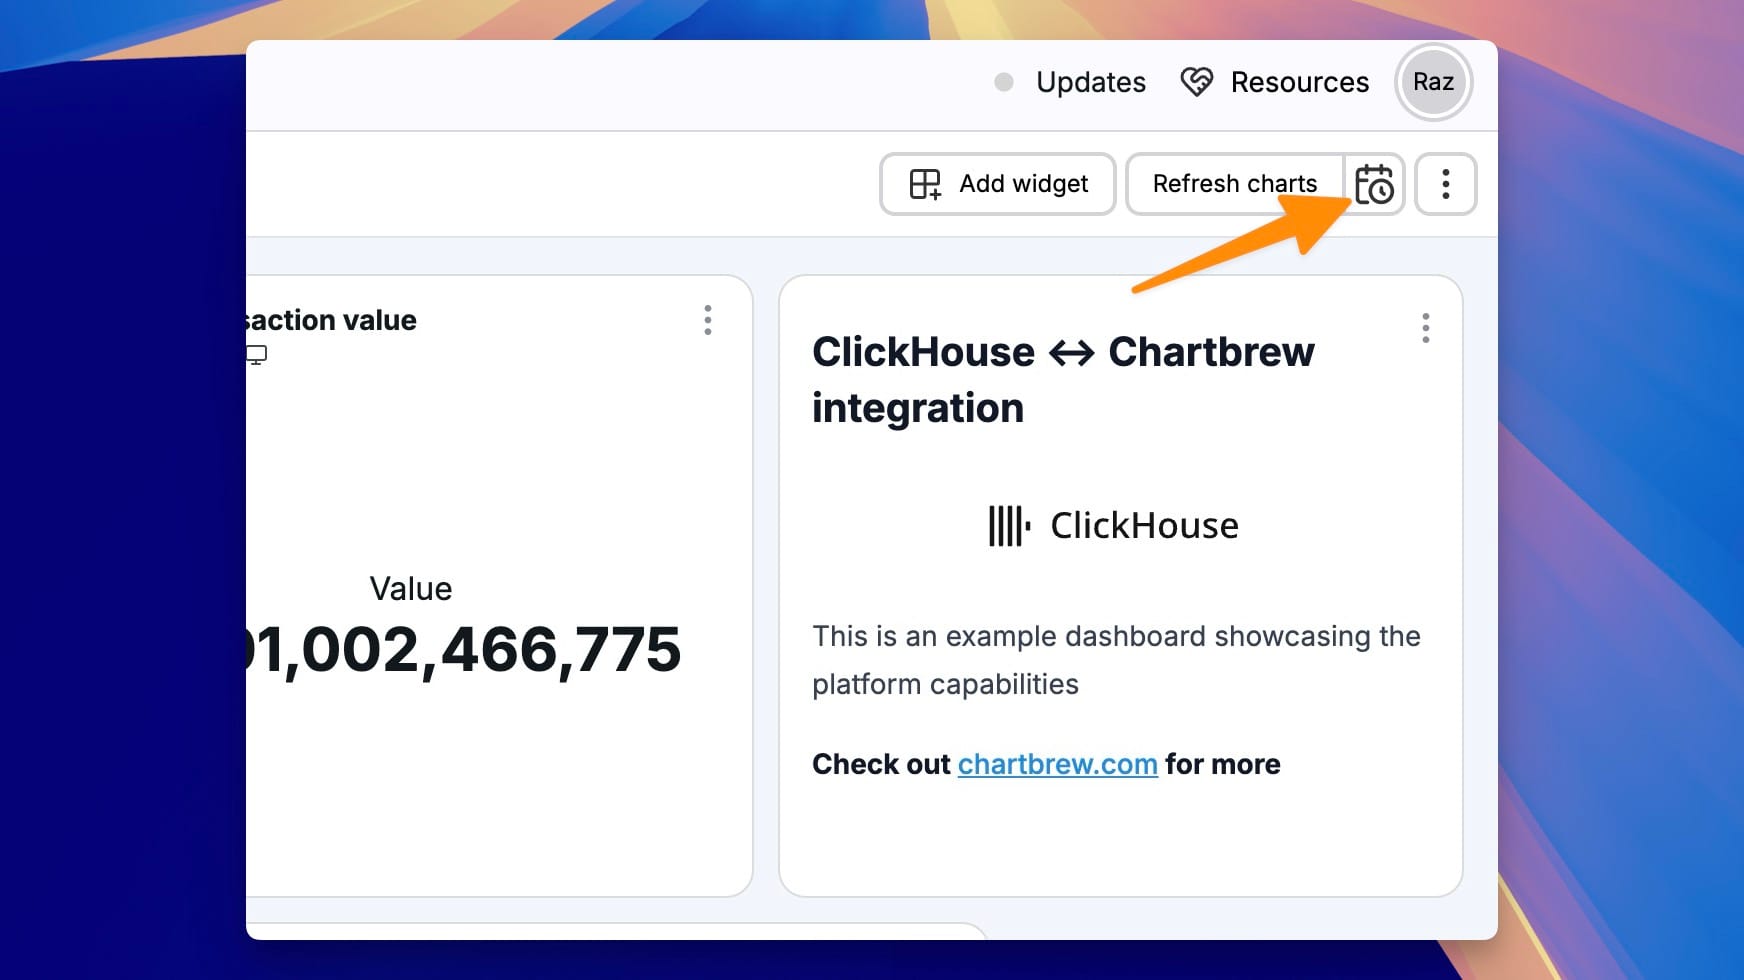
If you want to keep your dashboard automatically up-to-date you can configure scheduled auto-updates. Click on the calendar icon next to the refresh button to configure this.
Next steps
There are lots of things you can do in Chartbrew to make it more useful for your business. Here are a few things:
- Create dashboard templates to easily duplicate dashboards for multiple clients
- Create and customize client reports and share them externally
- Automate your visualization stack using our API
Get in touch if we can help with setting up your perfect dashboards. If you haven't already, you can get started with Chartbrew and try it for free to 14 days. Sign up for an account here.
