
In this tutorial, we will show how you can connect your Supabase database to Chartbrew with a read-only user. Once we test our connection, we will query the database, create a dataset, and finally visualize the data.
Getting started with Supabase
There is a high chance that you already have a Supabase database set up if you are reading this tutorial, but if you want to follow along, we will show you how we set up our database there.
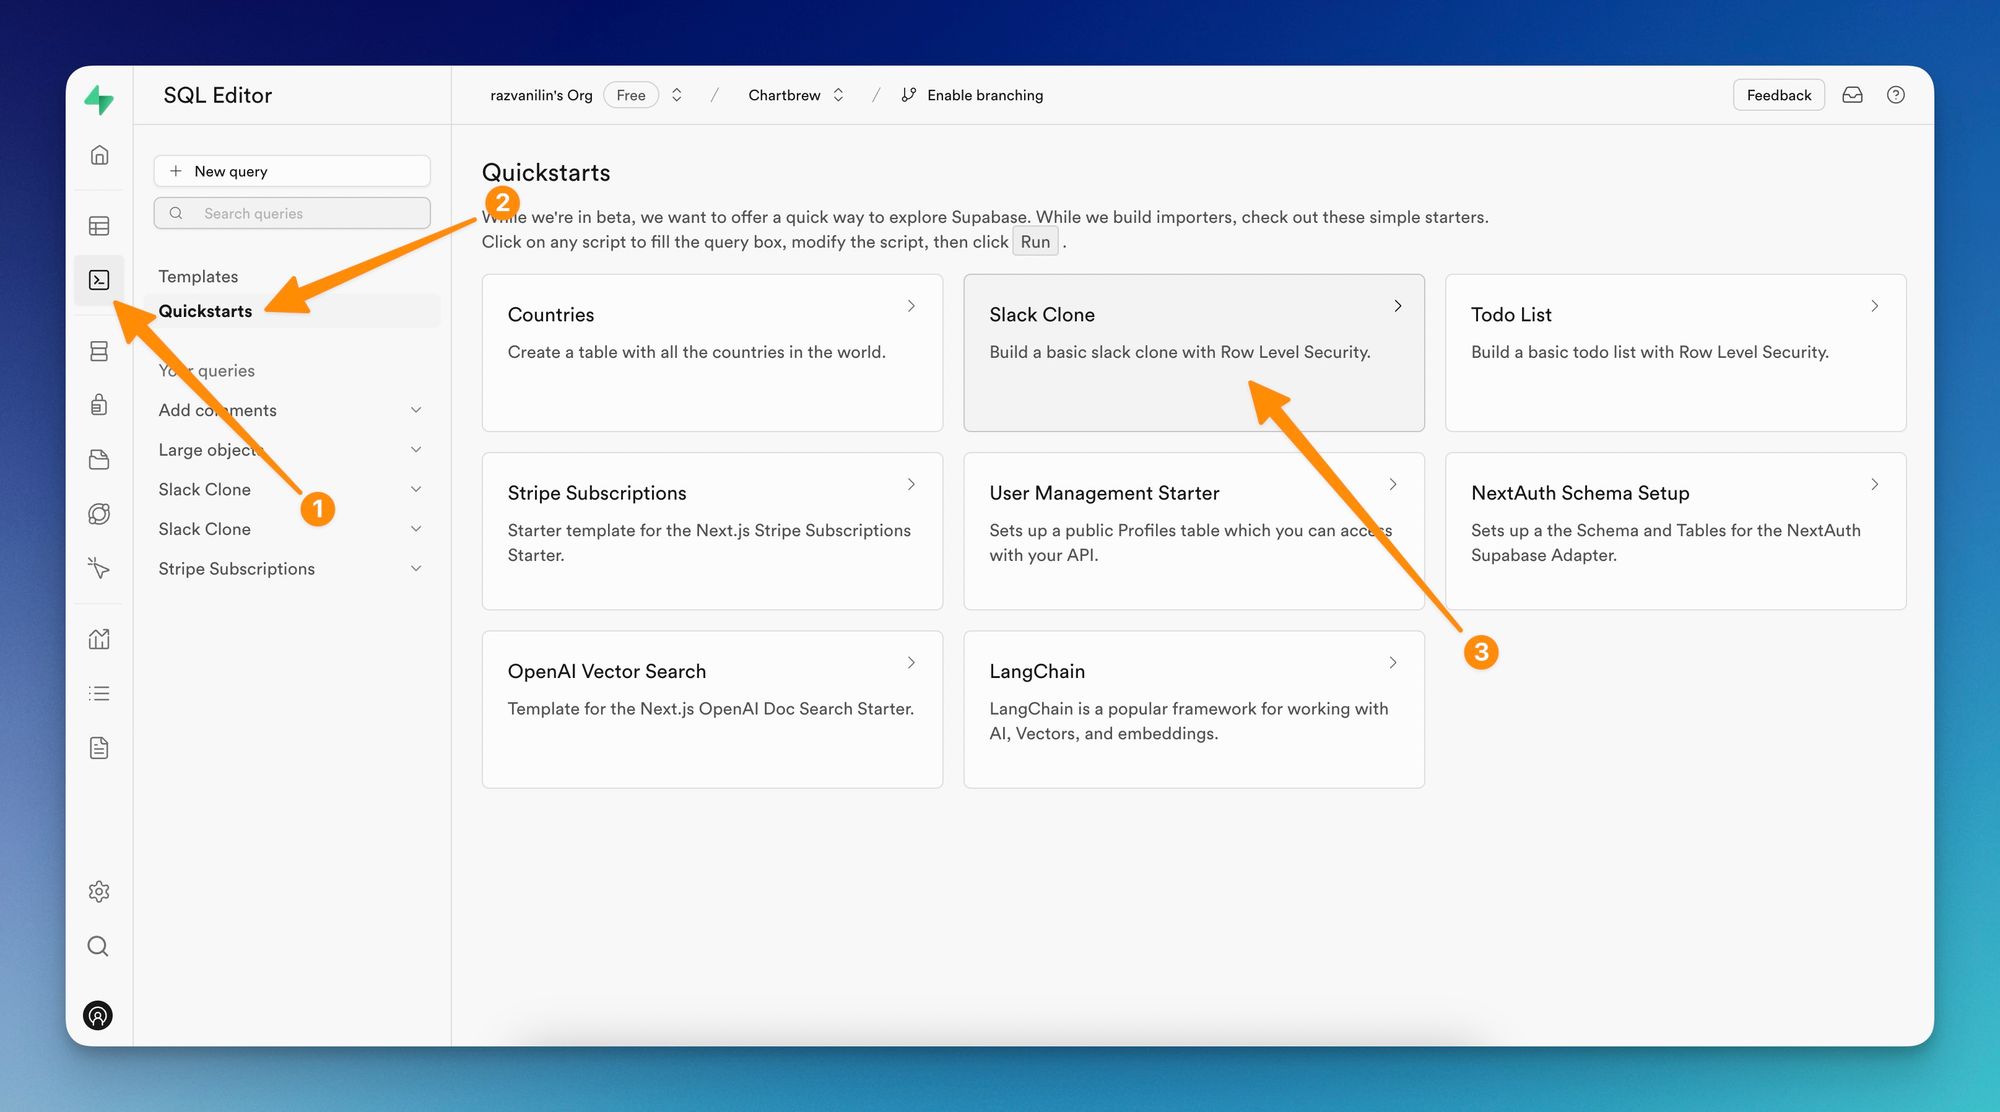
You can start by creating an account at supabase.com and once your database is fully set up, you can use a Quickstart database to create some initial tables. Head over to the SQL Editor menu, then tap on Quickstarts, and finally, choose the Slack Clone template to run and set up the initial database tables.
Create a read-only role and user
When connecting to Chartbrew, it's important to create a read-only user for your database. This way, there is no danger of accidentally writing or deleting data.
There are multiple ways to create a new user in a Postgres database with client tools like pgAdmin, but in this tutorial, we are going to walk you through how to do it with the psql CLI tool which is available if you have Postgres installed on your machine.
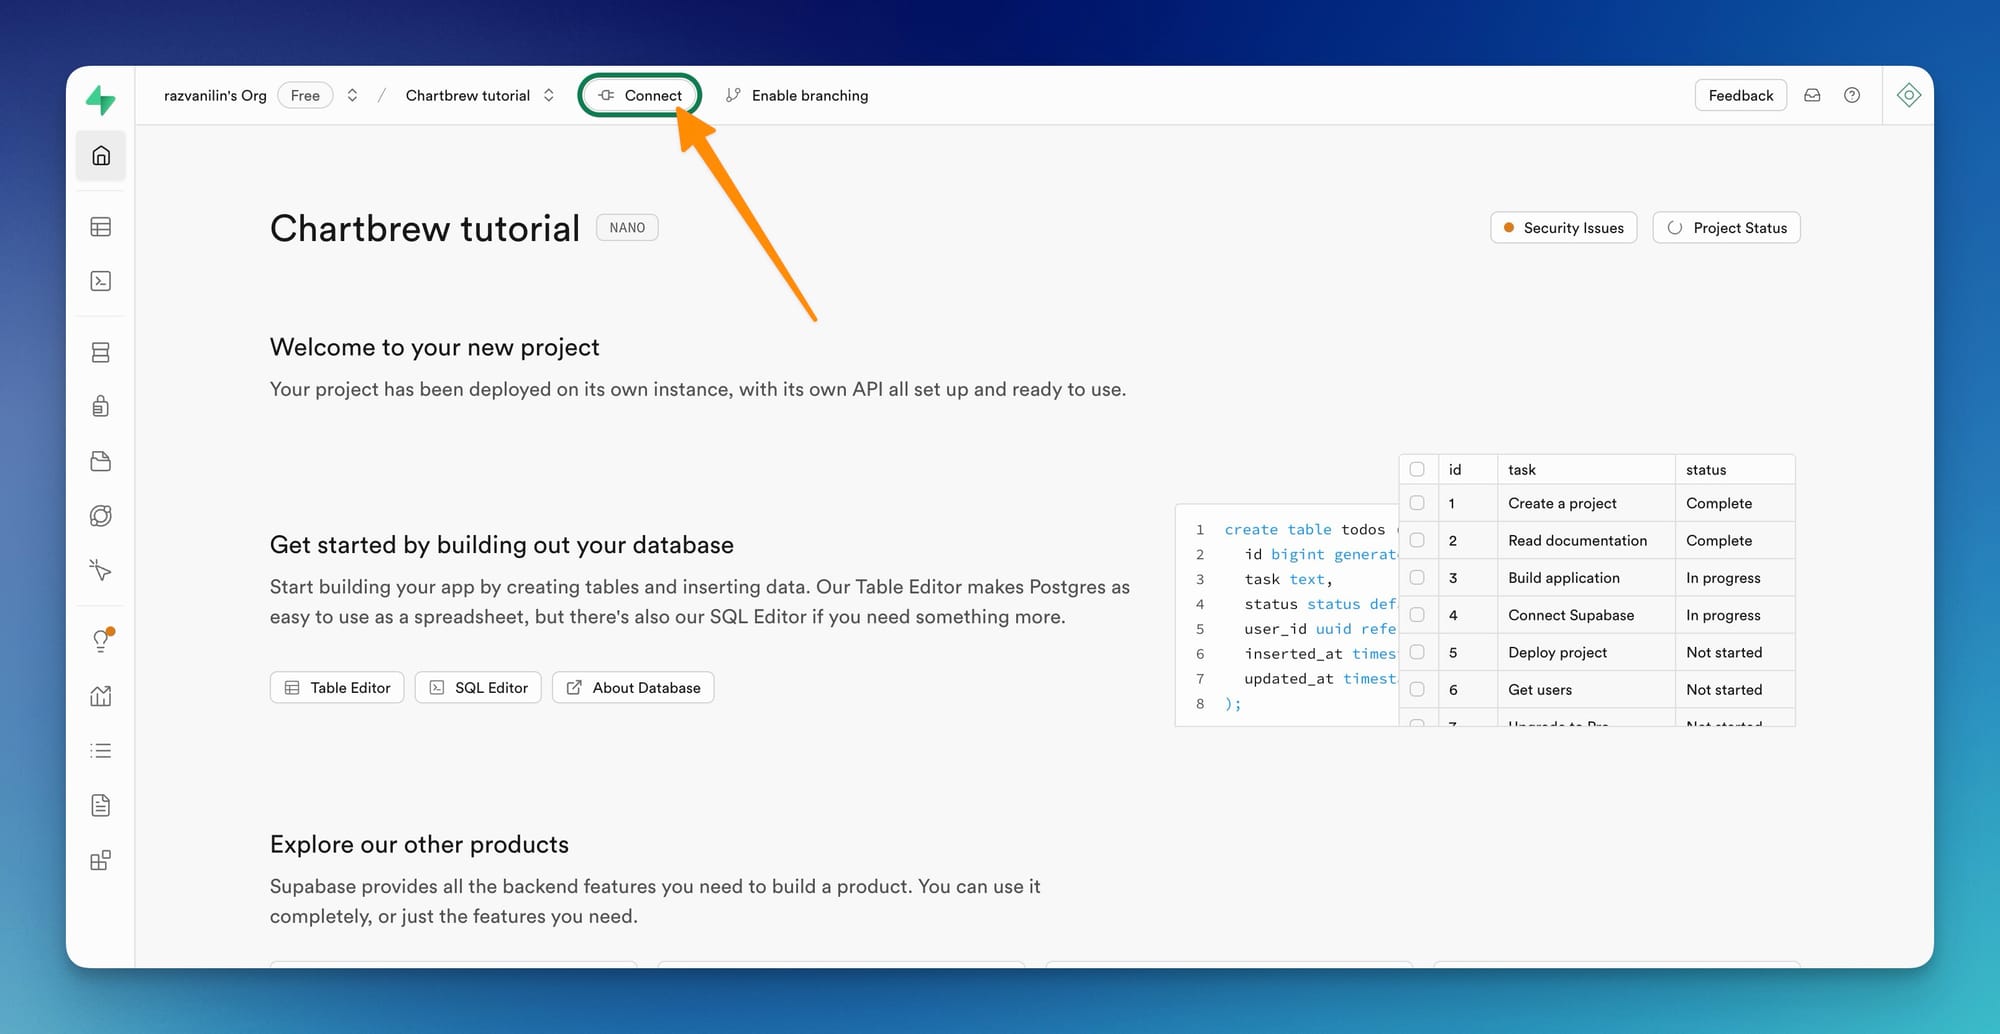
To connect to Supabase's database, we first need the psql command which is available in the Project Settings menu in your Supabase dashboard.
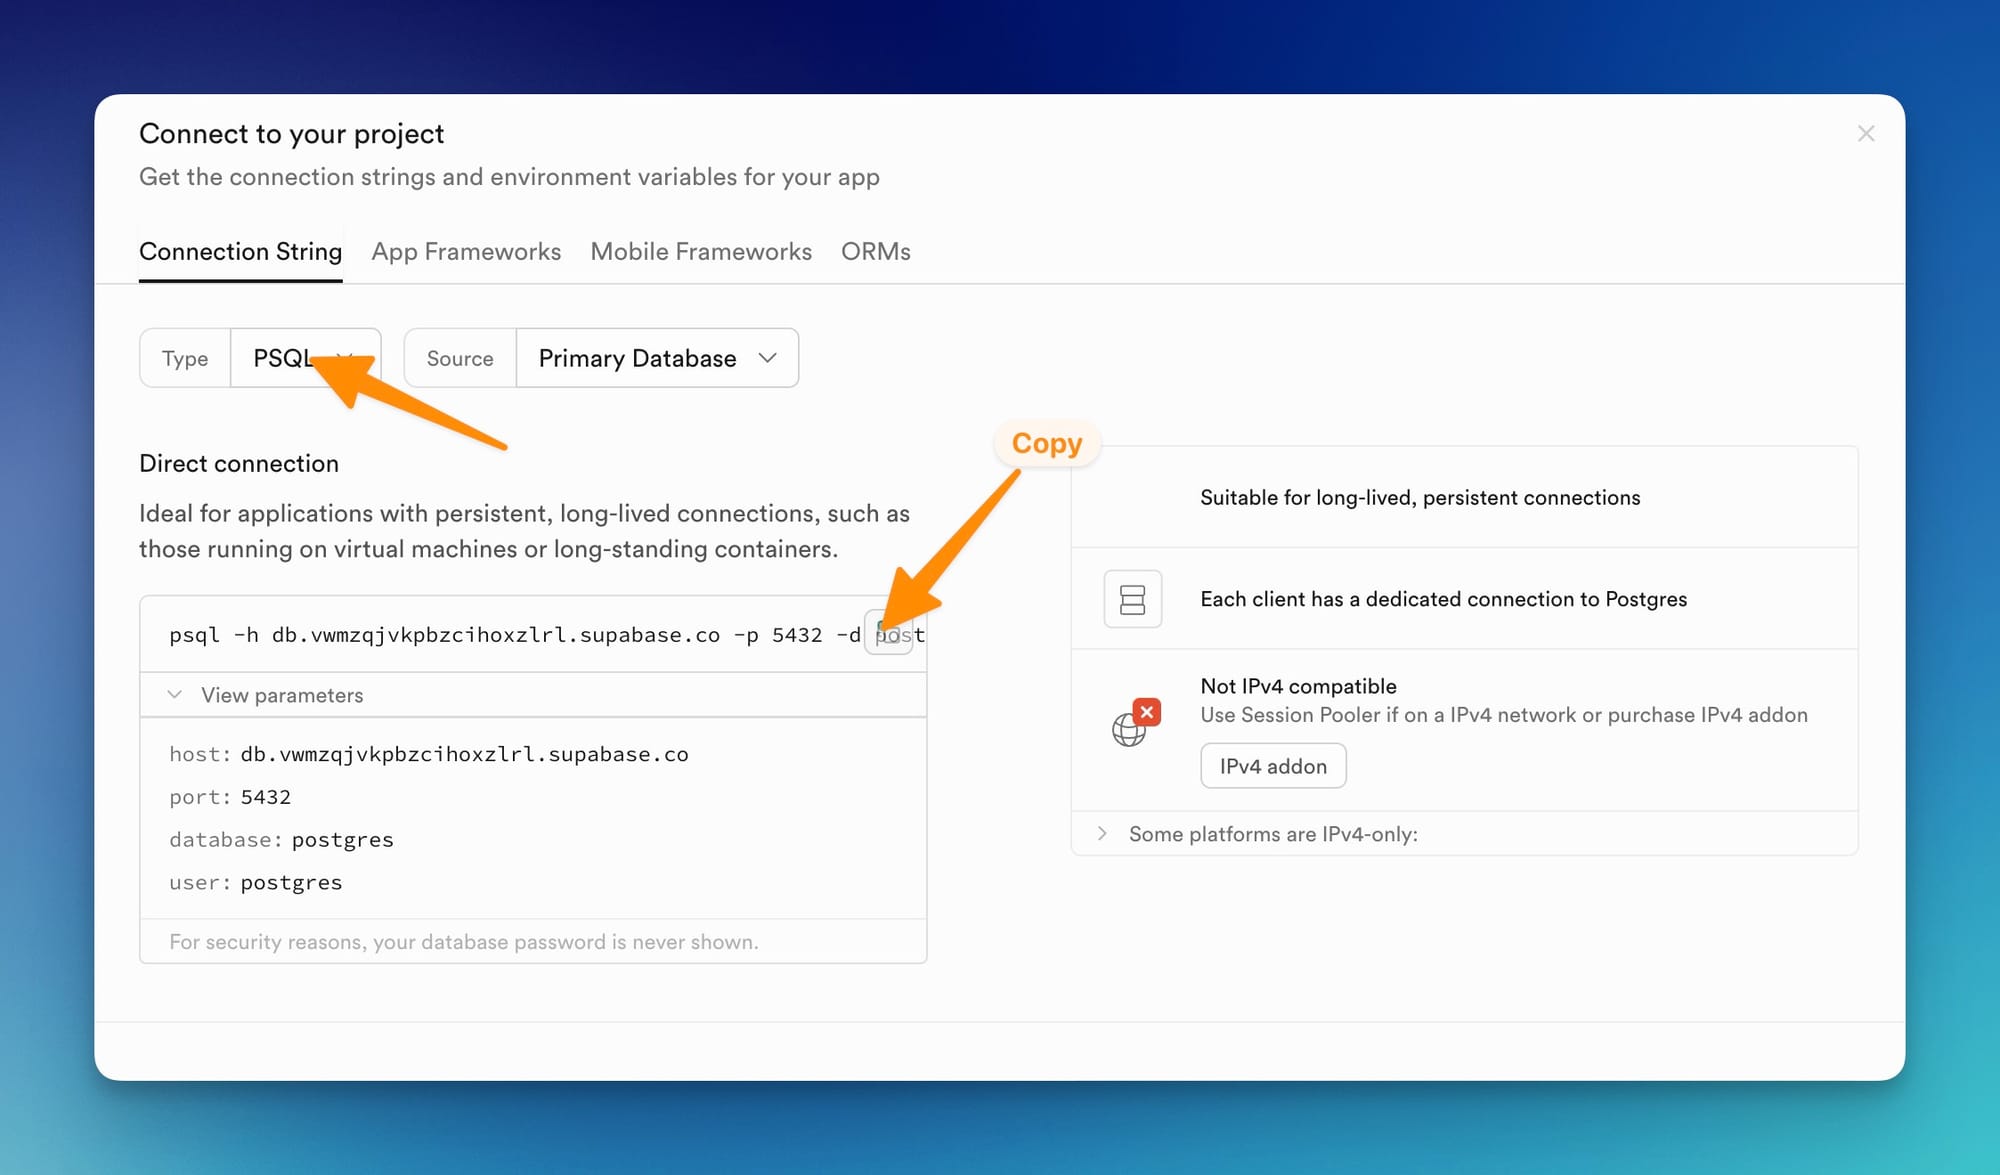
Copy the psql command in your local terminal. When you run the command, it will ask you to enter your database password. This is the password you set up initially when you created your database. Once you are connected, we are going to create a read-only user called chartbrew_viz. Copy the commands below and don't forget to add a secure password and save it for later use:
# Create a new user
CREATE USER chartbrew_viz WITH ENCRYPTED PASSWORD 'your_secure_password';

# Create a new read-only role for your database
CREATE ROLE readonly WITH LOGIN PASSWORD 'your_secure_password';
GRANT CONNECT ON DATABASE postgres TO readonly;
GRANT USAGE ON SCHEMA public TO readonly;
GRANT SELECT ON ALL TABLES IN SCHEMA public TO readonly;

# Set default privileges for future tables
ALTER DEFAULT PRIVILEGES IN SCHEMA public GRANT SELECT ON TABLES TO readonly;

# (Optional) Repeat for views or other objects
GRANT SELECT ON ALL SEQUENCES IN SCHEMA public TO readonly;
ALTER DEFAULT PRIVILEGES IN SCHEMA public GRANT SELECT ON SEQUENCES TO readonly;

# Assign readonly role to the new user
GRANT readonly TO chartbrew_viz;
ALTER USER chartbrew_viz WITH BYPASSRLS;
Connect Chartbrew to Supabase
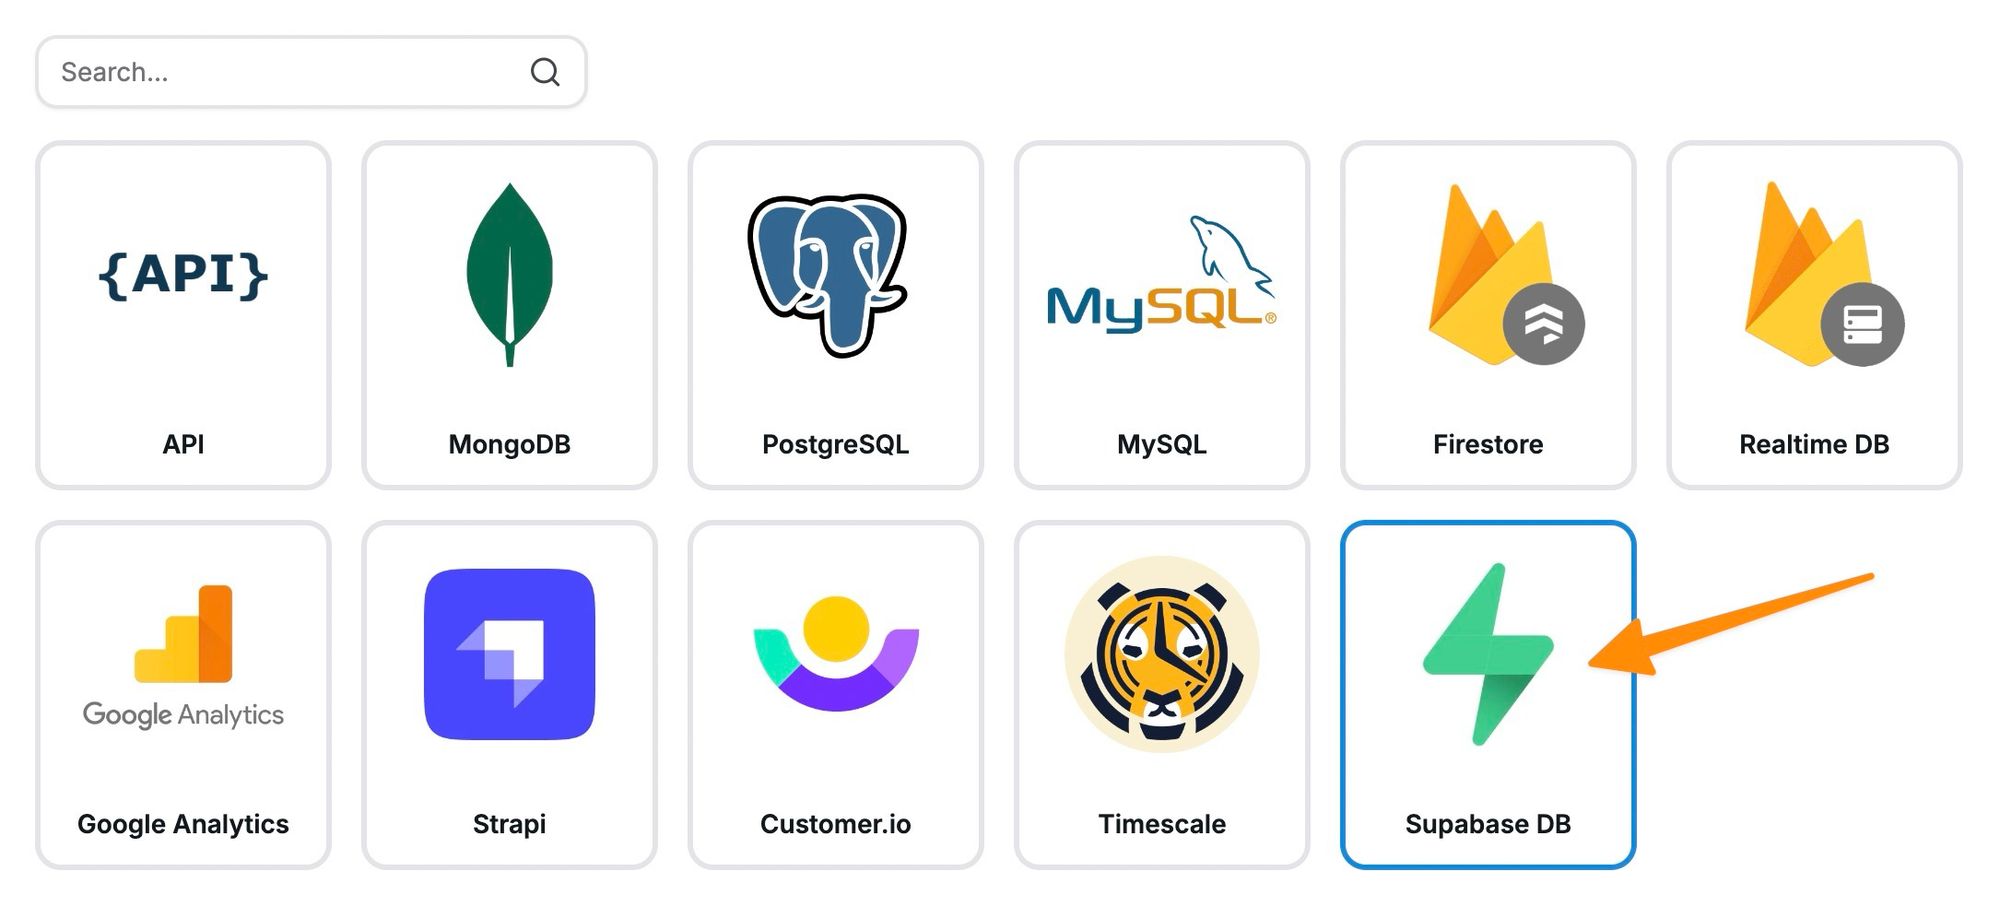
Now that Supabase is all set up with a read-only user, we can create a new connection in Chartbrew. Head to the new connection screen and select Supabase DB from the list.
We are going to use the URI of the database to connect. We can get the URI from the project settings like before:
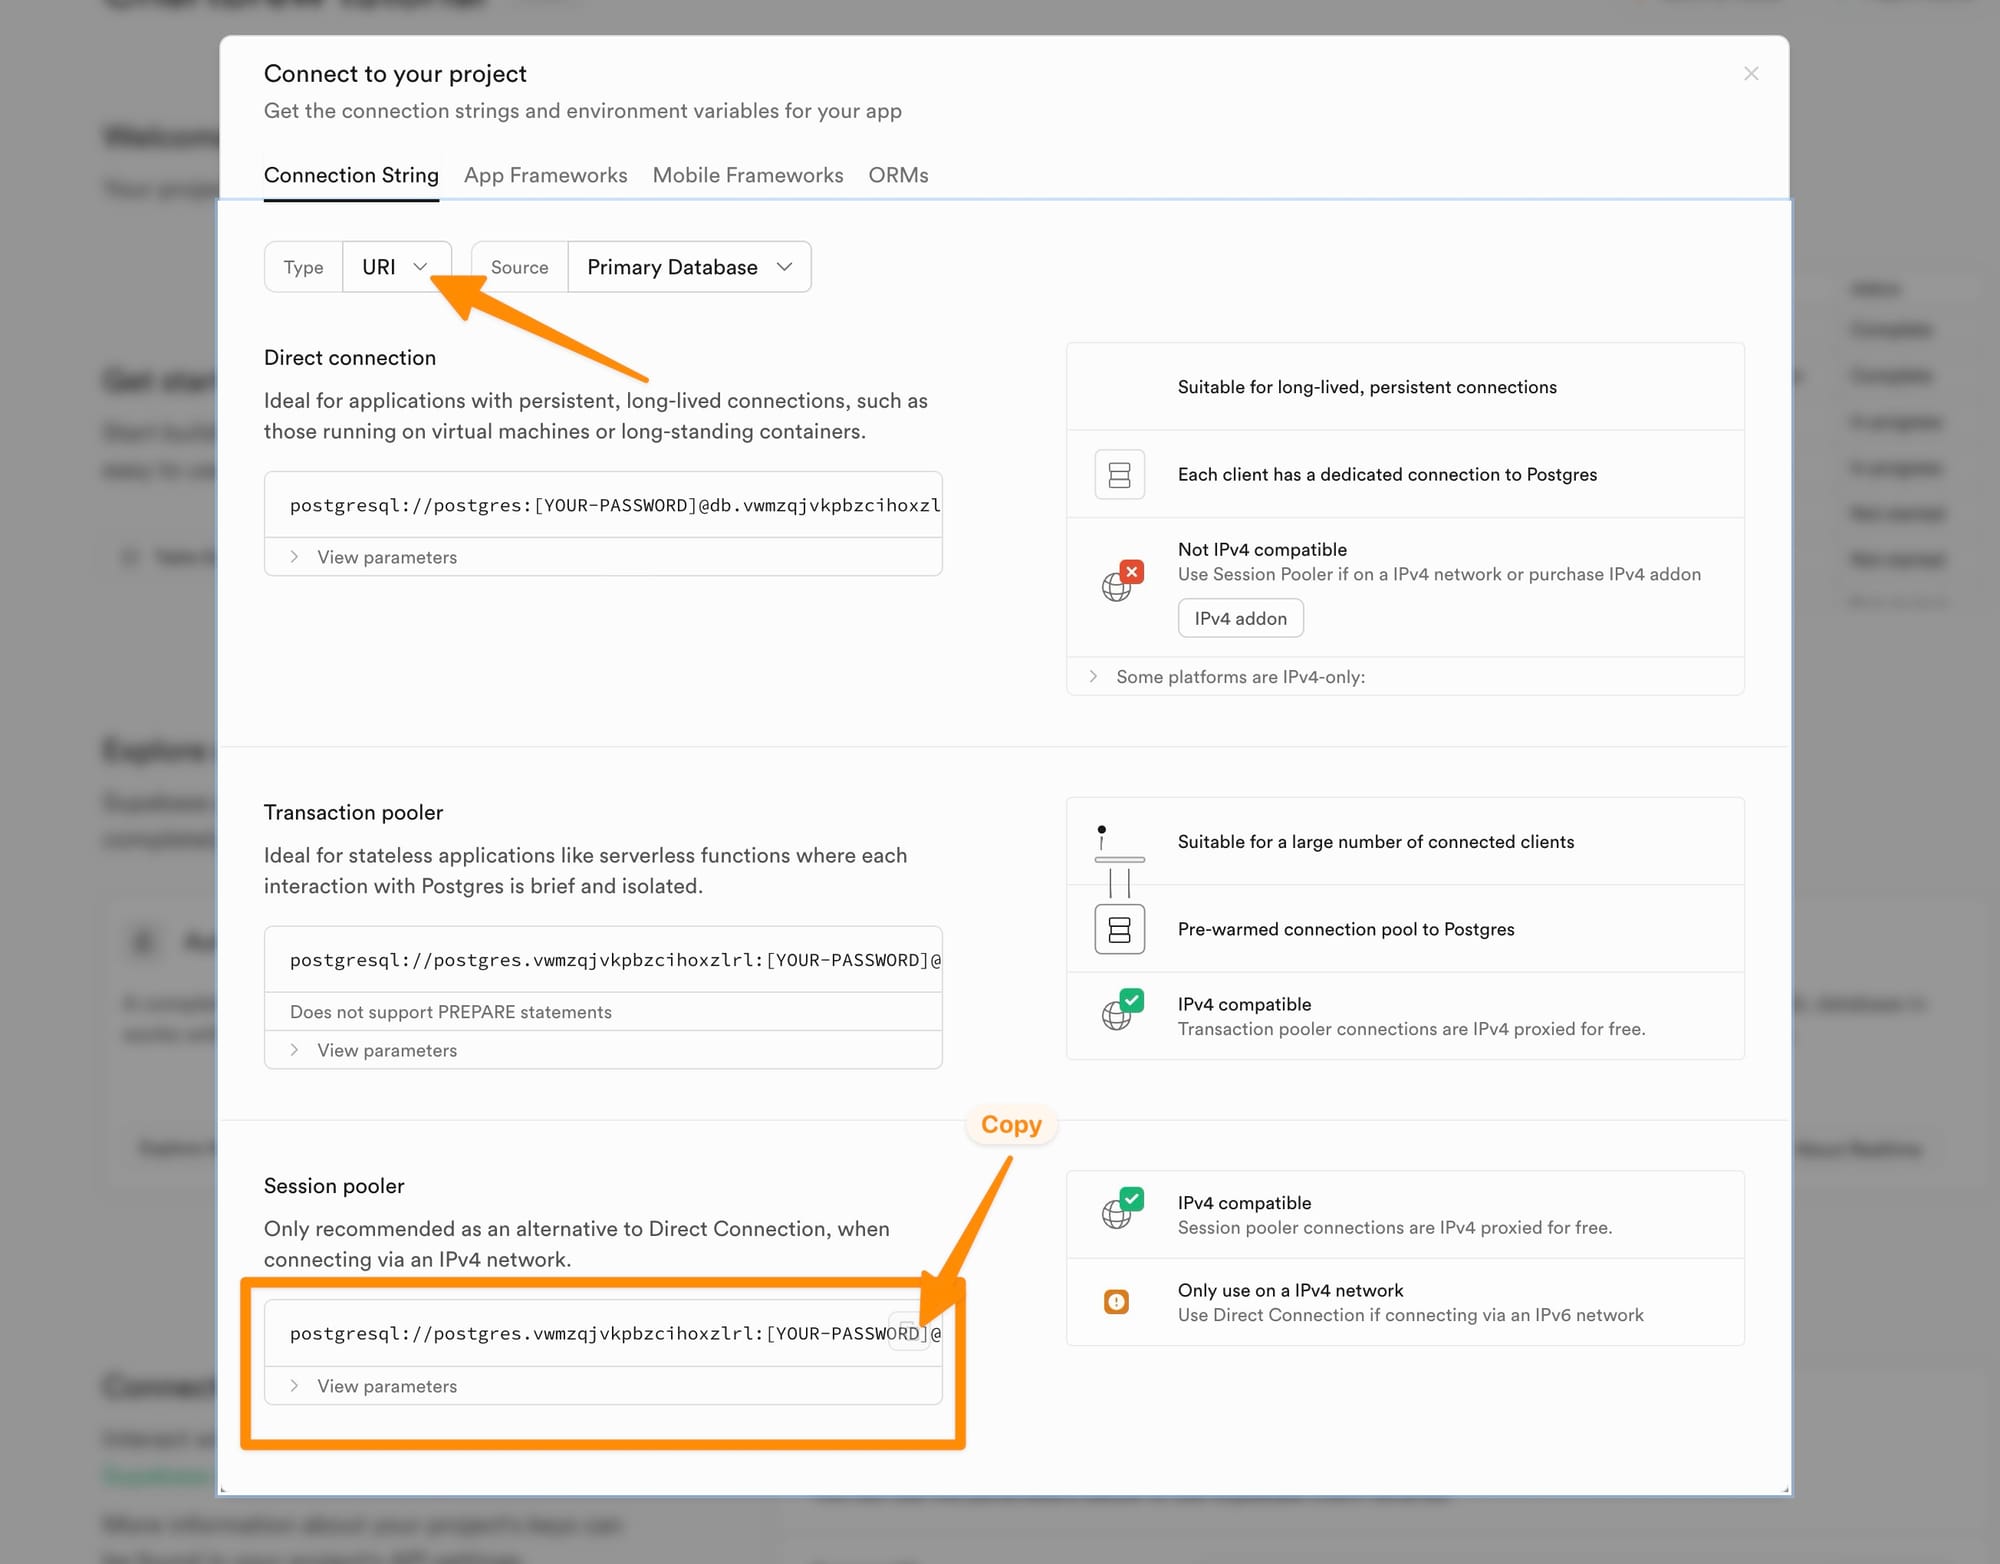
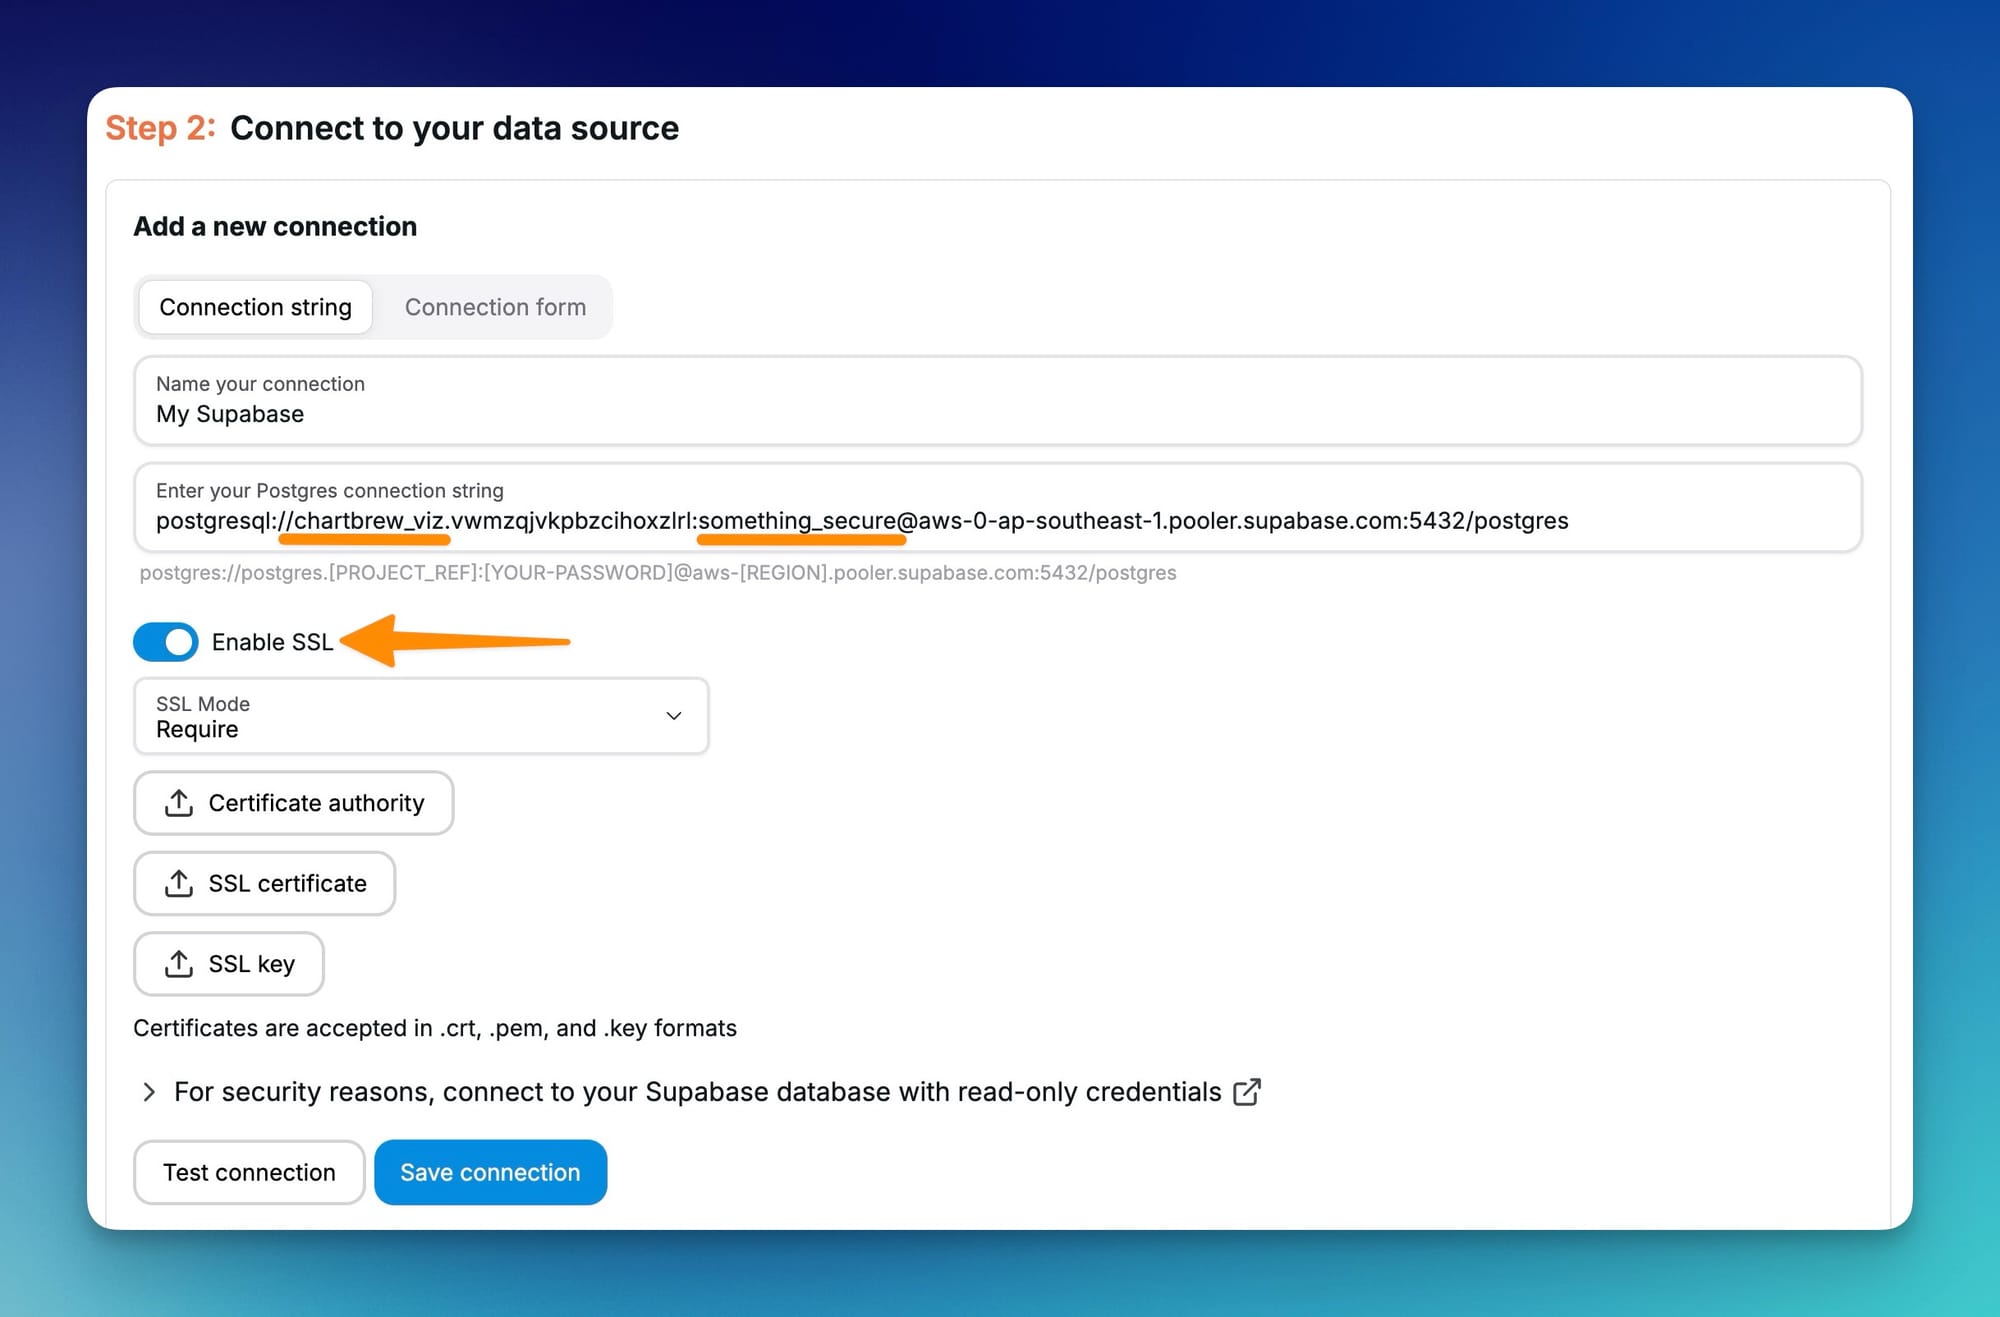
Copy the URI string to Chartbrew, replace the username (postgres) with chartbrew_viz and the password you set during the user creation process in psql. Depending on your SSL configuration, you might need to enable SSL mode and add your certificate to Chartbrew. Finally, test the connection, and if it works press the Save button.
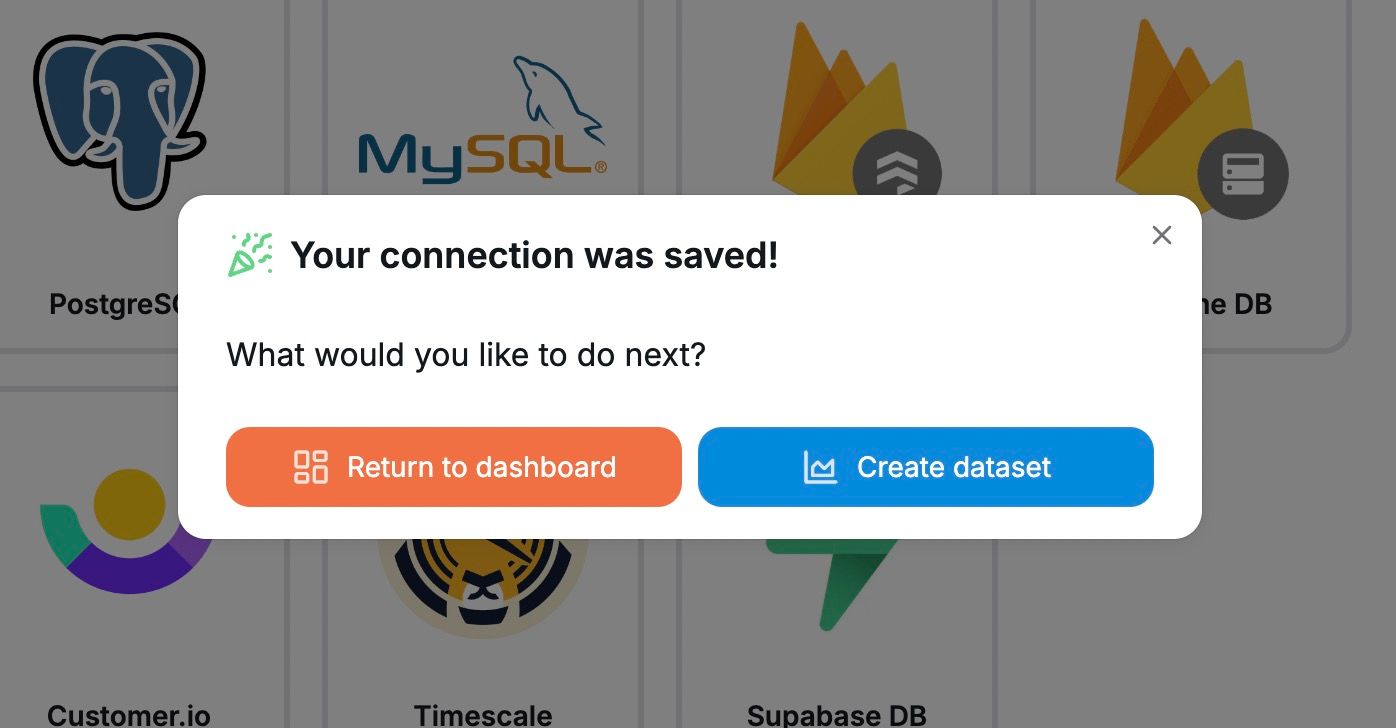
Now let's proceed and create our first dataset!
Visualize Supabase data with Chartbrew
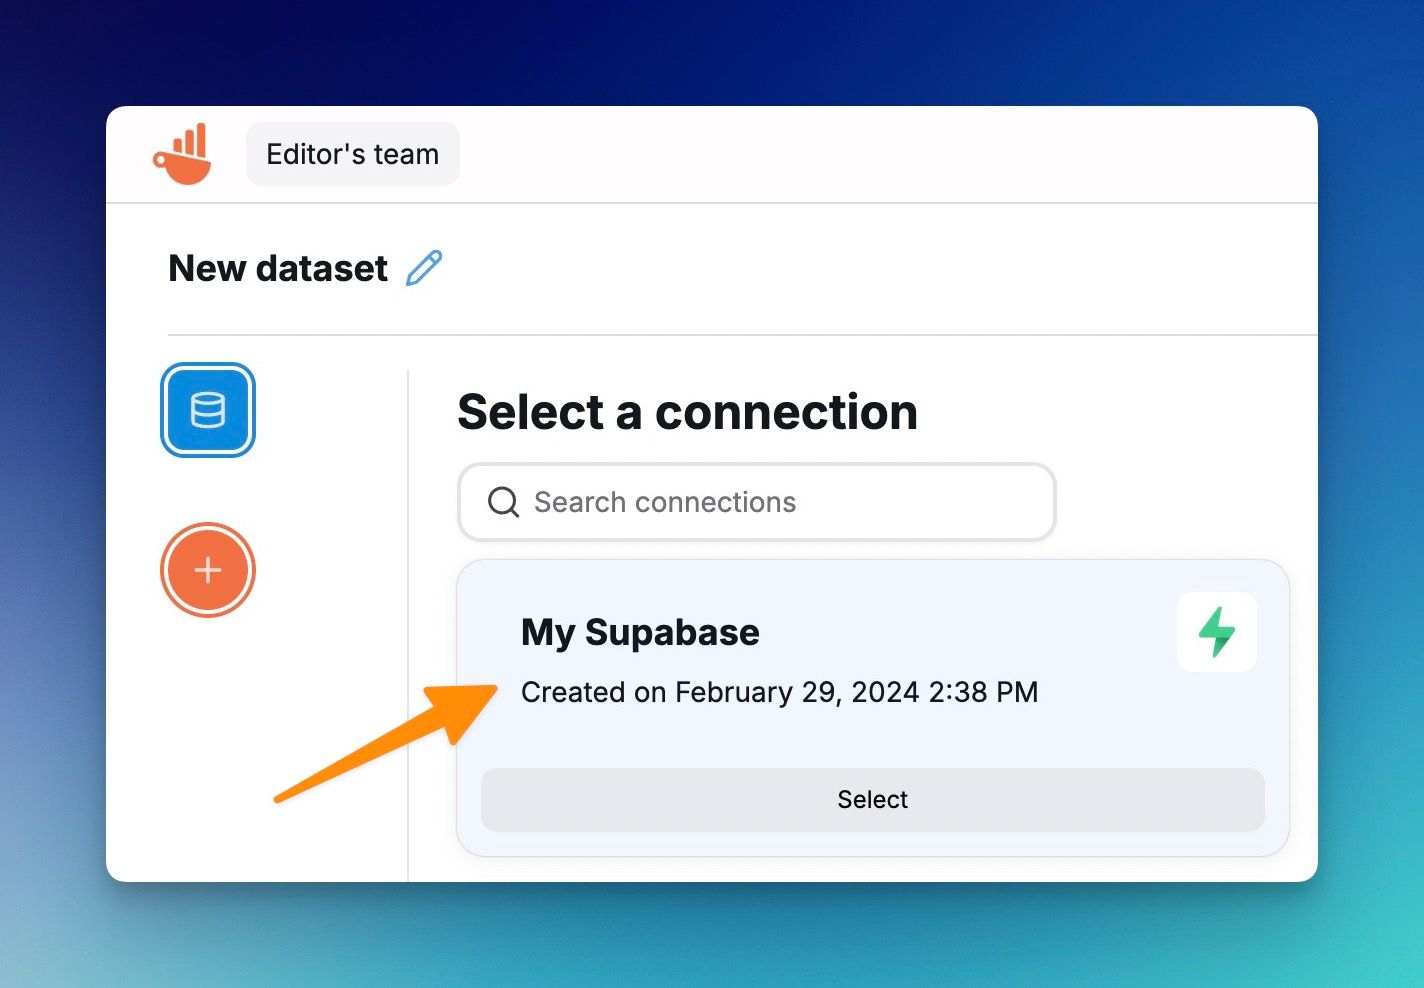
In Chartbrew, we first start with datasets. The datasets are made out of queries to different data sources. A dataset can even join data from multiple sources of different types. For example, you can join data from Supabase with customers from Stripe's API and so on. In this example, our dataset will just query the messages table and display a simple counter. When creating a new dataset, we first need to select the first connection:
The next screen will prompt for a SQL query to fetch the data from the Supabase. The quickstart database from Supabase has a messages table seeded with a bit of data so let's try to query that one.
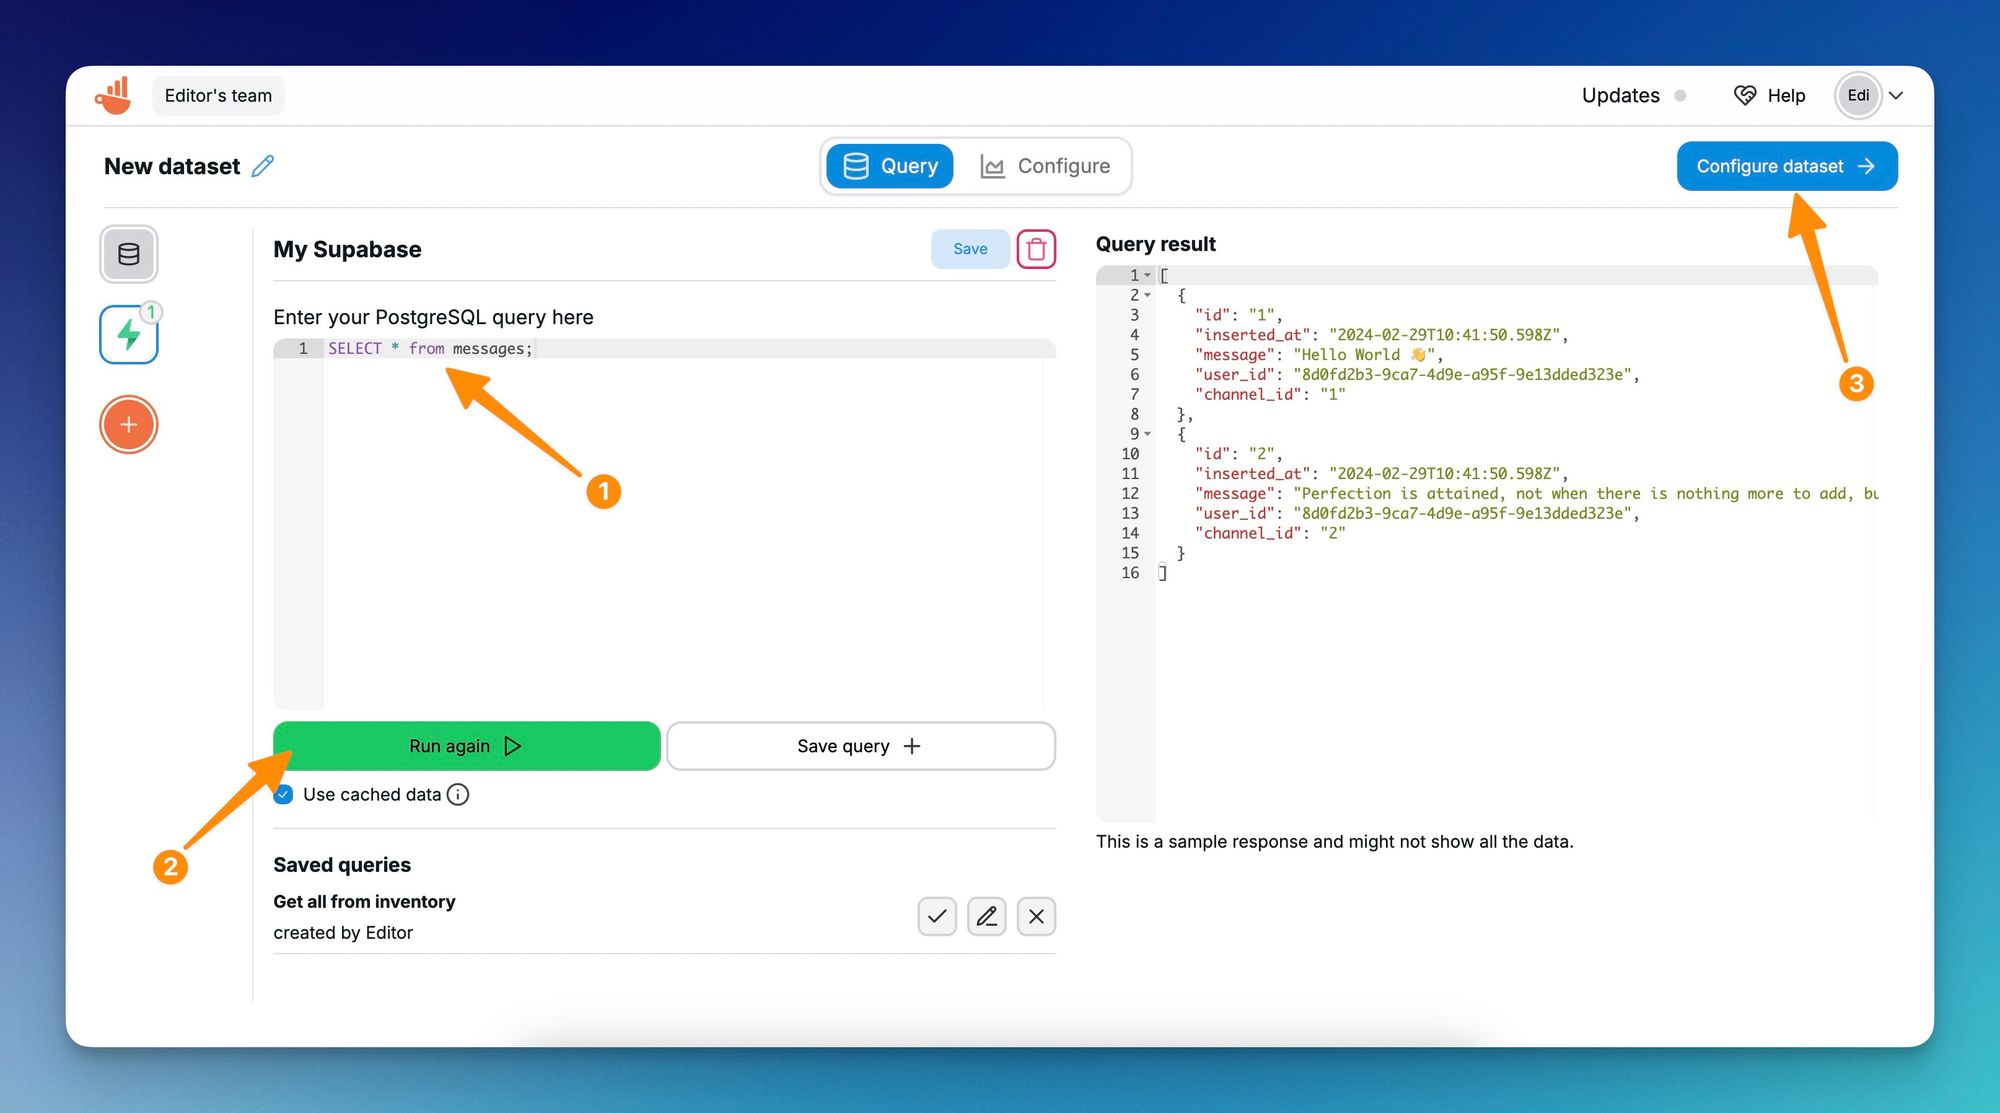
Once we have some data in the Query result panel, we can continue to configure the dataset and preview different visualizations.
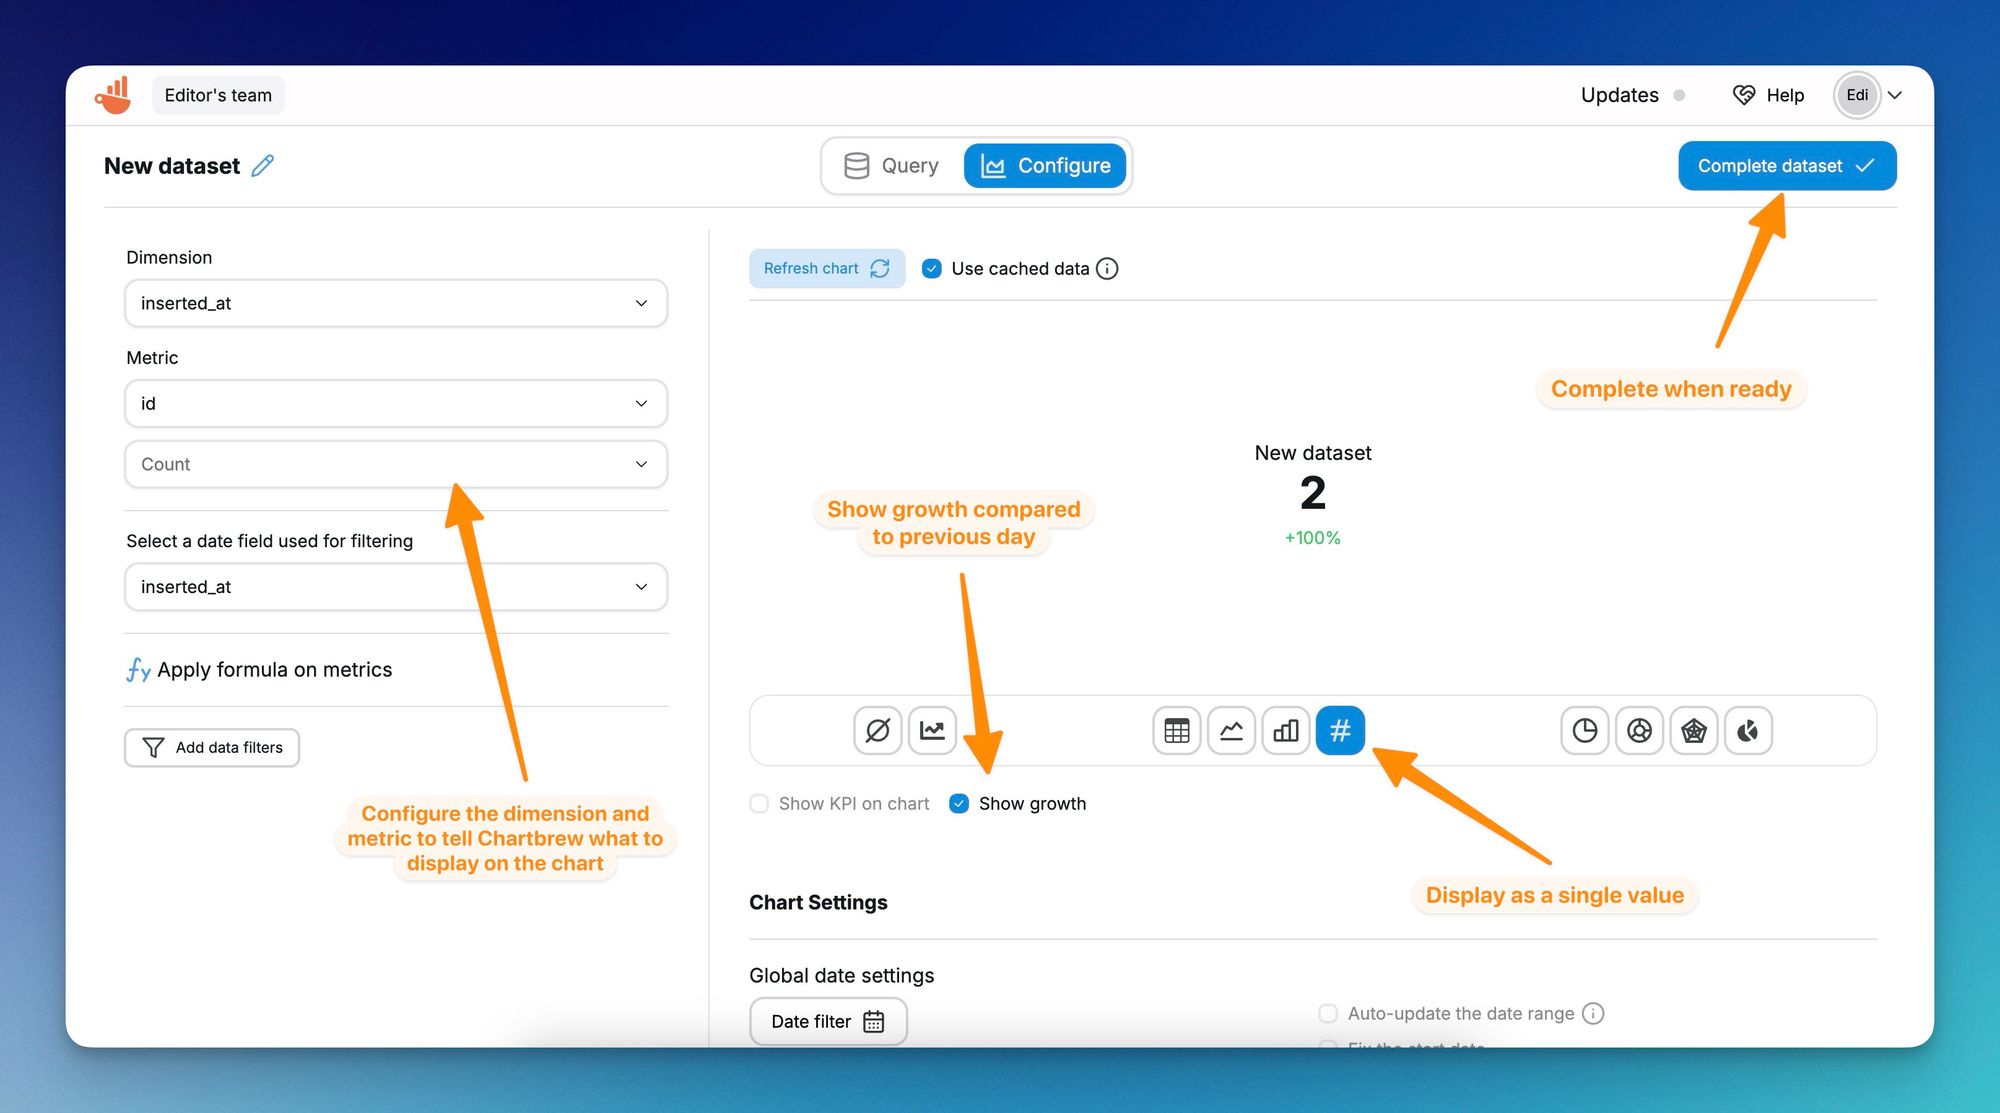
The configuration screen is the place you select the metric and dimension for your visualizations, filters, and preview potential charts. The preview section is only temporary and these can be changed at any time in charts that use the dataset. Charts that use the same dataset can be configured differently, so for example, the same dataset can be displayed as a line, bar, or any other type of widget.
When completing the dataset, you have the option to create a new chart with the last configuration and place it in one of your dashboards. Alternatively, you can just save the dataset and create the chart later. In this instance, we are going to add the KPI in one of our projects to see how it looks next to the others.
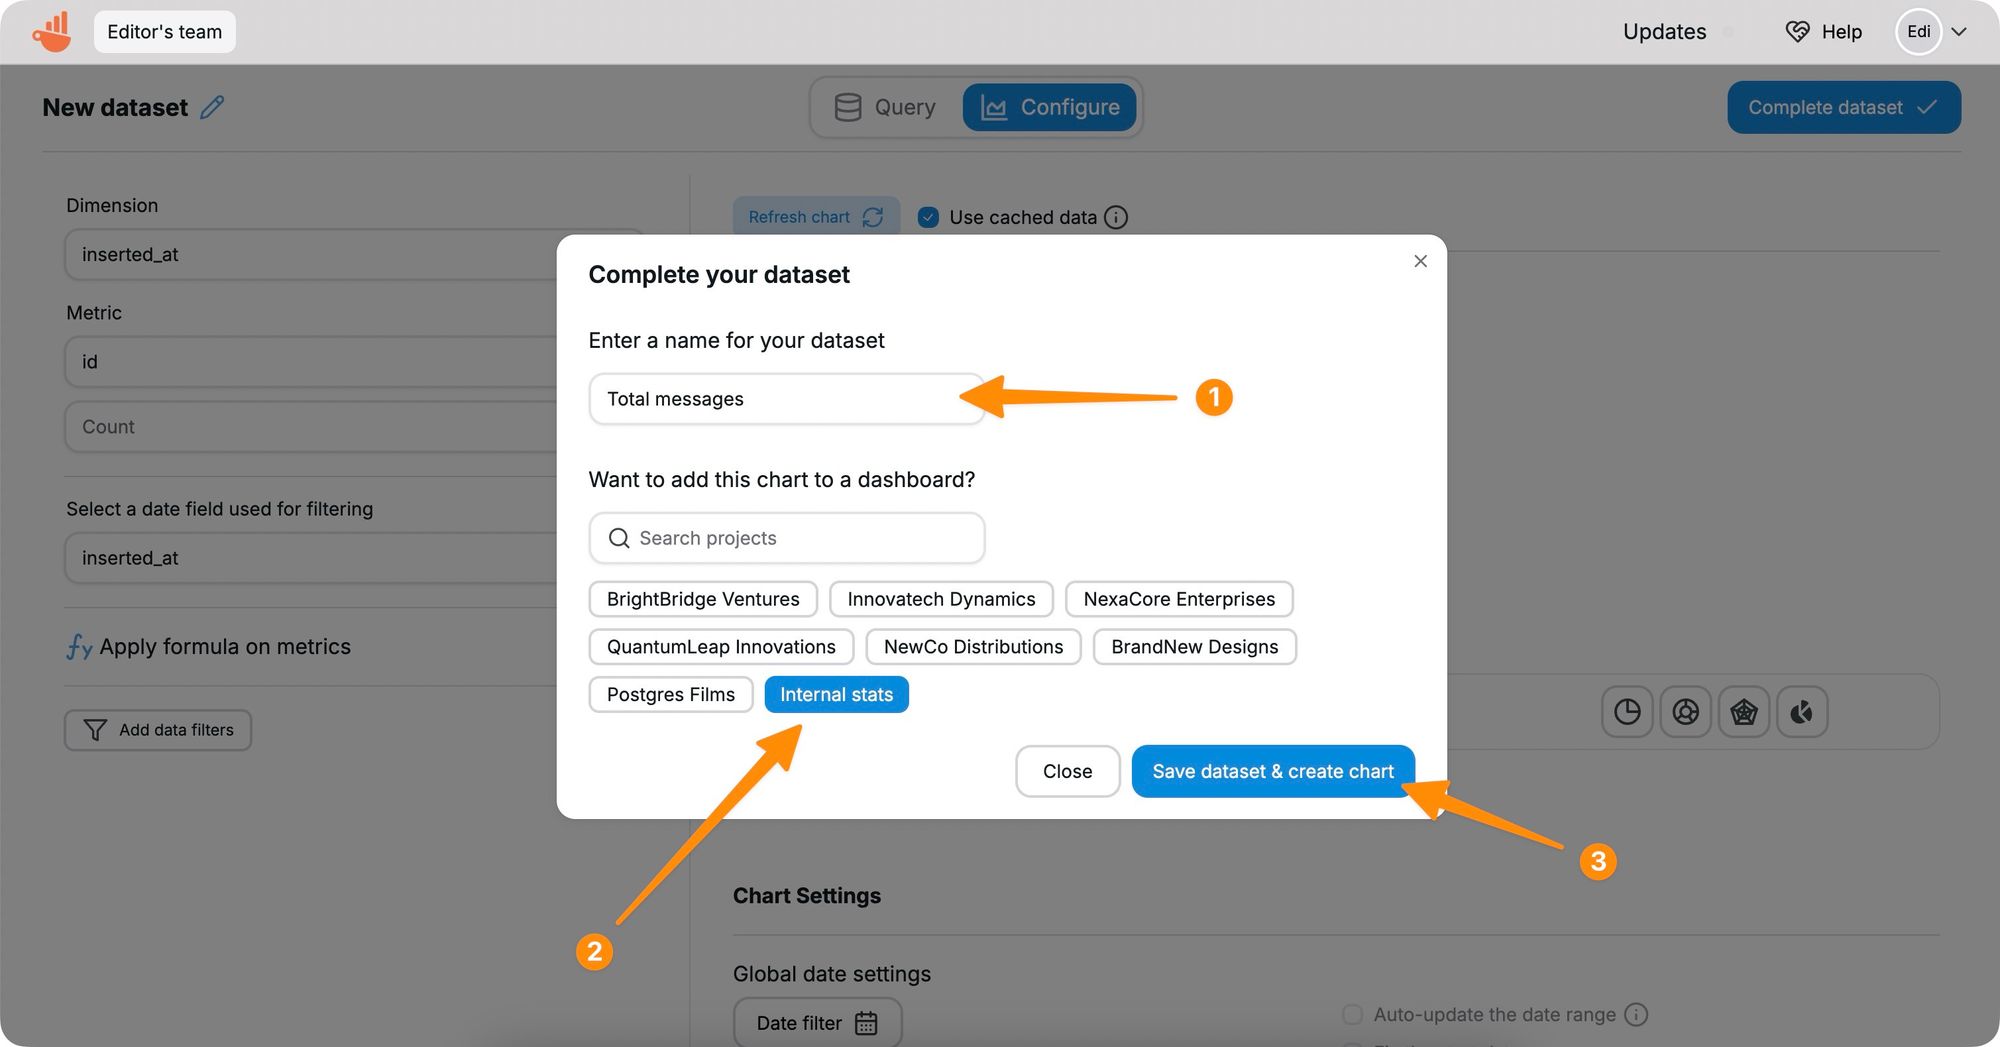
When placing the chart in an already existing dashboard, the dataset will be saved as part of your Chartbrew team and the chart will be created automatically with the settings you selected in the configuration screen.
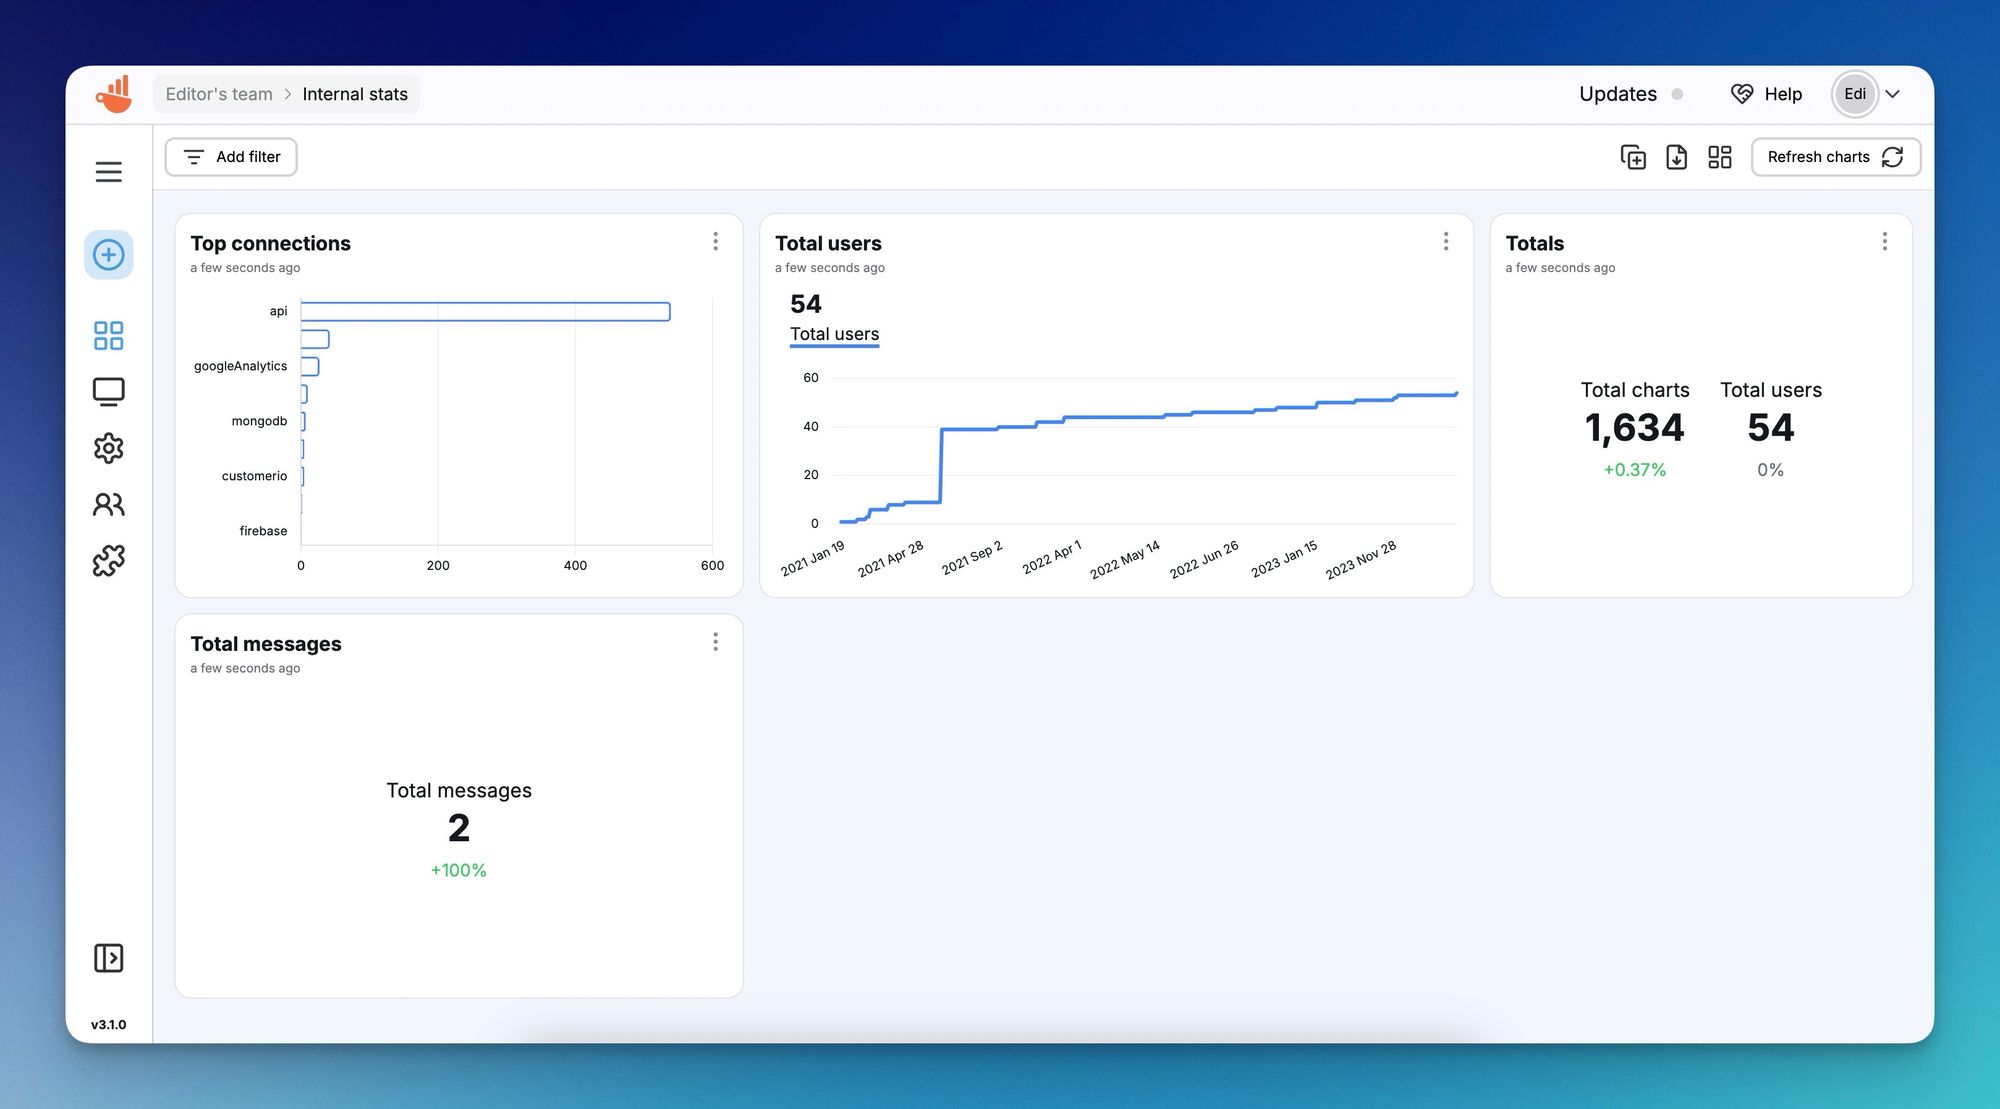
And that's it! You can create as many charts as you want now and separate them in different dashboards, set them to keep your data updated and much more!
Next steps
Now that you have the Supabase connection in place, you can go ahead and create multiple datasets to enable you and your team to create visualizations to monitor the data or create client reports for your stakeholders.
The real value of Chartbrew is when different data source are combined on the same dashboards. Try connecting more of your services using the range of integrations available in Chartbrew. You can then customize the client reports to be shared with your clients. You can even invite your clients to Chartbrew and they can customize the look of the dashboard assigned to them.
If you didn't try Chartbrew already, try it out for free by starting your 14-day trial.
