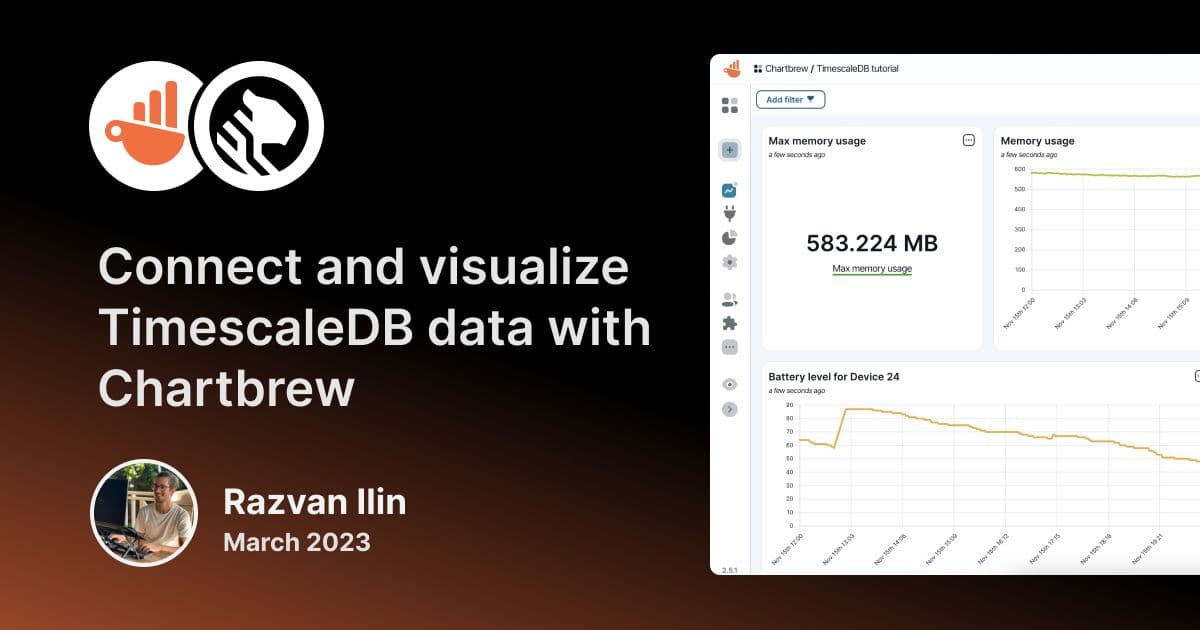
Connect and visualize TimescaleDB data with Chartbrew
Learn how to connect Timescale databases to Chartbrew and create powerful visualization dashboards and reports to monitor and share with others.
Tutorials, product updates, and reporting guides for connecting your data to Chartbrew and building clear client-facing dashboards.
Page 3 of 6

Learn how to connect Timescale databases to Chartbrew and create powerful visualization dashboards and reports to monitor and share with others.

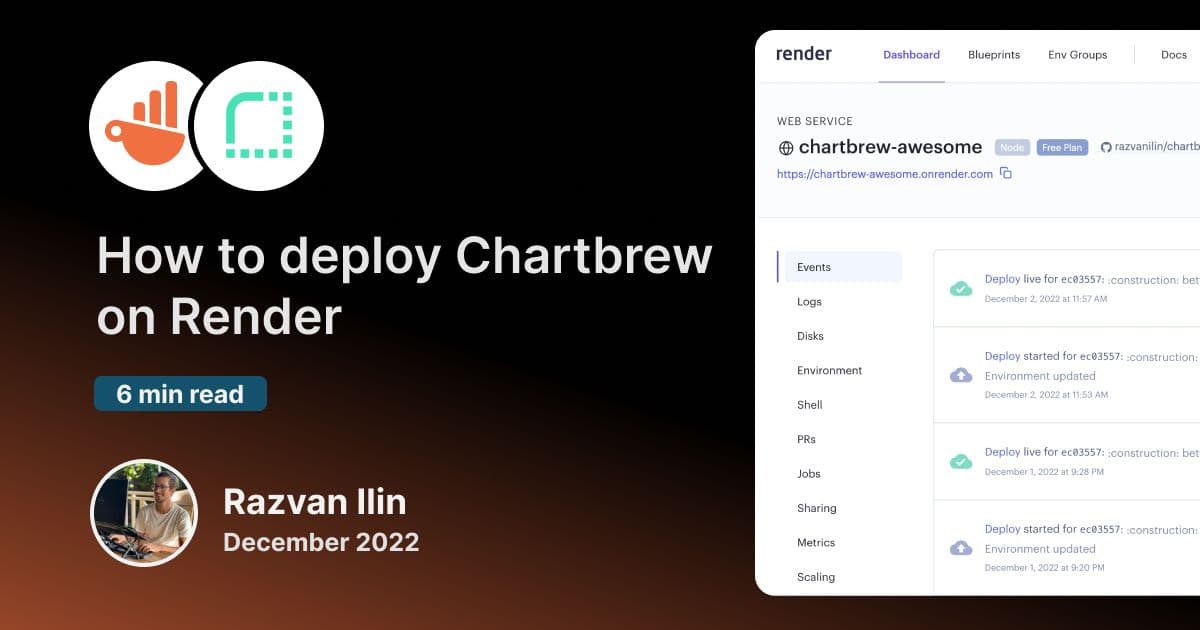
You can use Render to deploy your Chartbrew application for free. This tutorial will show you all the steps to get your visualization stack up and running.

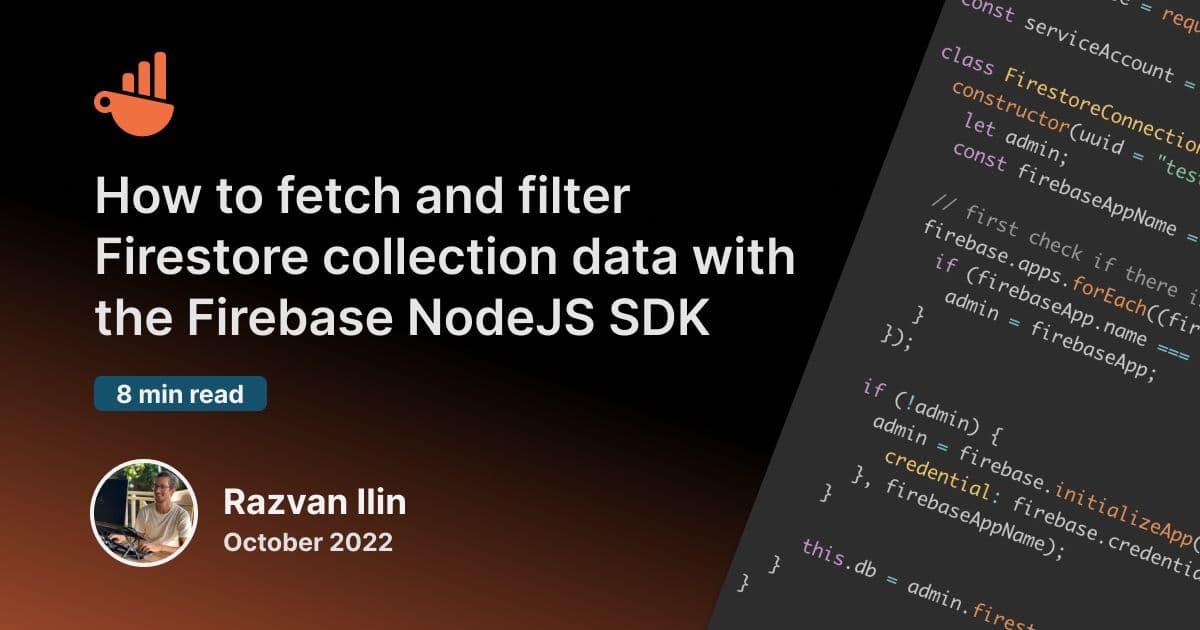
Getting Firestore data in the right format can be a tedious task. This blog post will show you how to fetch, filter, and flatten your data

It took almost 2 years' worth of work to get to v2 from the initial out of Beta in November 2020. The new version is a culmination of updates added to the platform during this time and a complete UI re-design to modernize the look and feel

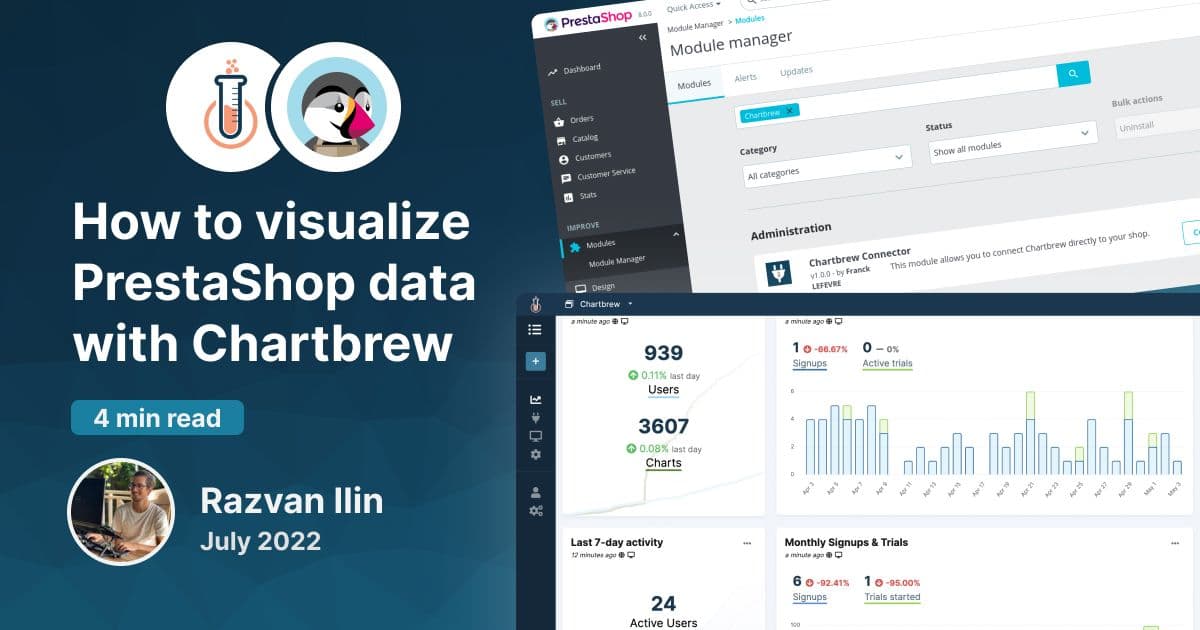
Learn how to create charts and visualize your PrestaShop data to make better business decisions.

Chartbrew API Keys are useful when fetching or creating Chartbrew content from another application. Find out how to create them in this tutorial.

Chartbrew offers a ChartMogul dashboard template that can be used to create charts almost instantly. This tutorial will show you how to get started.

Strapi is a headless content management system used by many businesses worldwide. Chartbrew can connect to its API to visualize and monitor data
Ready to start
Connect your data, build live dashboards, and give your team one place to check the numbers that matter.