
If you're using Baserow, an open-source and online database, to manage your data, you might be looking for ways to make sense of your data with charts and dashboards. Chartbrew is a powerful tool that allows you to visualize Baserow data and create real-time, interactive reports. This tutorial will guide you through the process of connecting Baserow to Chartbrew, fetching data through its REST API, handling pagination, and finally, creating insightful charts for your Baserow dashboard.
Baserow is often considered an Airtable alternative and Smartsheet alternative, offering flexibility and affordability compared to Airtable pricing. If you've been searching for the best way to create Baserow charts, you're in the right place.
Setting Up a New Connection to Baserow
Before we start, we need to connect Baserow to Chartbrew. Since Baserow provides an API, we can use it to fetch data and create live visualizations. The first step is to retrieve the necessary API information.
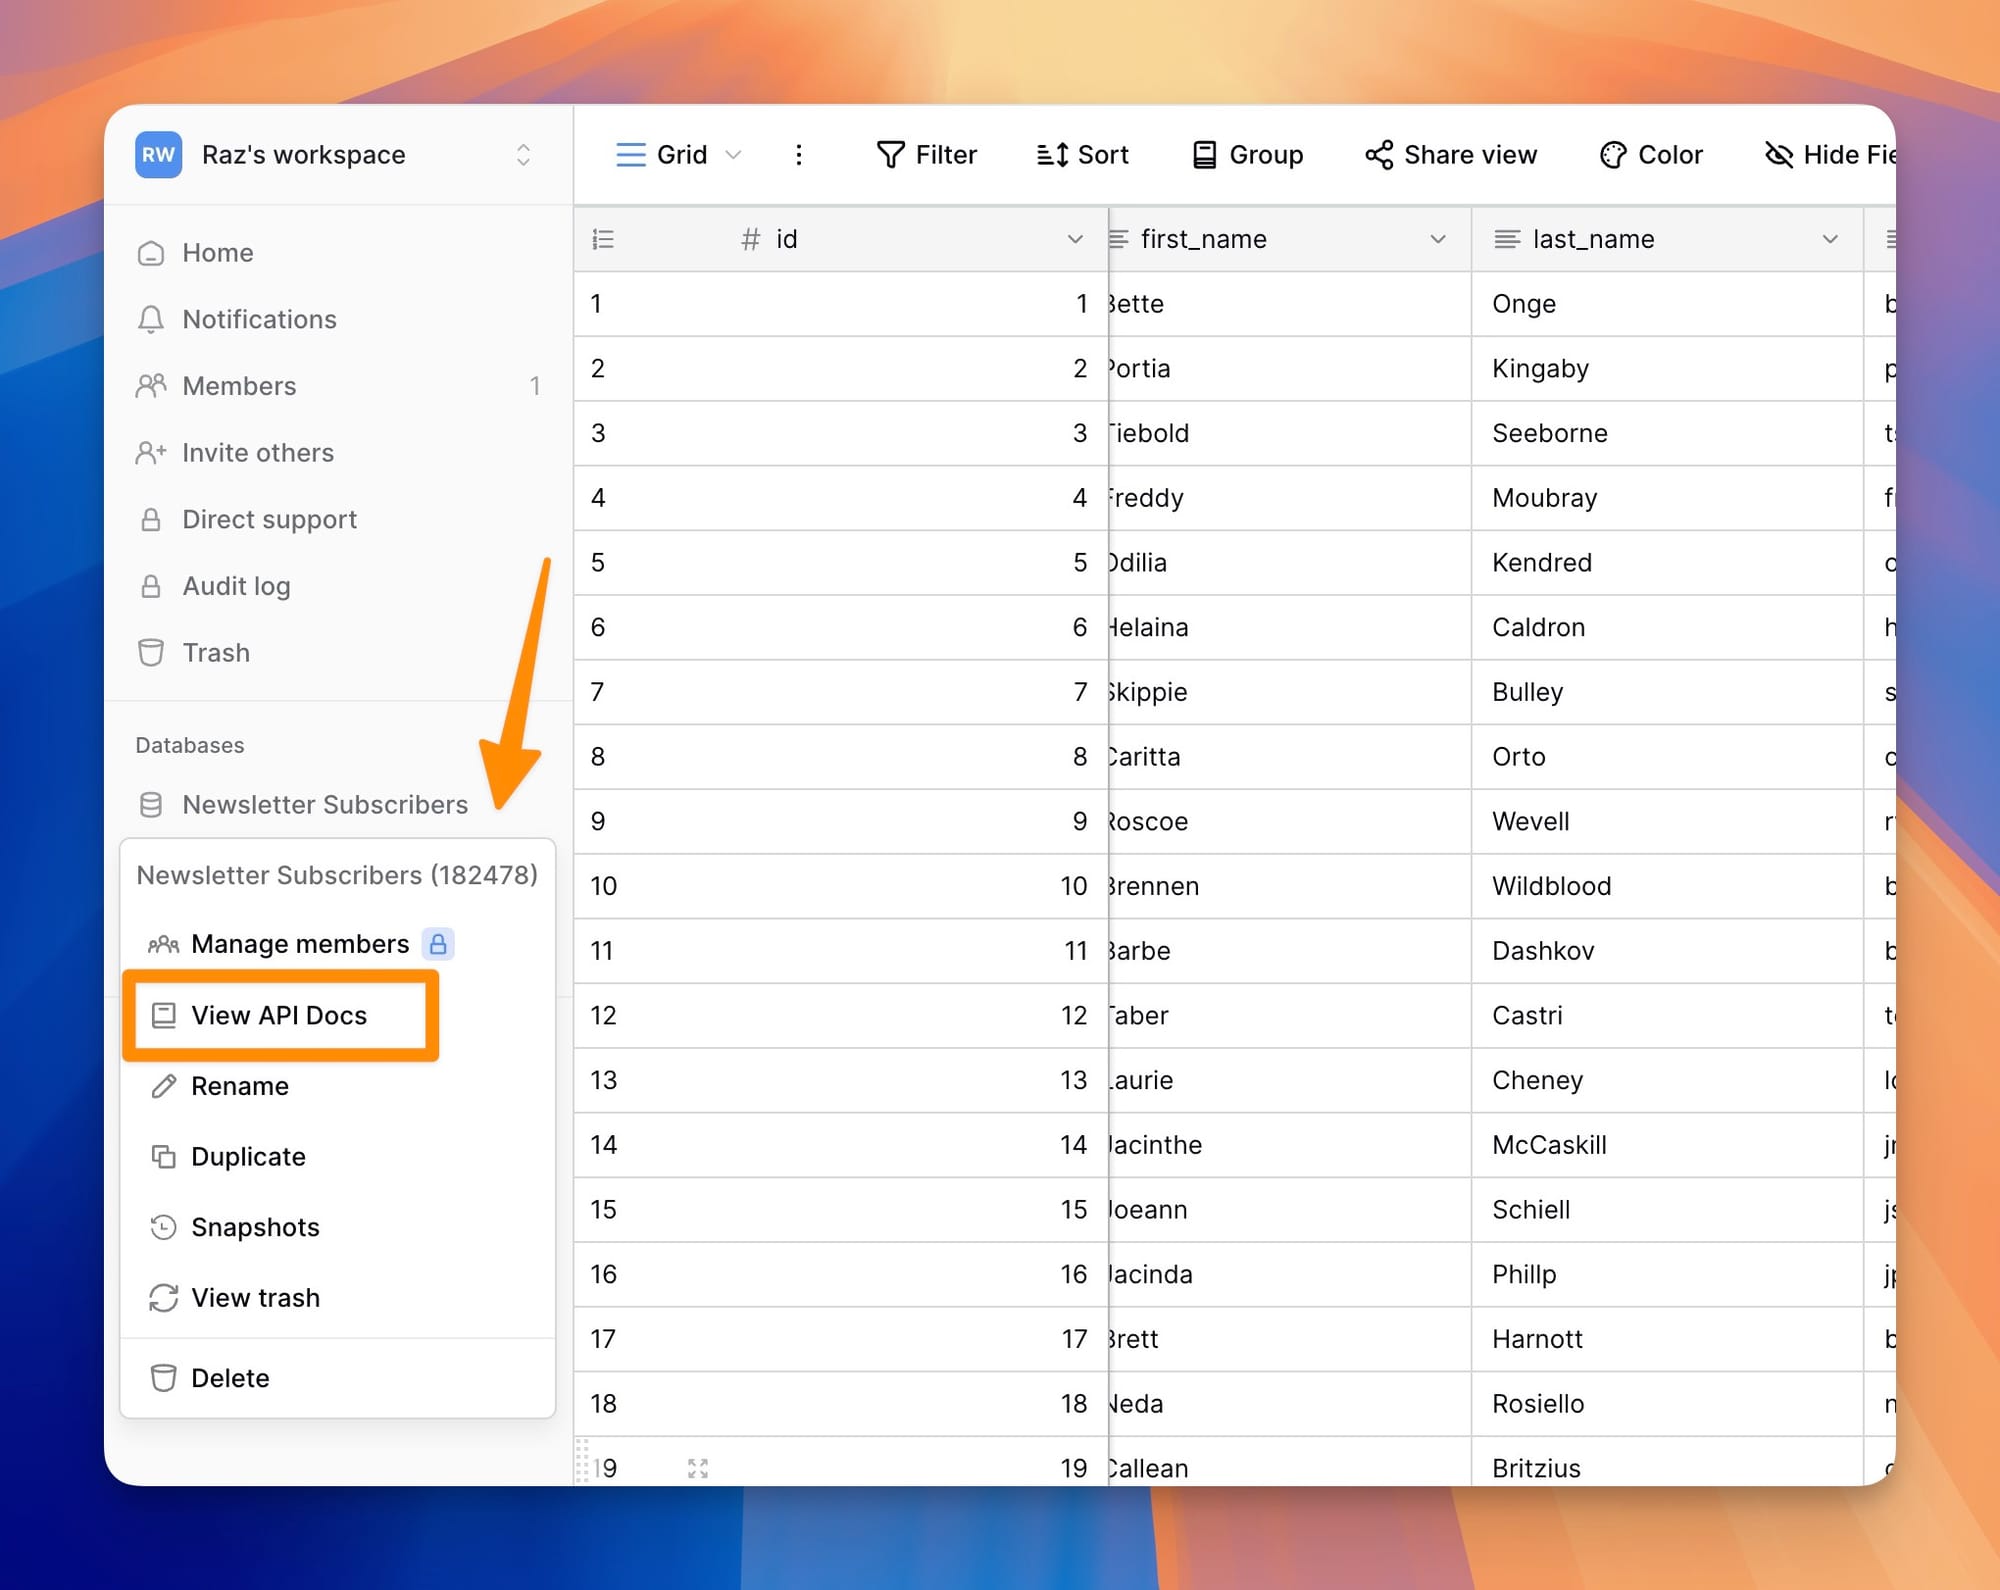
To begin, navigate to your Baserow instance and go to the API Docs page from the settings menu of your database.
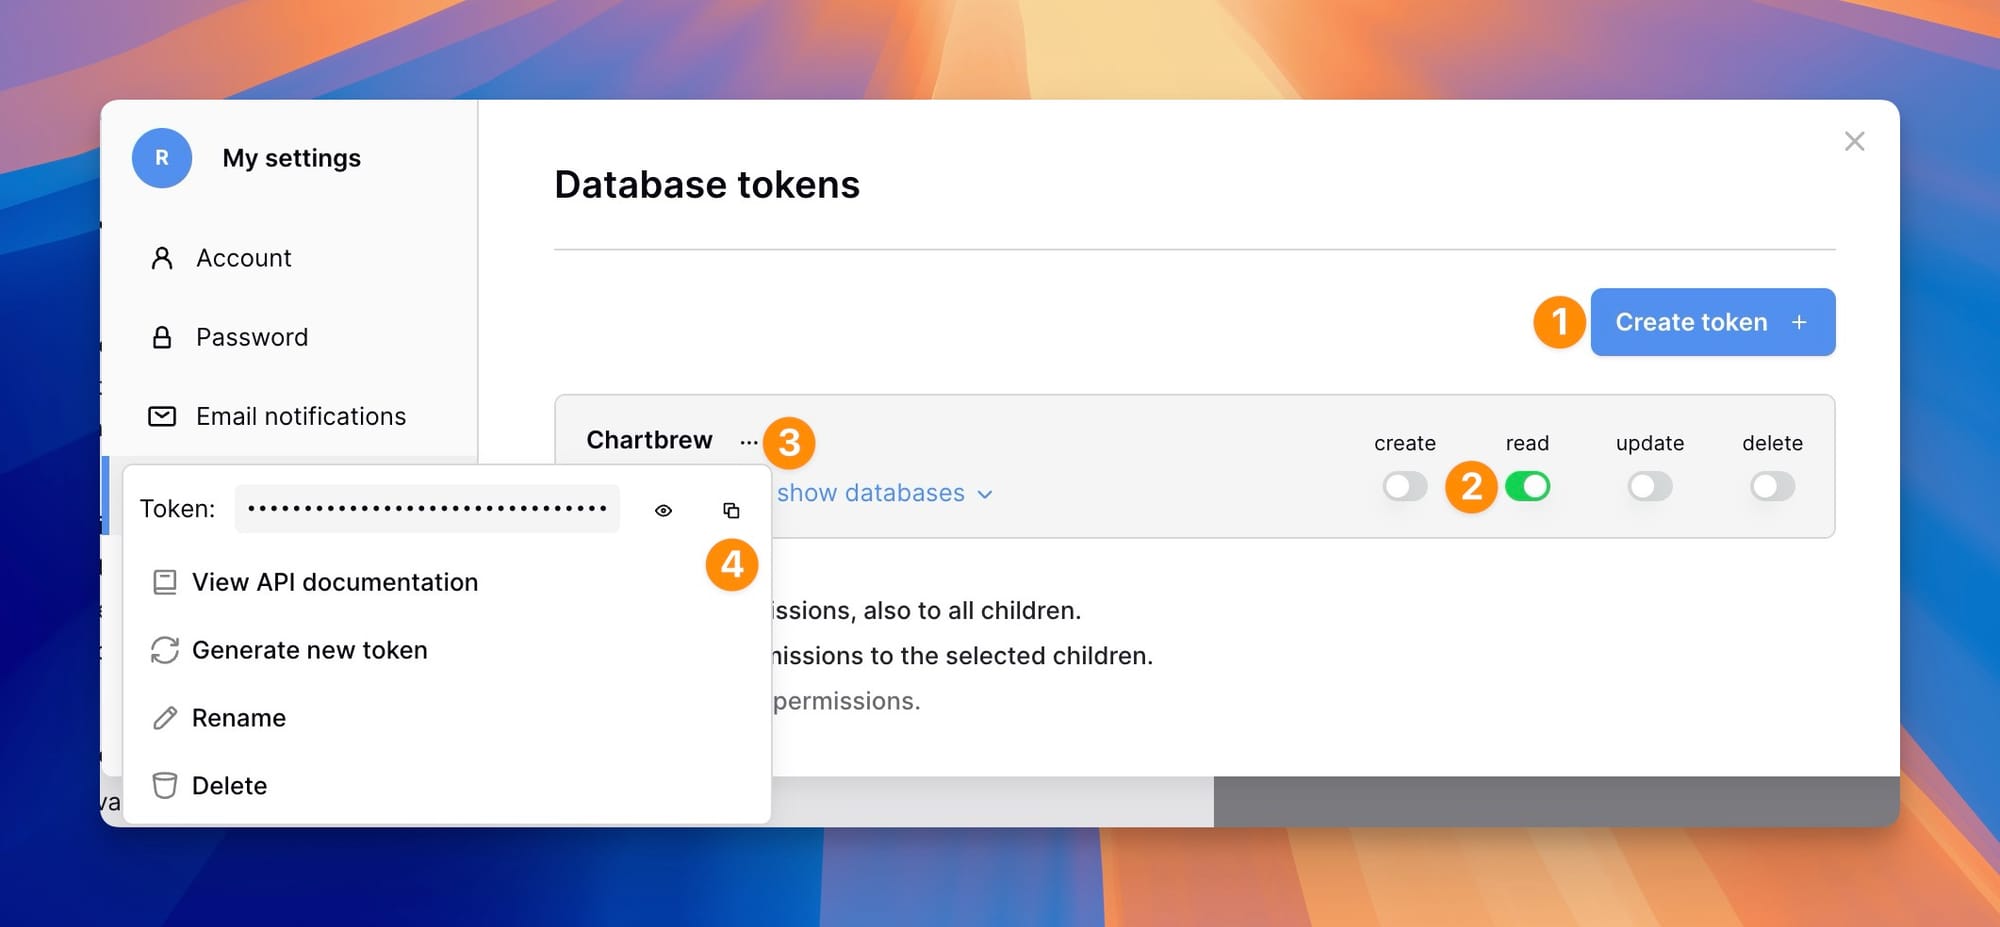
This section provides an overview of all available API endpoints. Before making any requests, you’ll need to generate an API key for authentication. Click on Settings, then create a new API key and copy it. When configuring permissions, ensure that you only select Read permissions to prevent any unintended modifications to your data.
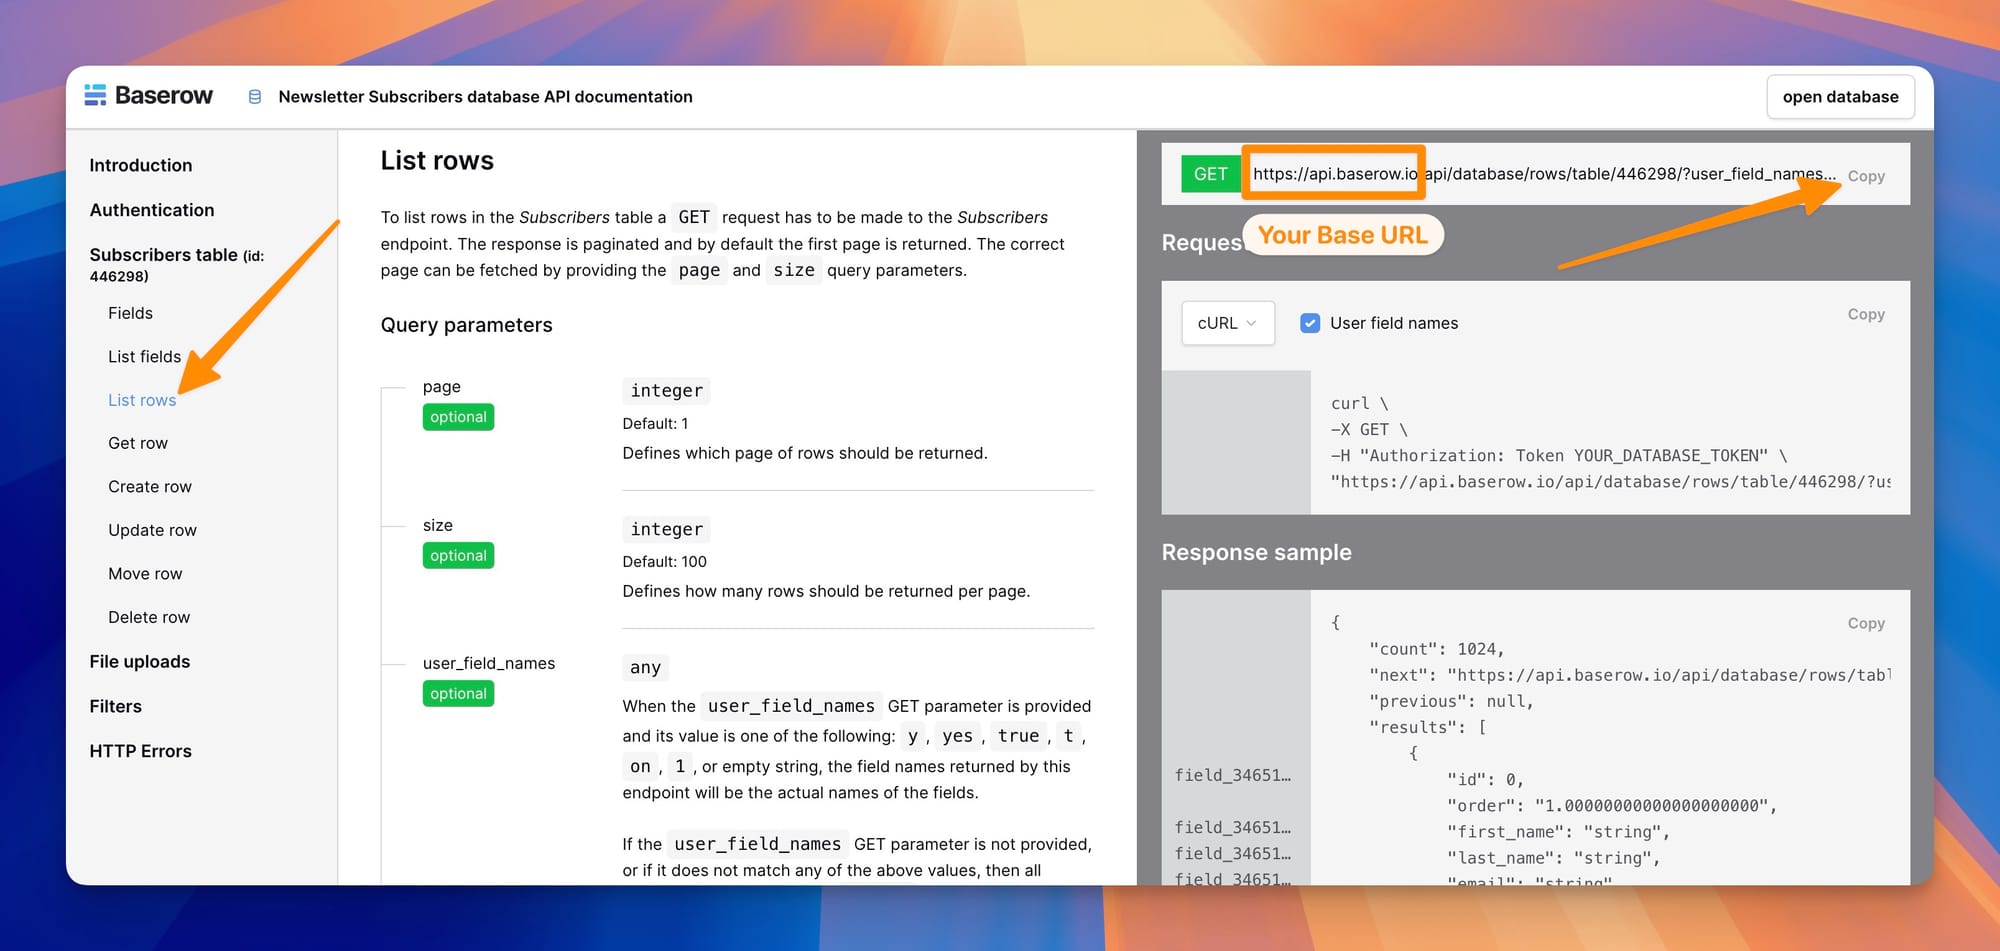
Once your API key is ready, navigate to the Database Documentation section. Locate the table you want to visualize and select the List Rows option. This will provide you with the API endpoint that allows you to fetch all the rows from that table. From this page, we can see the Base API URL and the path needed to fetch data from Chartbrew.
Now, open Chartbrew and go to the Connections tab. Click on Create new connection, select API, and enter a name for your connection. In the Base URL field, paste your Baserow API base URL. Next, add a new header with Authorization as the key and Token <your_api_token> as the value.
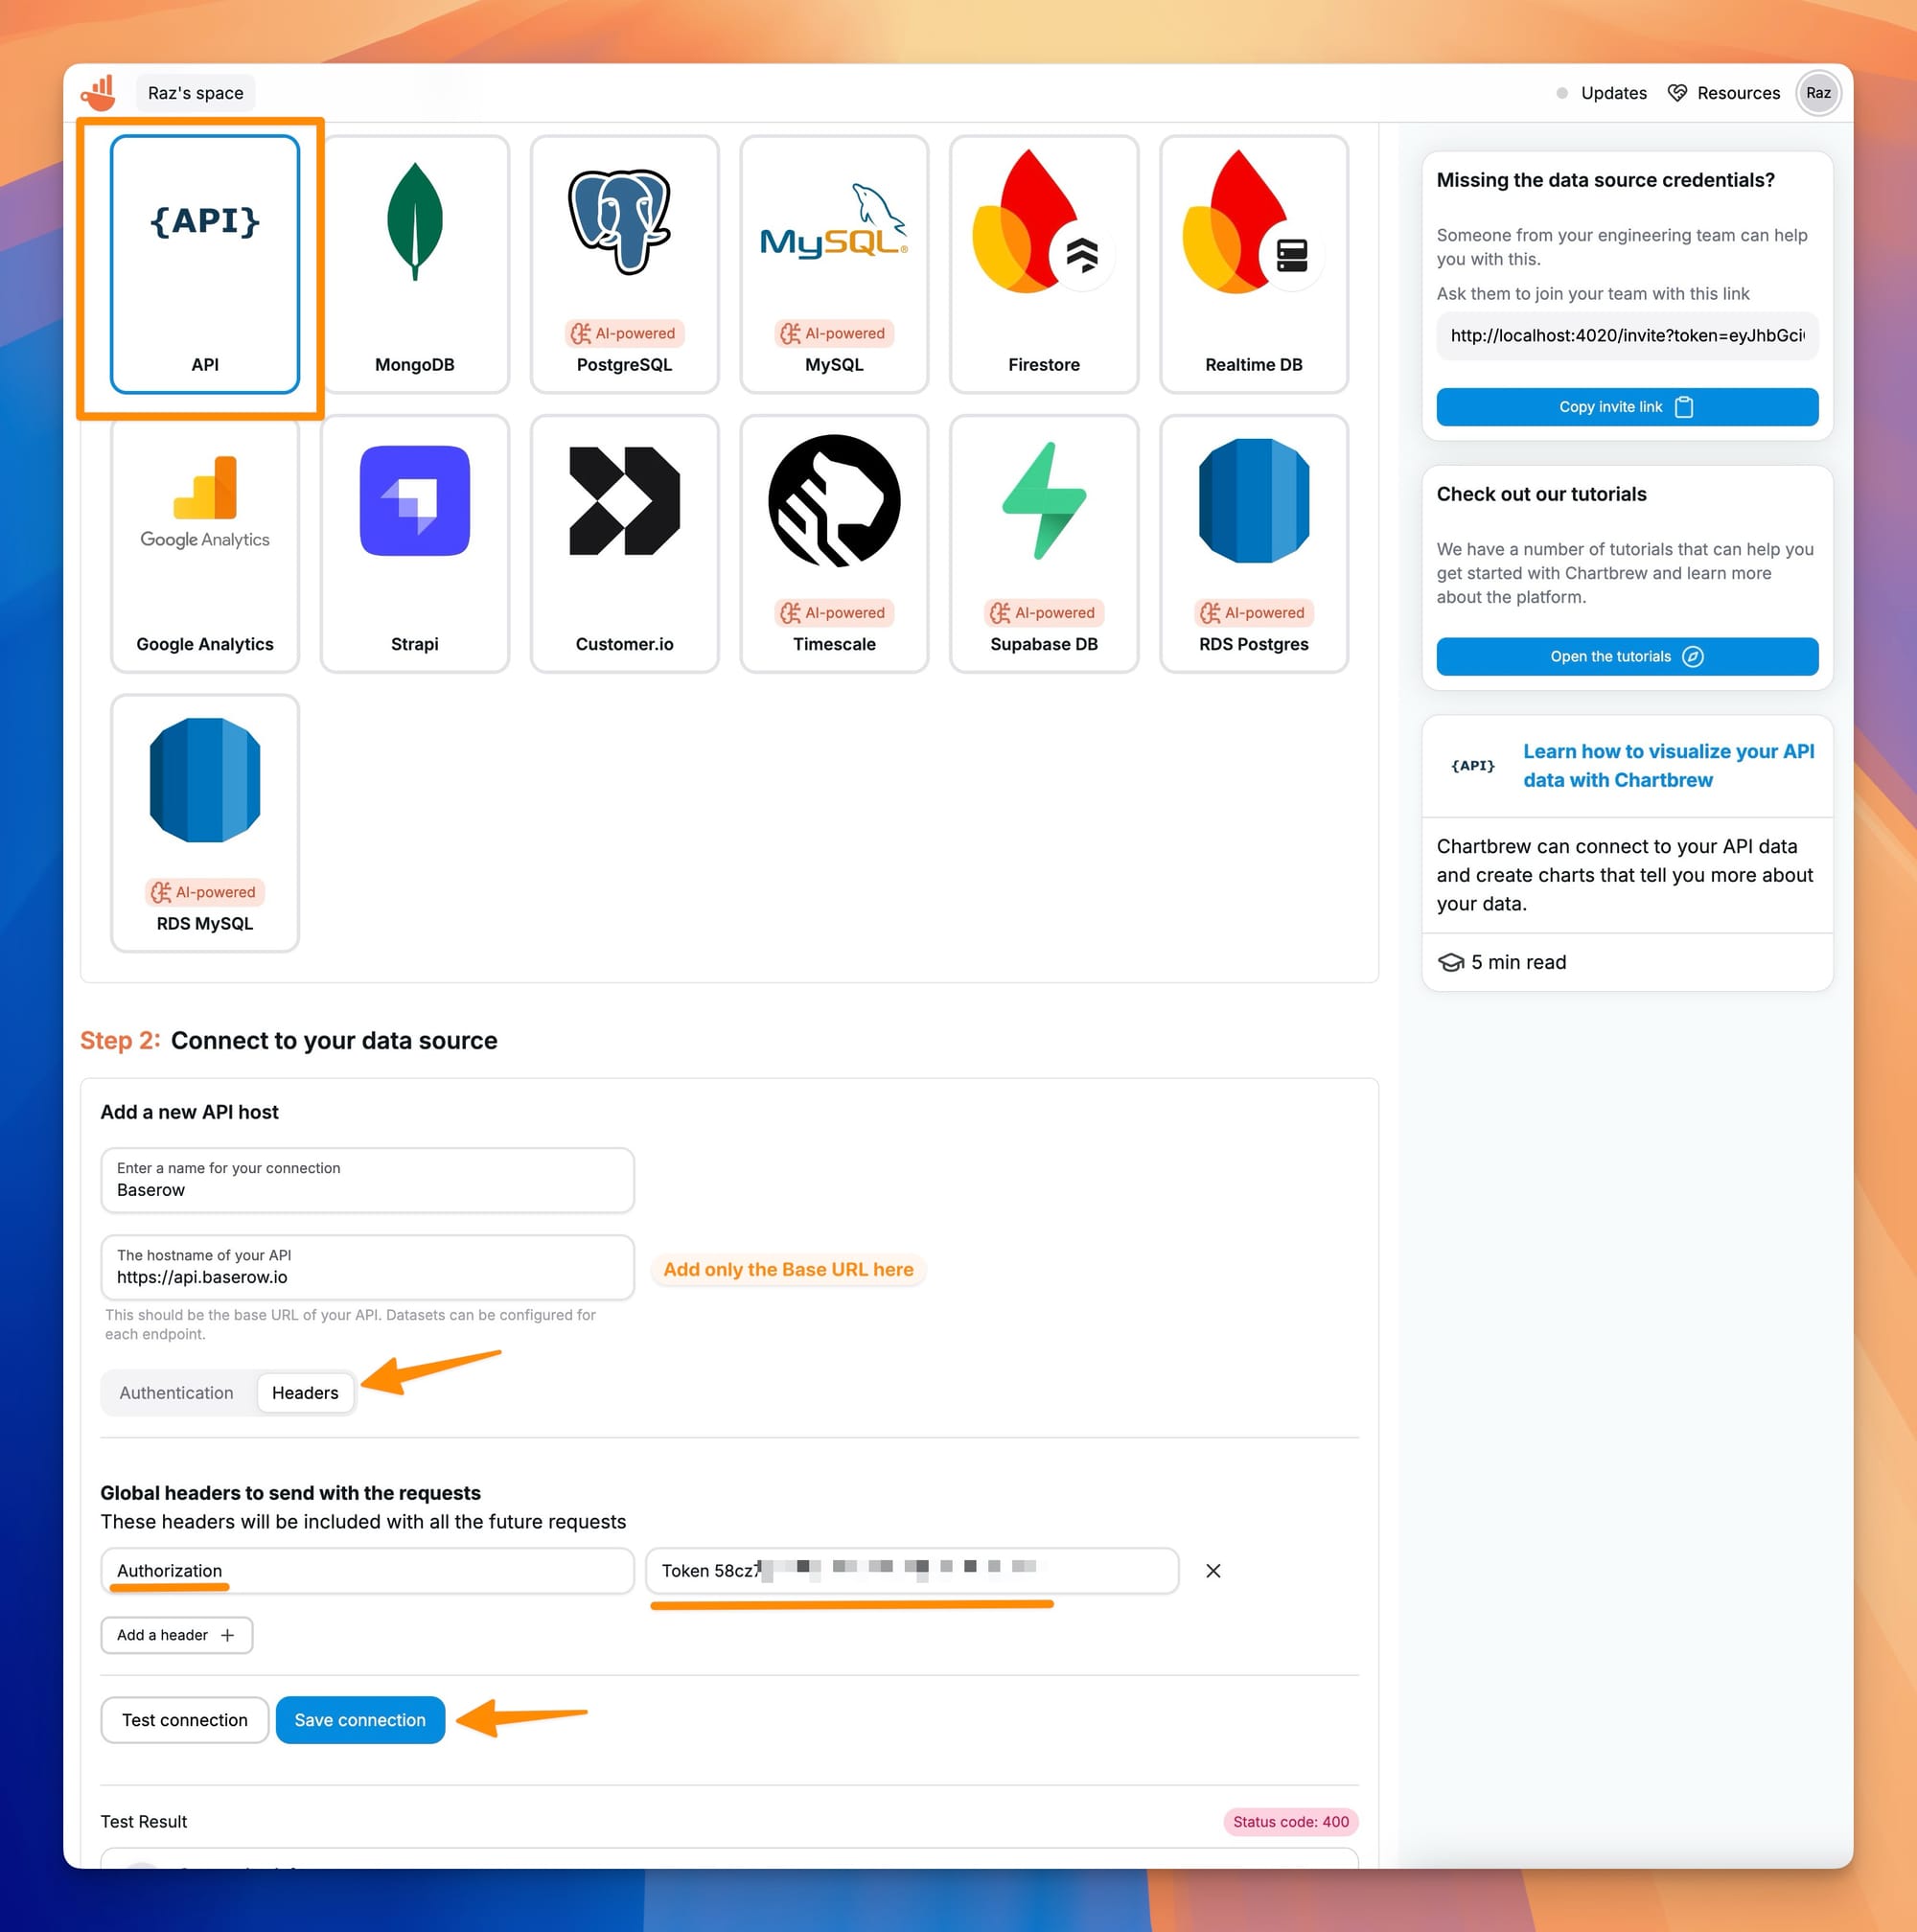
If you test the connection, you might get an error, but this is fine because Baserow does not return anything from the Base URL. Save the connection and let's proceed with creating a new Dataset.
Fetching Data Using the API Connection
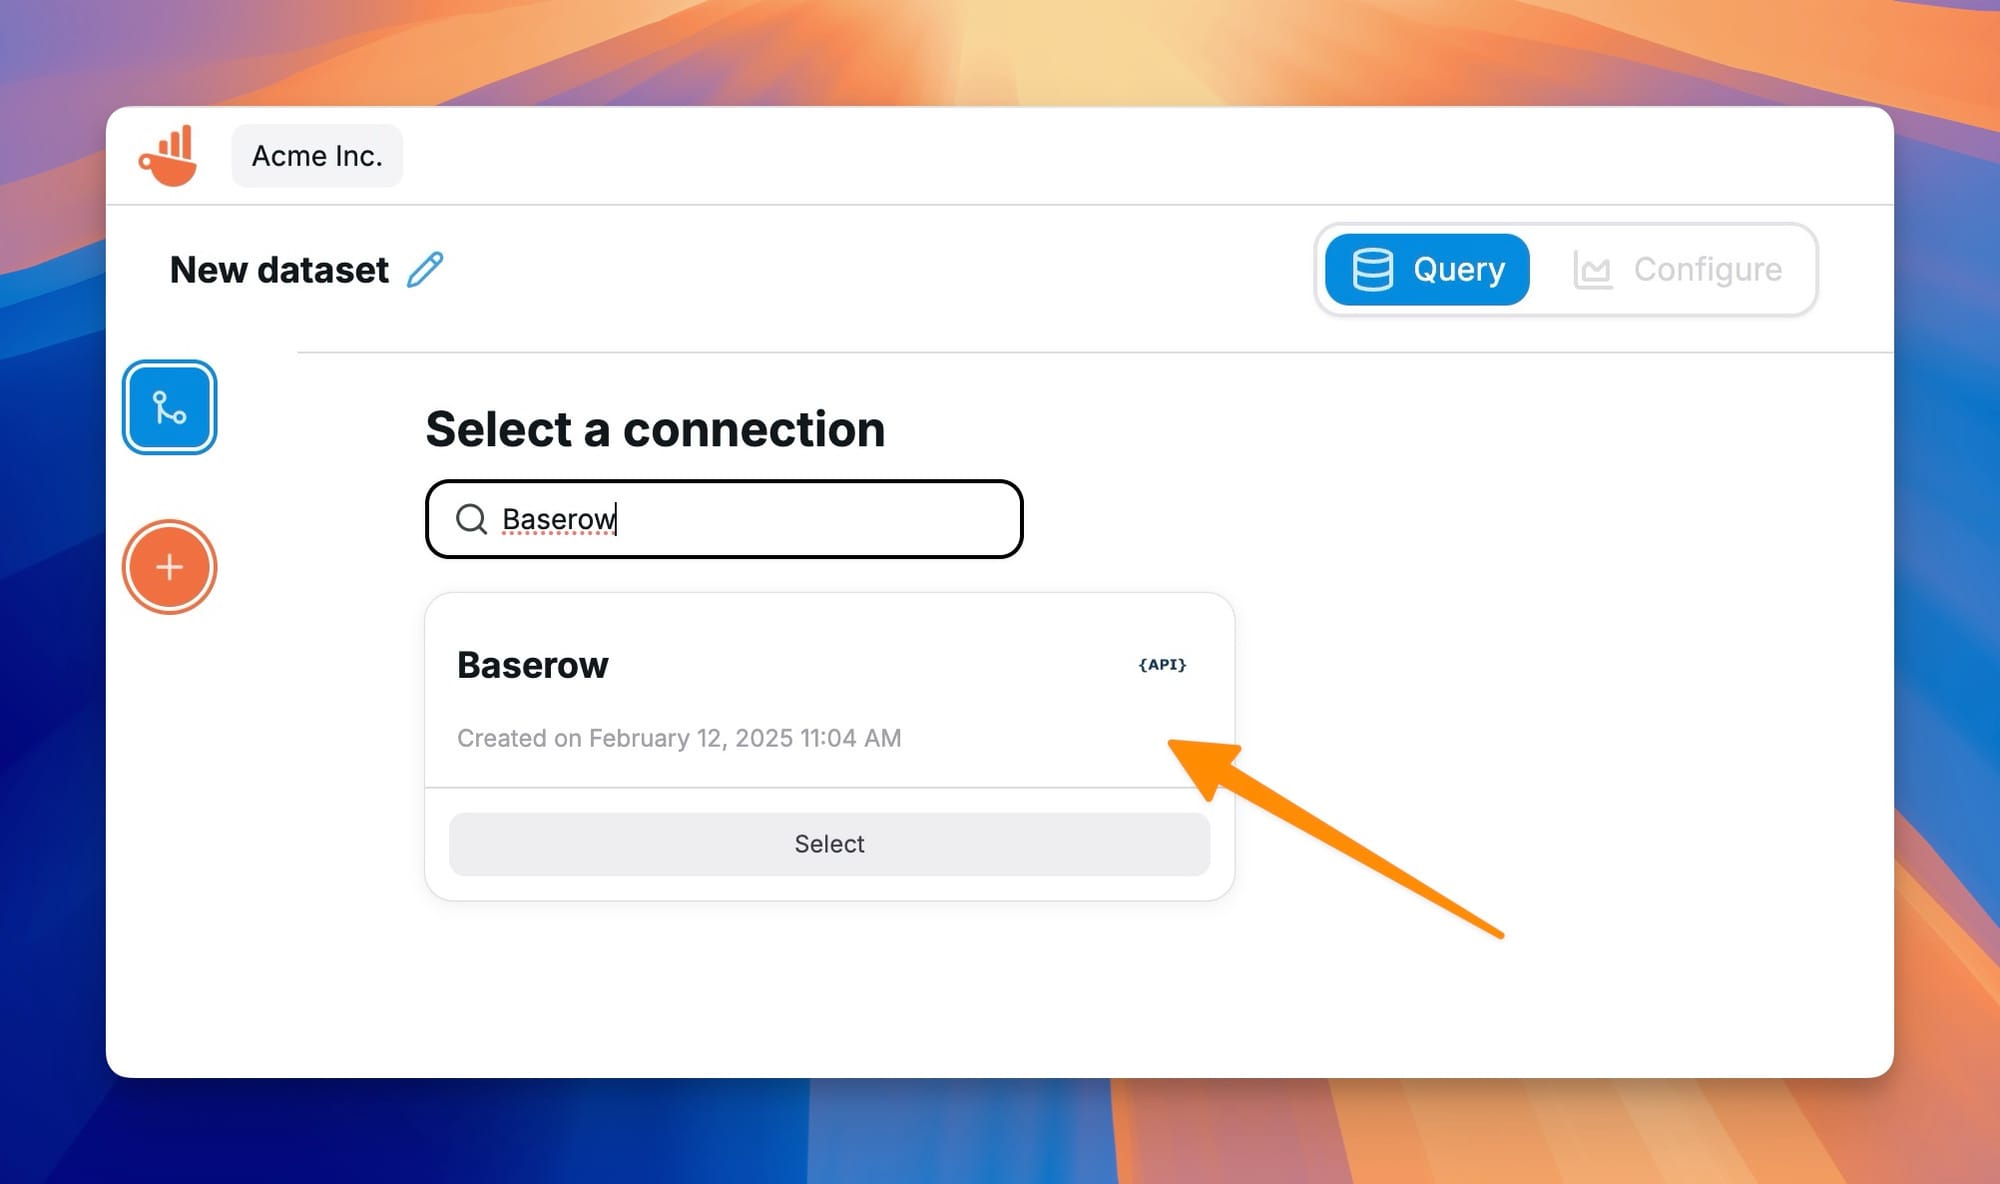
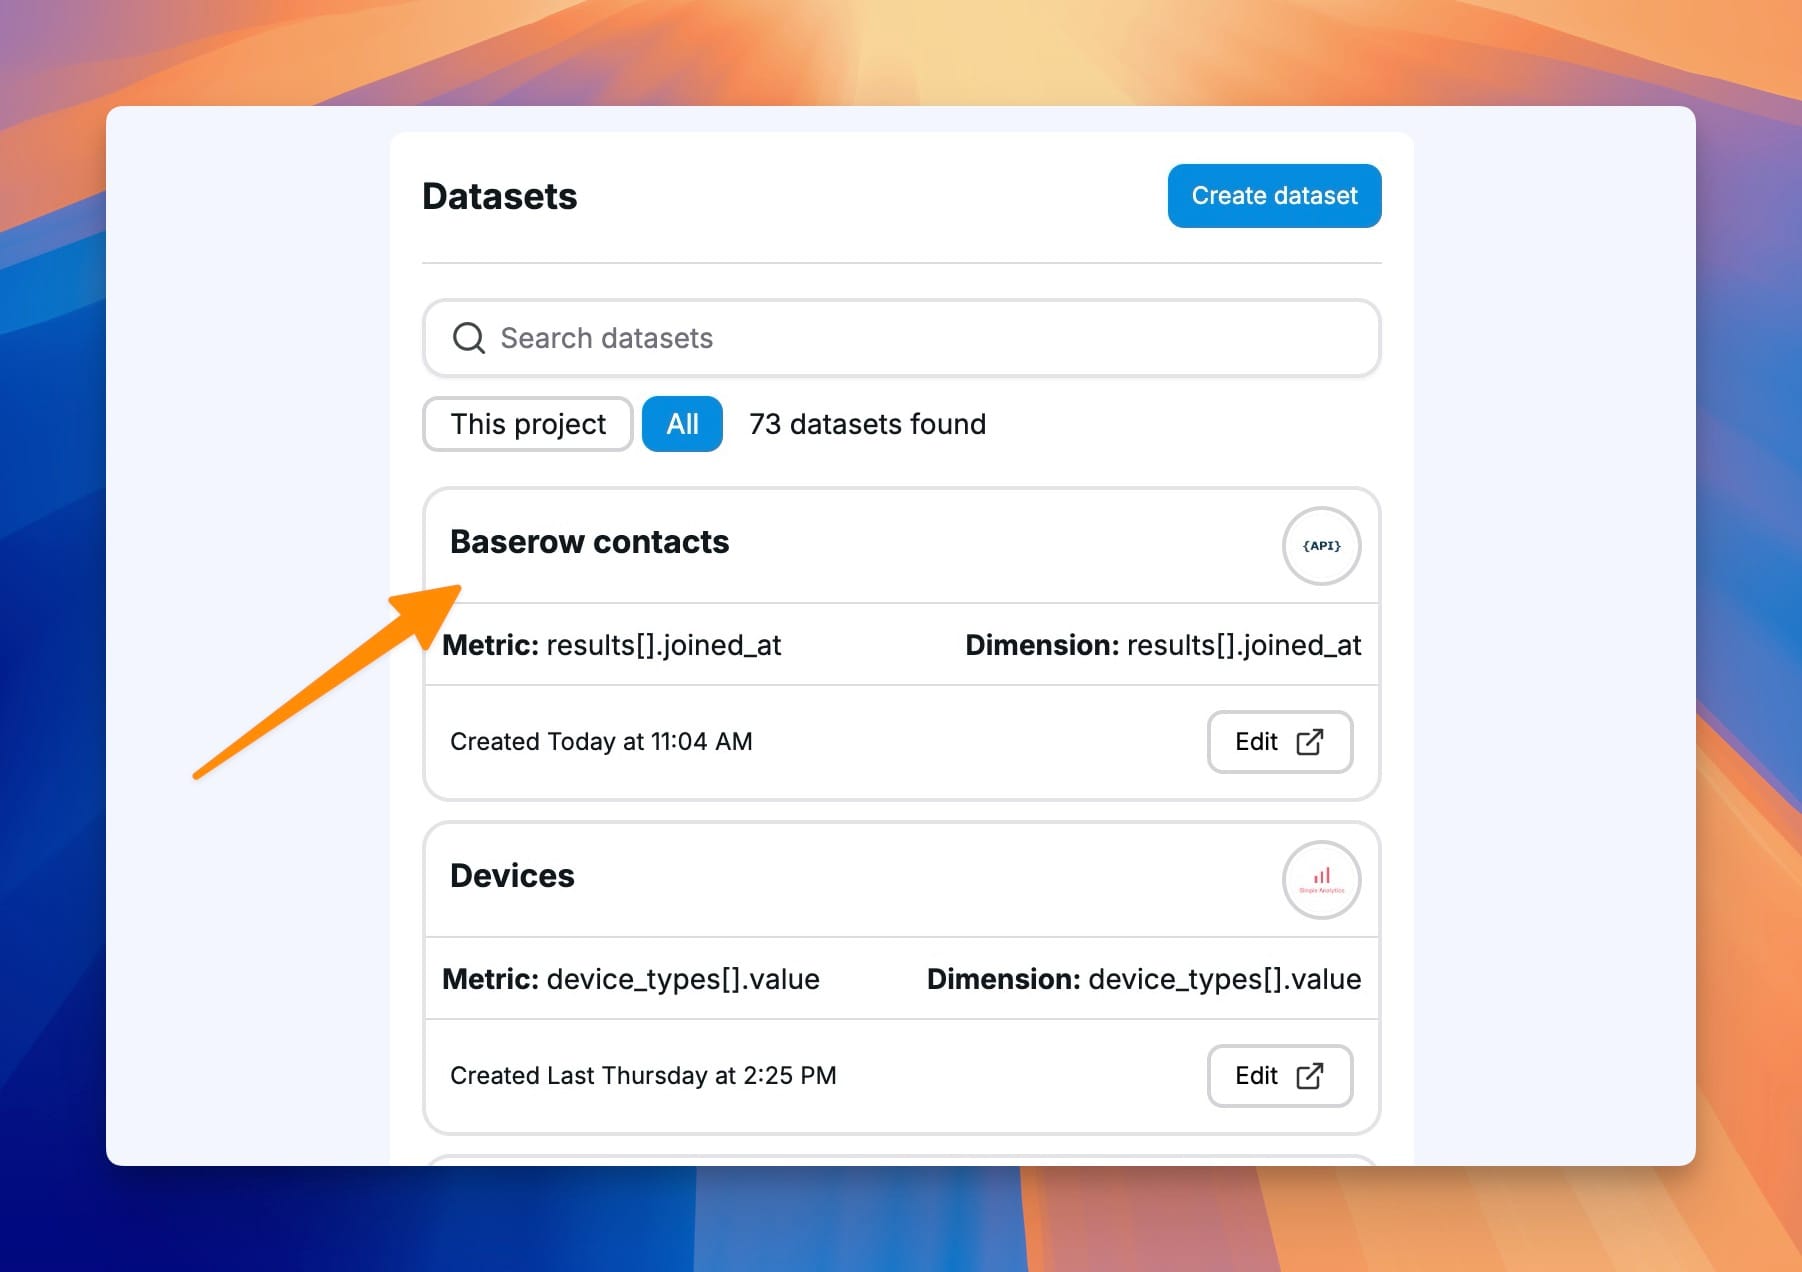
Once the connection is established, it's time to create a dataset using this API connection. When prompted, click to create a new dataset, and select the API connection you just created. You can also create a new dataset from the Datasets menu on the homepage.
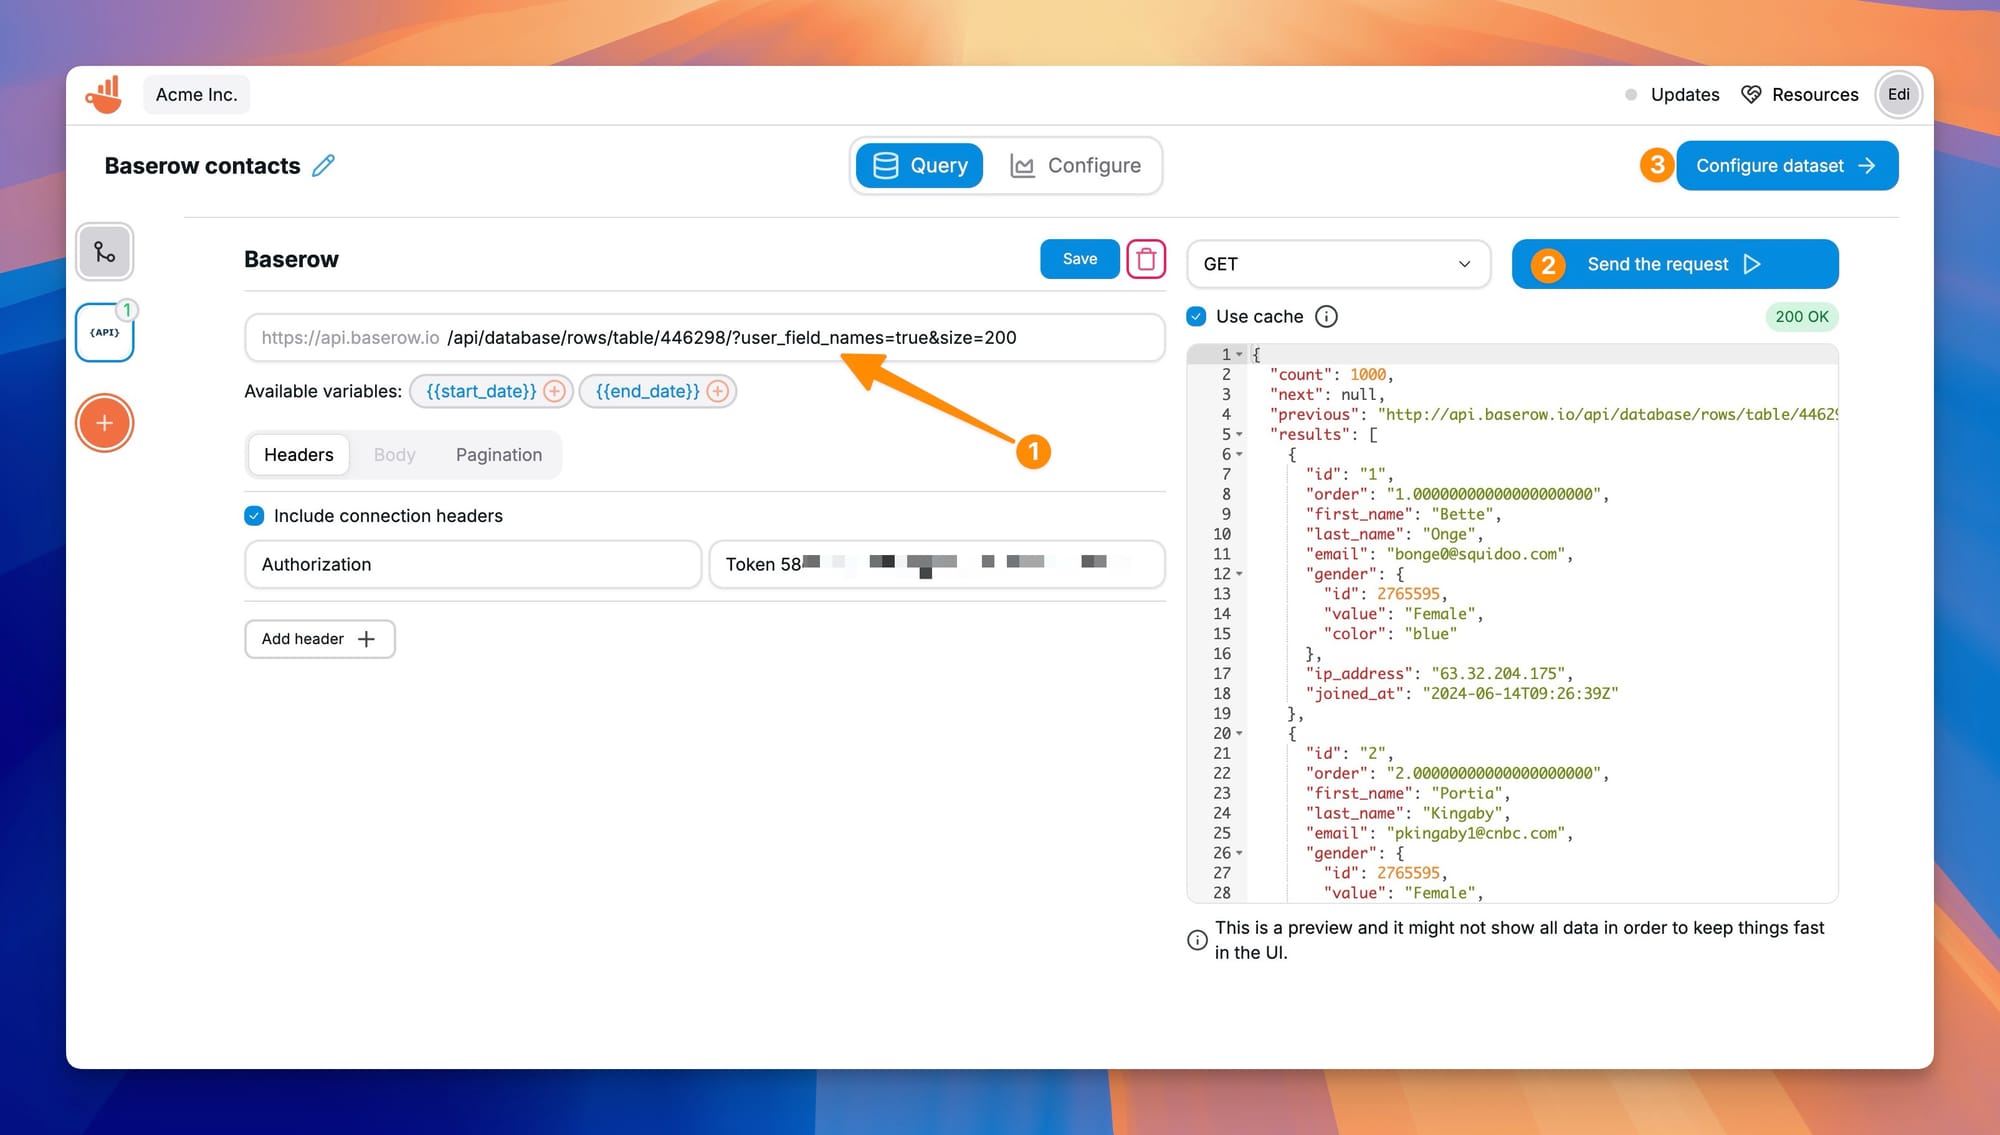
Chartbrew will retrieve data from Baserow in JSON format. Before it can do that, you need to configure the API call. In the query screen, enter the full List Rows endpoint you obtained from Baserow earlier. It should include the table-specific path. Baserow limits the number of results per request to 200, but you can set up automatic pagination in Chartbrew. Check out the next section in this blog to see how to configure this.
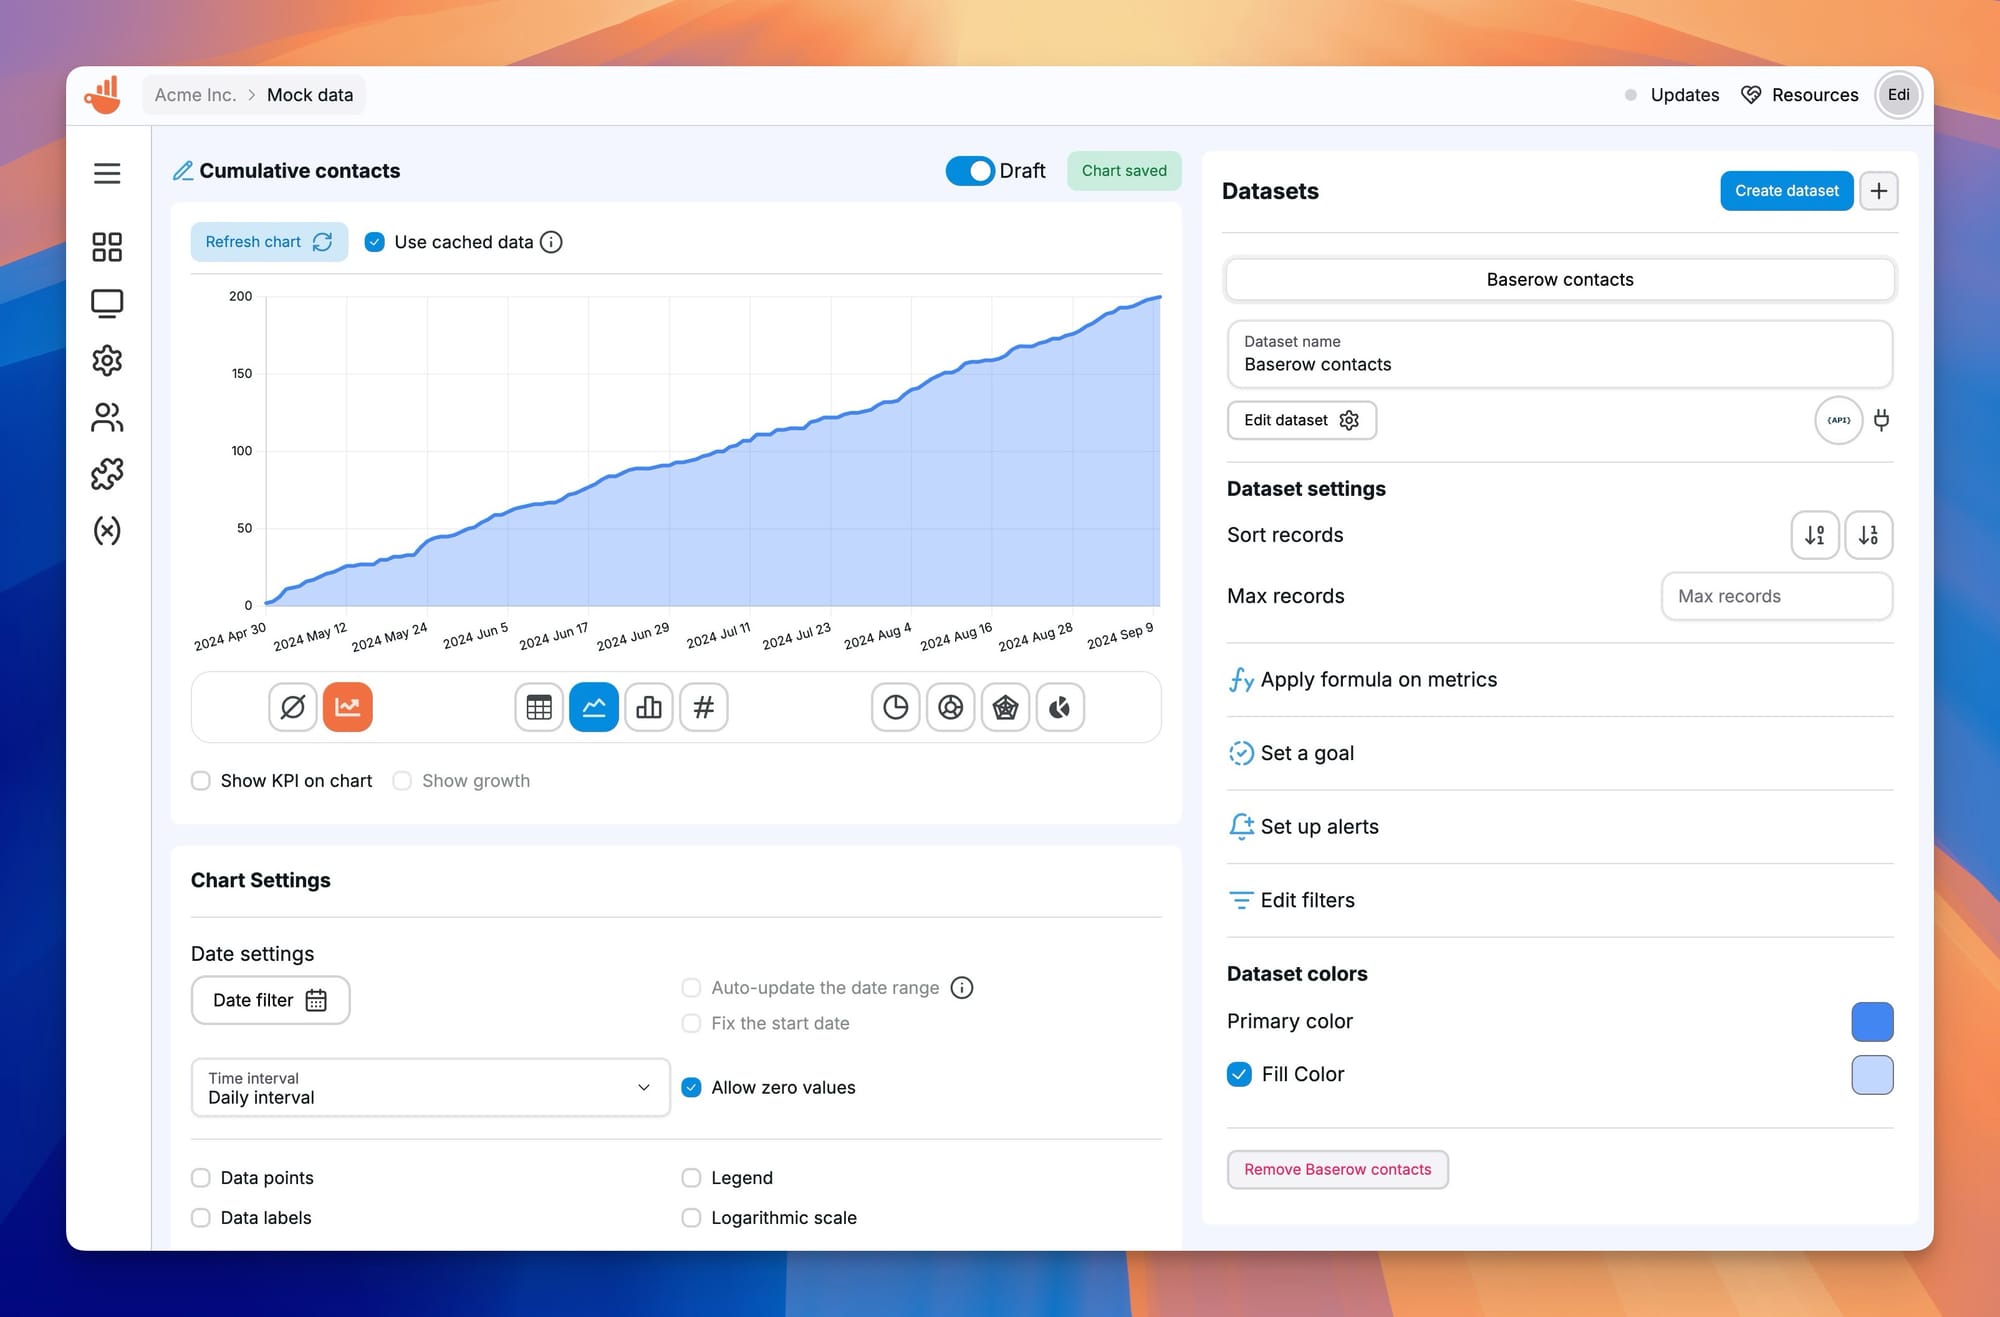
Once Chartbrew fetches the data, click on Configure Dataset to refine how the data is mapped by the dataset. Here, you will need to select a dimension, and choose a metric to measure. You can also specify a metric operation like sum, average, or count, depending on how you want to process your data. In the example below, we chose a date field as a dimension and a count of unique IDs as a metric. This will essentially create a time series chart of when contacts joined the list.
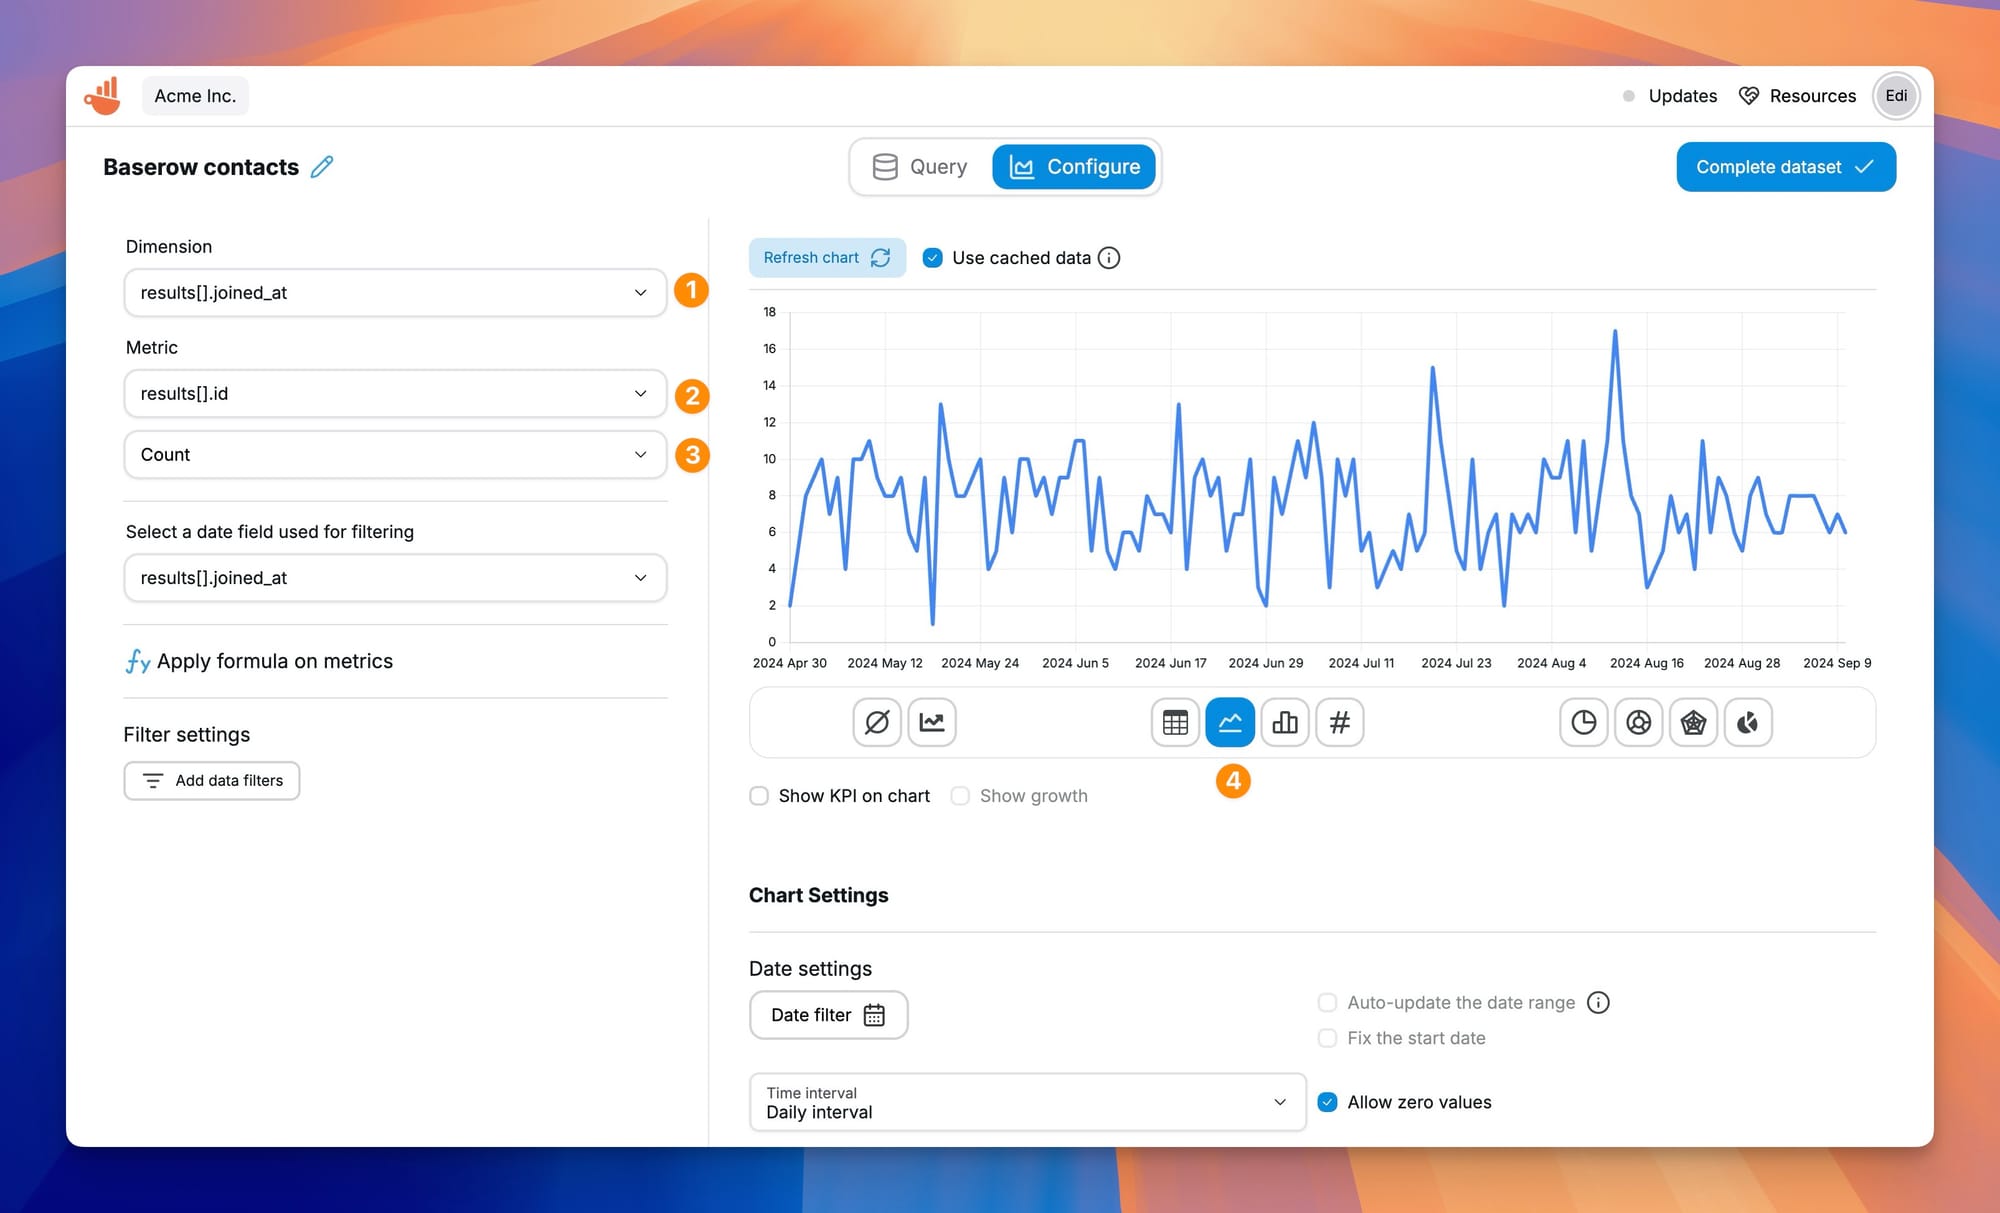
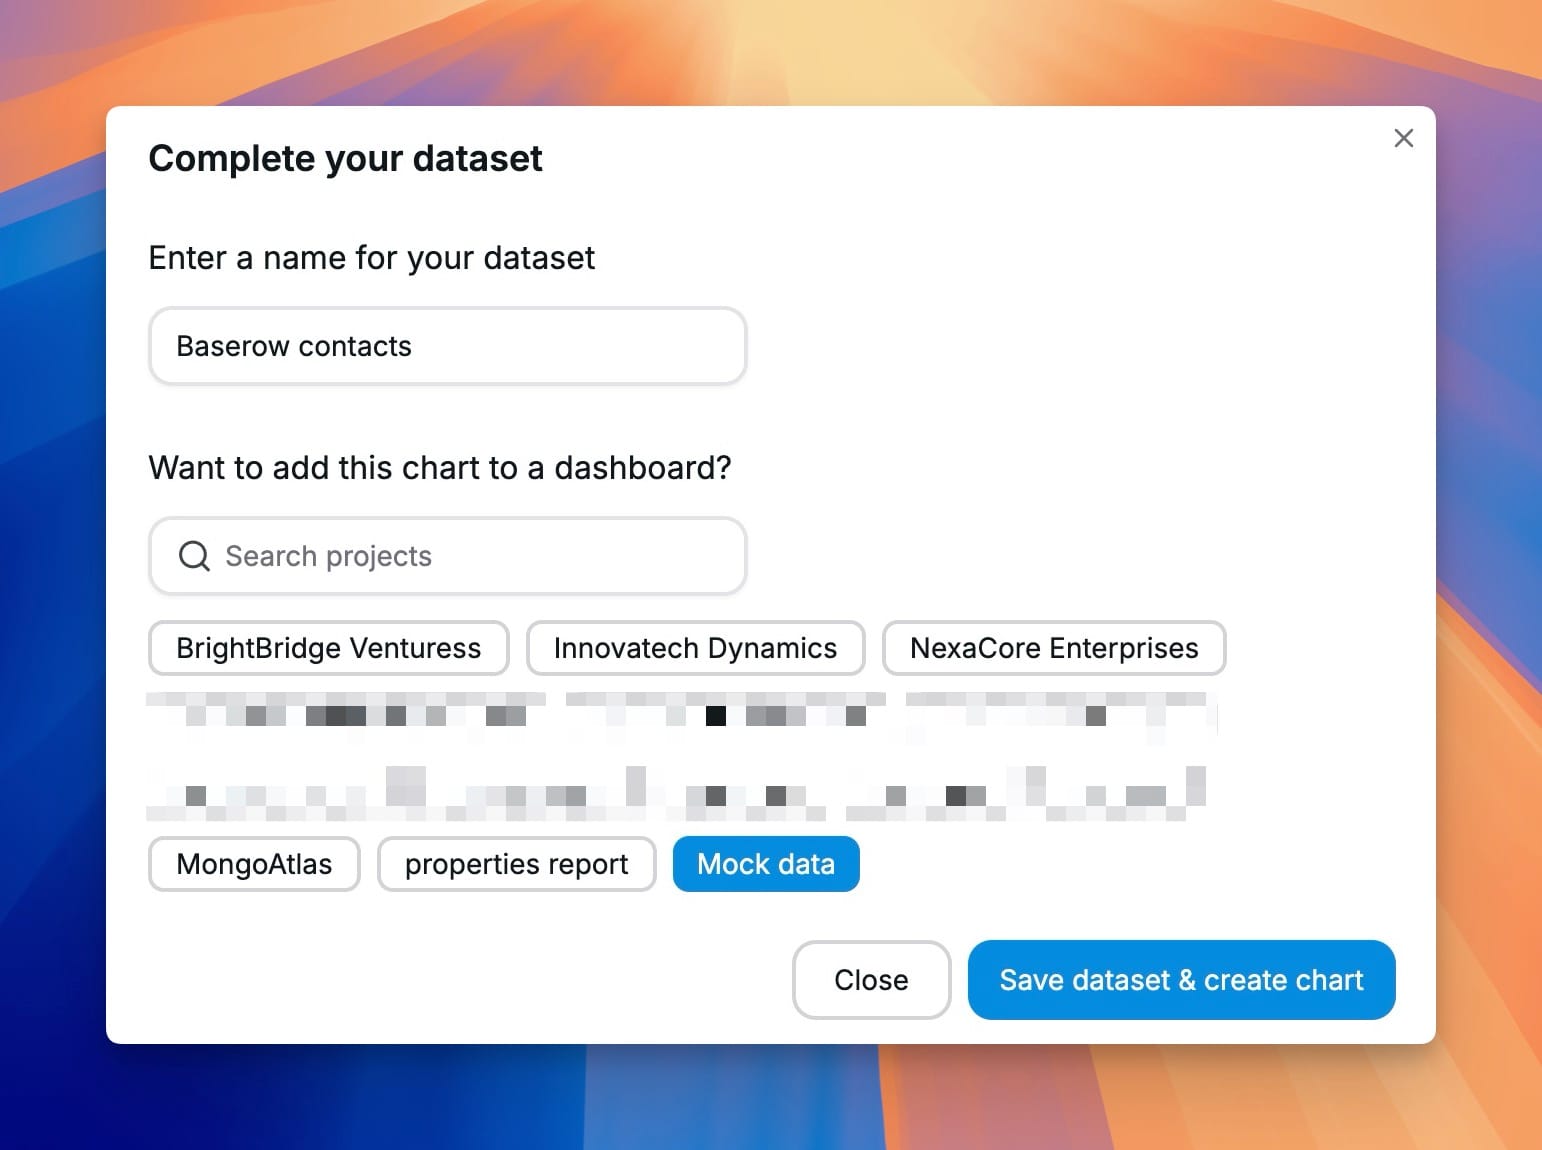
At this stage, you should see a preview of the data. If everything looks good, save the dataset. You can choose to create the chart you just previewed by selecting a project from the list.
Handling Pagination in API Requests
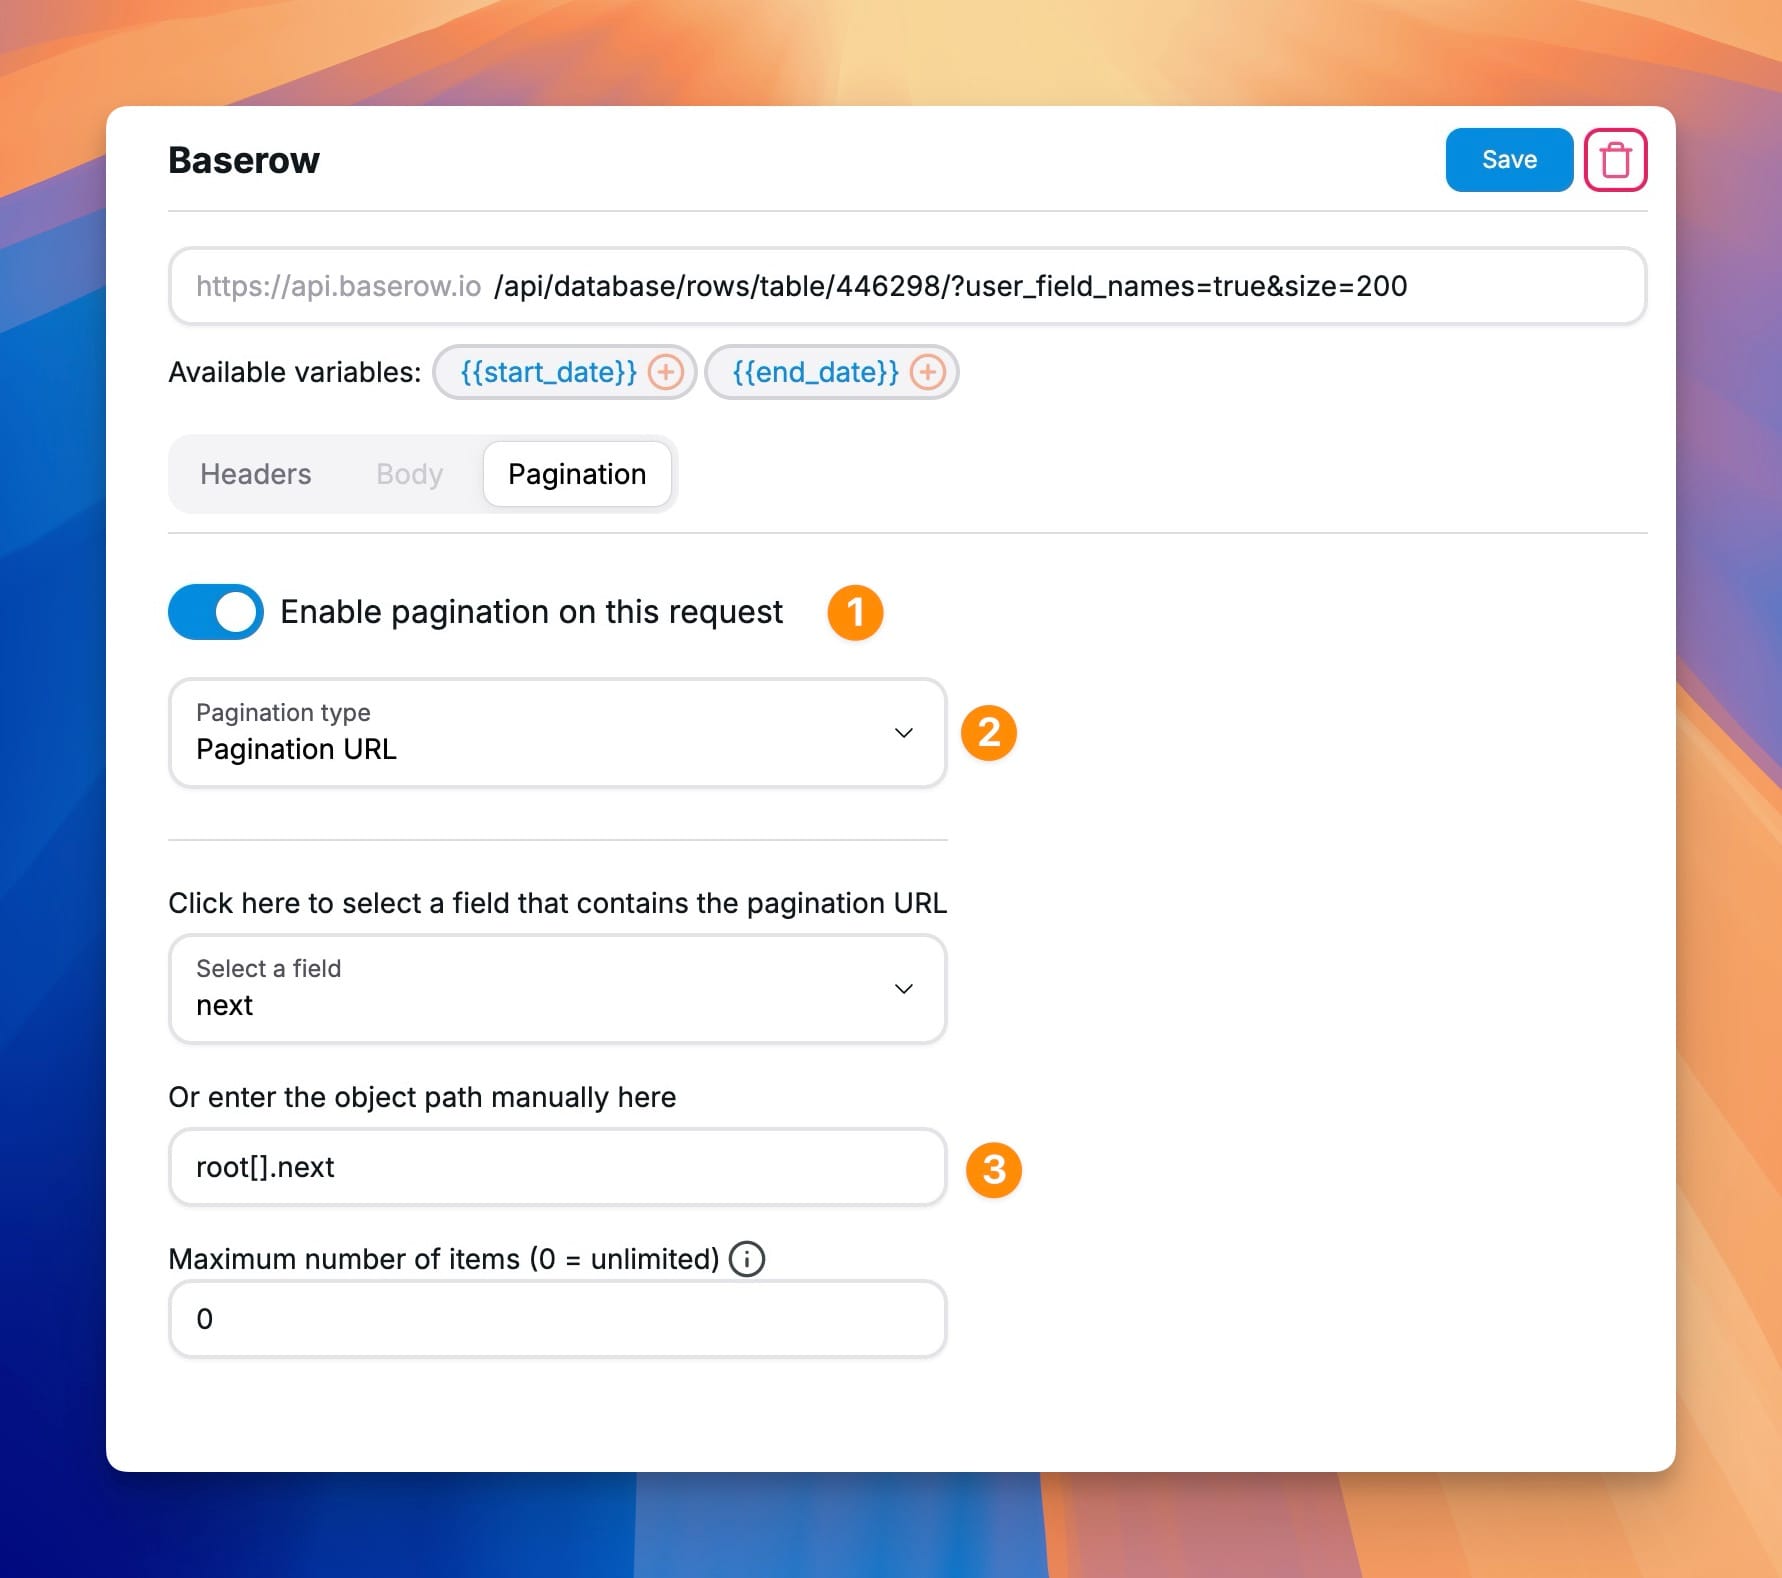
If your Baserow table contains a large number of rows, the API response will be paginated, meaning only a limited number of records are returned per request. To fetch all data, we need to configure pagination correctly.
In Chartbrew, enable the Pagination option. Choose Pagination URL as the pagination type, and set the next page field to next or manually enter root[].next in the path field if not available in the dropdown. This tells Chartbrew to follow the pagination links provided in the API response until all rows have been retrieved. Once this is set, test the request again to ensure all pages are being fetched properly.
Creating Charts from Your Dataset
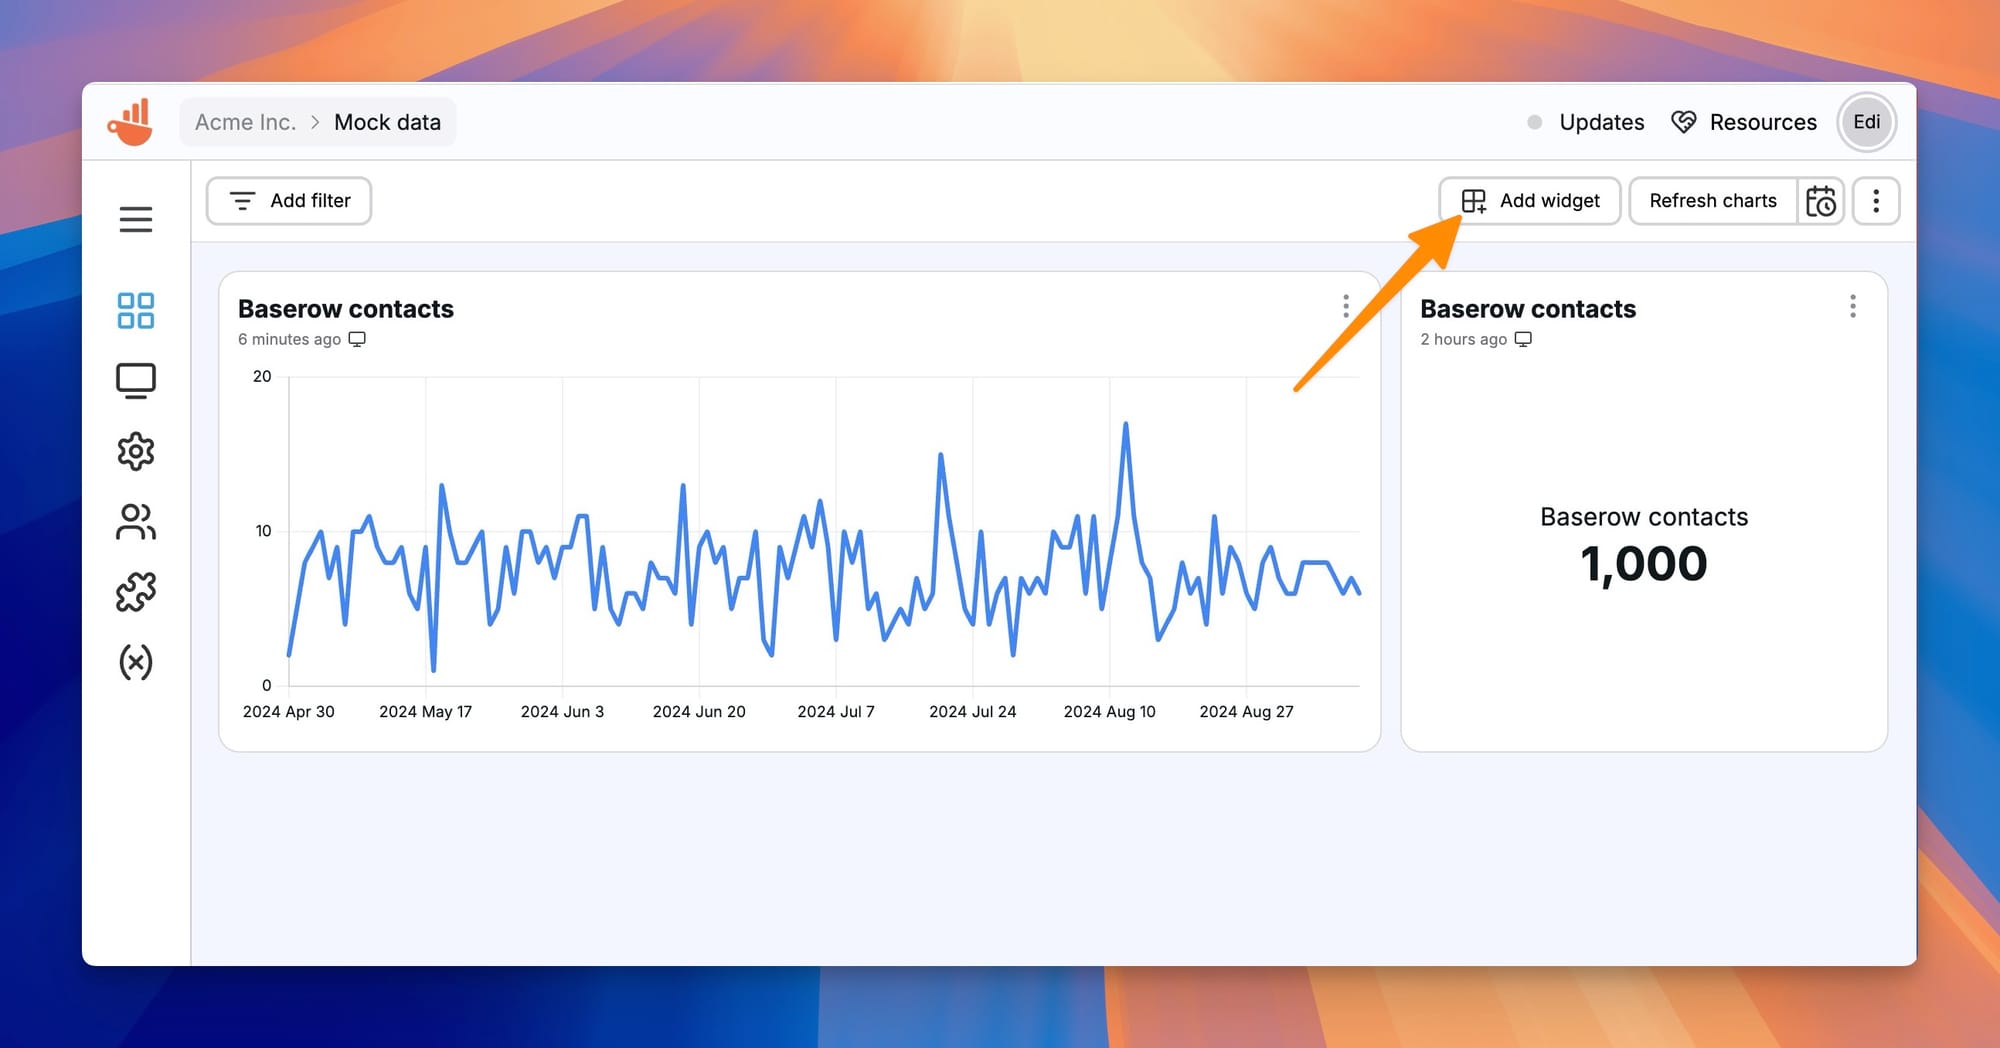
Now that the dataset is ready, you can create a visualization using it. In Chartbrew, navigate to your dashboard and click on Add Widget. Select Chart, then choose Create from scratch. From there, select the dataset you just created from the list of available datasets.
Once you have selected the dataset, configure and customize the chart's appearance by modifying labels, colors, and other visual settings.
Chartbrew makes it easy to build a Baserow dashboard by reusing datasets across multiple charts. You can create multiple visualizations from the same dataset, allowing you to track key metrics, monitor trends, or compare data over time in a single view.
Conclusion
Baserow is a powerful open-source online database, and when combined with Chartbrew, it becomes a complete Baserow data visualization solution. Whether you're looking for an Airtable alternative or exploring Smartsheet, using Chartbrew allows you to create stunning visual reports for your business or personal projects.
With this guide, you now have a clear understanding of how to set up a connection, retrieve data, handle pagination, and create charts. Start experimenting with different datasets and chart types to get the most out of your Baserow charts!
💡 Looking for automation? Chartbrew also offers the ability to create client reports, keep your dashboards updated, data alerts, and more. You can have a look at a list of features here.
Happy charting!
