Integrate and visualize your Timescale data with ease
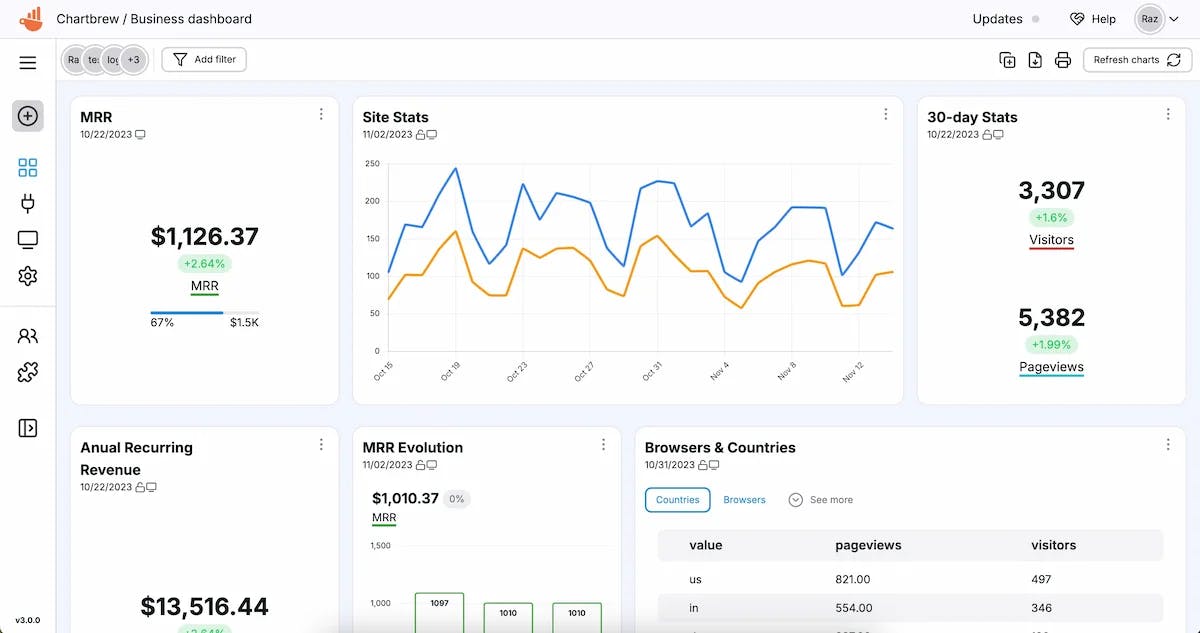
Chartbrew's integration with Timescale lets you effortlessly create interactive charts and dashboards. This feature is perfect for harnessing the power of your time-series data, providing valuable insights and enhanced reporting capabilities.
Blog
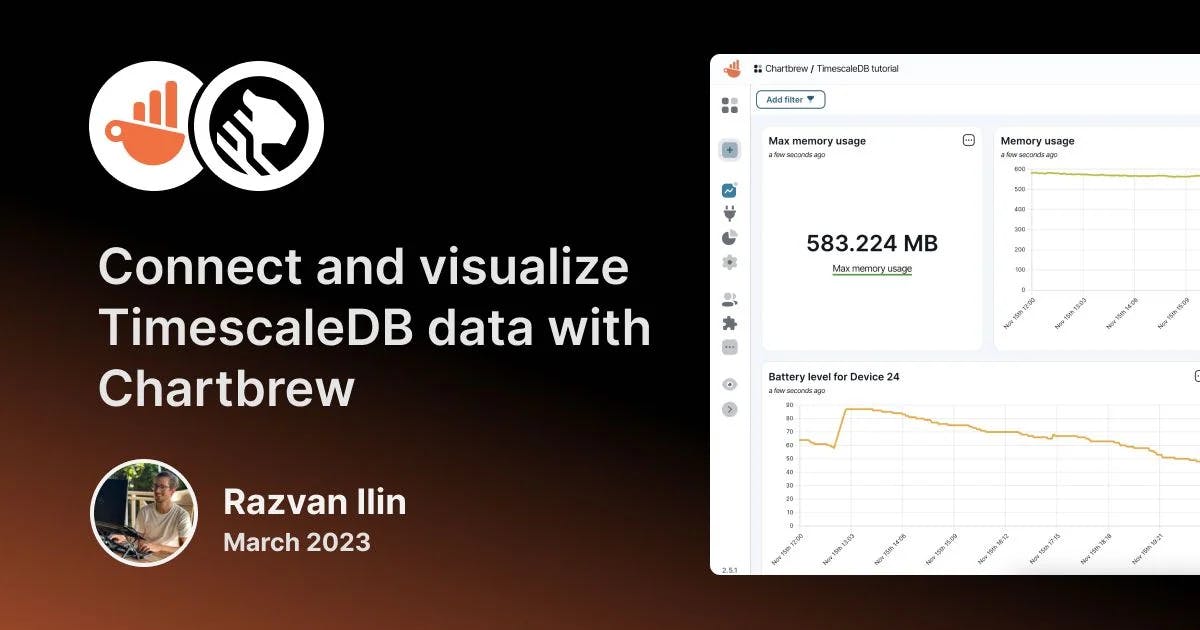
Connect and visualize TimescaleDB data with Chartbrew
Timescale is a great service where you can create PostgreSQL databases for high-performance analytics and time series.
Continue ReadingTake your data to the next level
Empower your team and clients with dynamic, branded reporting dashboards
Already have an account? Log in
