

 Mailgun integration
Build Mailgun dashboards for email delivery, bounces, opens, clicks, and logs
Connect Mailgun data to Chartbrew and report on messages, deliveries, opens, clicks, bounces, complaints, domains, tags, campaigns, and transactional email activity.
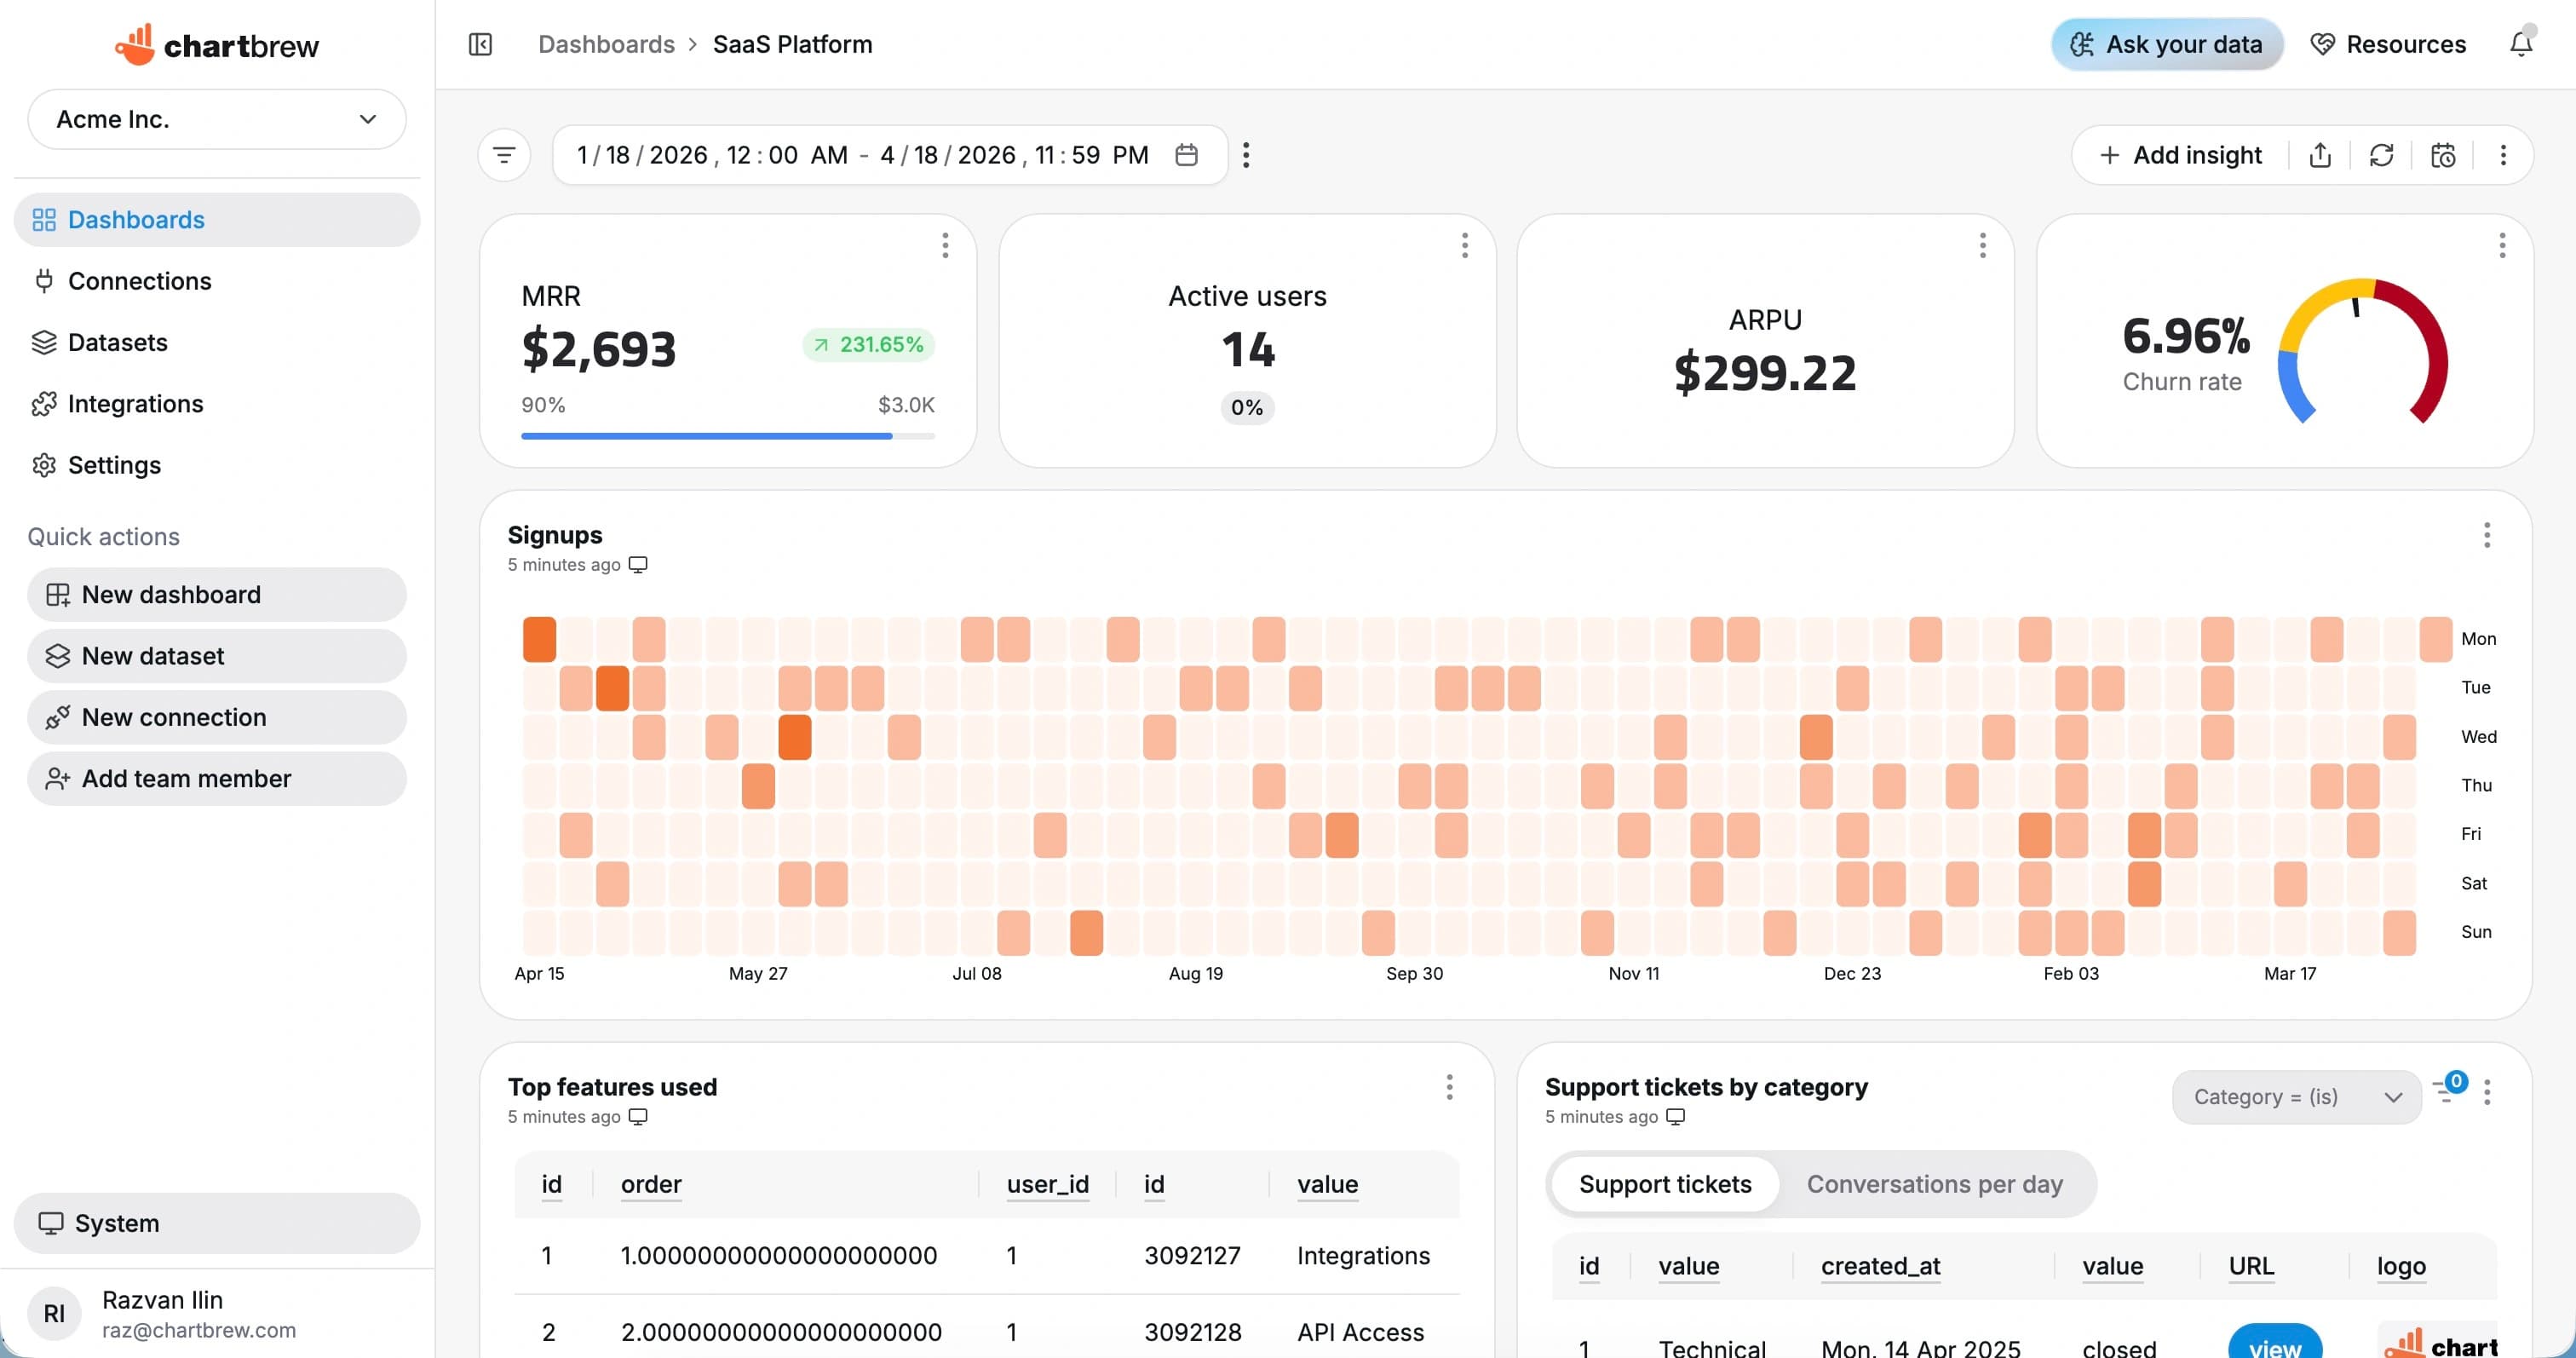
What You Can Track
Mailgun metrics for deliverability and transactional email reporting
Use Chartbrew to keep email operations visible without relying on one-off CSV exports from message logs.
Delivered messages
Track successful deliveries by day, domain, tag, campaign, or customer.
Bounces and failures
Monitor hard bounces, soft bounces, failed deliveries, and error reasons.
Opens and clicks
Report on engagement events for campaigns and transactional messages.
Complaints
Watch spam complaints and unsubscribes so deliverability issues are easier to catch.
Domain performance
Compare domains, sending pools, tags, or applications across delivery and engagement metrics.
Recent event logs
Create tables for recent failures, bounces, complaints, and message activity.
How It Works
From Mailgun connection to live dashboard
The Mailgun workflow is built around a source connection, reusable datasets, scheduled refreshes, and shareable dashboards.
Connect Mailgun
Add Mailgun API access and the domain, region, or event endpoint used for reporting.
Choose the reporting scope
Choose events, messages, domains, tags, campaigns, date ranges, and filters for the dashboard.
Create datasets
Turn the response fields you need into KPI, chart, and table datasets with filters and date ranges.
Share live reporting
Publish dashboards, embed reports, or send scheduled snapshots so reporting stays repeatable.
Why Chartbrew for Mailgun
Email reporting that can live beside product and revenue data
Chartbrew helps teams share Mailgun deliverability and engagement dashboards with support, product, client, and operations teams.
Deliverability visibility
Turn message events into charts for delivered mail, bounces, failures, complaints, opens, and clicks.
Operational tables
List recent failures, bounce reasons, complaints, and high-priority events for quick review.
Scheduled reporting
Refresh Mailgun dashboards and send email performance snapshots on a schedule.
Client-ready sharing
Share dashboards and embeds without giving every viewer Mailgun account access.
AI-assisted exploration
Use Chartbrew AI to draft dashboard ideas for email delivery, engagement, and domain health.
Cross-source reporting
Blend Mailgun events with customer records, product activity, Stripe revenue, and database metrics.
Setup Requirements
What you need before connecting Mailgun
Start with the right Mailgun access, a clear reporting scope, and a few fields that map to useful dashboard metrics.
A Mailgun account with the domains or events you want to report on
Mailgun API access for events, messages, or domain reporting
A reporting domain, region, tag, or date range for the dashboard
Event fields for delivered, opened, clicked, bounced, complained, or failed messages
Optional customer, product, campaign, or tenant identifiers for filtered dashboards
| Dataset idea | What it can power |
|---|---|
| Delivery trend | Delivered messages grouped by day, week, domain, or tag |
| Bounce trend | Bounces grouped by type, reason, domain, or campaign |
| Open and click rate | Engagement events compared to delivered messages |
| Complaints | Spam complaints or unsubscribes over time |
| Domain summary | Delivery, failure, bounce, and engagement metrics by domain |
| Recent failures | Latest failed messages with reason and recipient context |
| Tag performance | Events grouped by Mailgun tag or campaign |
| Customer email activity | Message metrics filtered by tenant, customer, or product field |
Related Features
Features that make Mailgun reporting useful
Use Mailgun dashboards with Chartbrew automation, AI workflows, sharing, embeds, filters, and reporting tools.
Reporting API
Use Chartbrew alongside API-driven reporting workflows when teams need dashboards and programmable access.
Webhooks
Trigger reporting workflows and keep dashboards aligned with events from the rest of your stack.
Chartbrew AI
Turn API, product, marketing, and operational questions into chart and dataset ideas faster.
Data update schedules
Keep API dashboards refreshed on the cadence your reporting workflow needs.
Dashboard snapshots
Send recurring API dashboard snapshots to stakeholders without rebuilding weekly status reports.
Embedded reports
Publish API-powered charts inside client portals, internal tools, and shared reporting pages.
Related Integrations
Connect Mailgun with the rest of your reporting stack
Blend Mailgun metrics with product, customer, revenue, analytics, project, and operational data from other Chartbrew sources.
FAQ
Mailgun integration questions
Practical details about using Mailgun data in Chartbrew dashboards.
Build your Mailgun dashboard
Turn Mailgun email events into live deliverability reporting
Connect Mailgun-style event data, build delivery and engagement datasets, and share email dashboards with teams or clients.
