May 3, 20227 min read
Create your Strapi visualization dashboard with Chartbrew
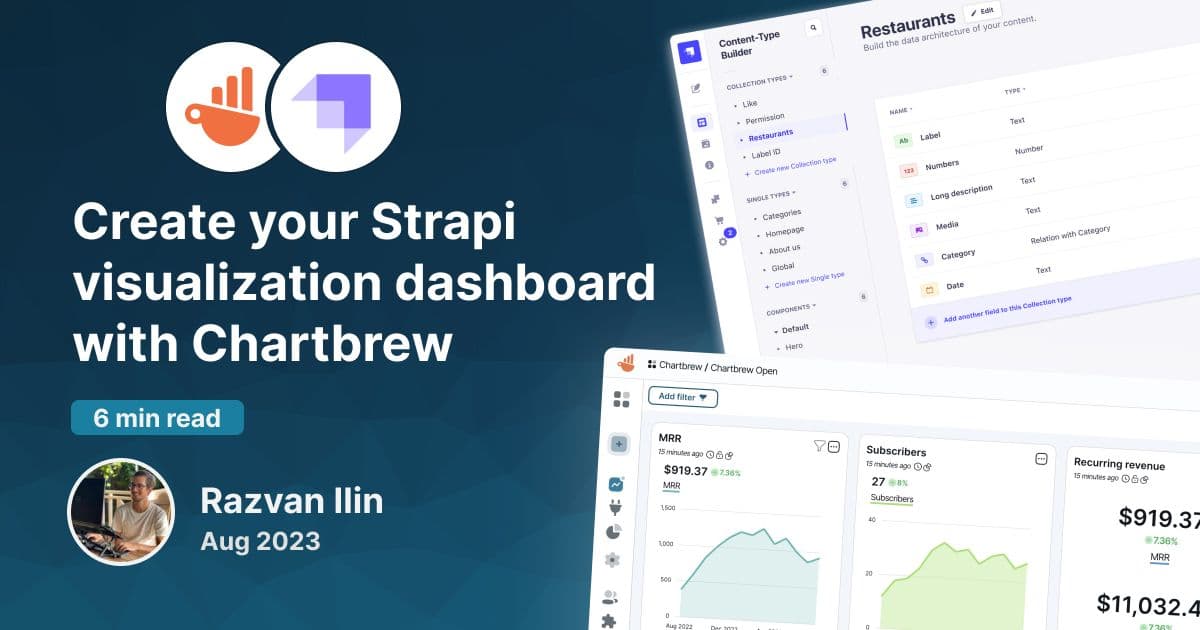
Strapi is a headless content management system used by many businesses worldwide. Chartbrew can connect to its API to visualize and monitor data
tutorialintegration
Tutorials, product updates, and reporting guides for connecting your data to Chartbrew and building clear client-facing dashboards.
Page 4 of 6
Strapi is a headless content management system used by many businesses worldwide. Chartbrew can connect to its API to visualize and monitor data
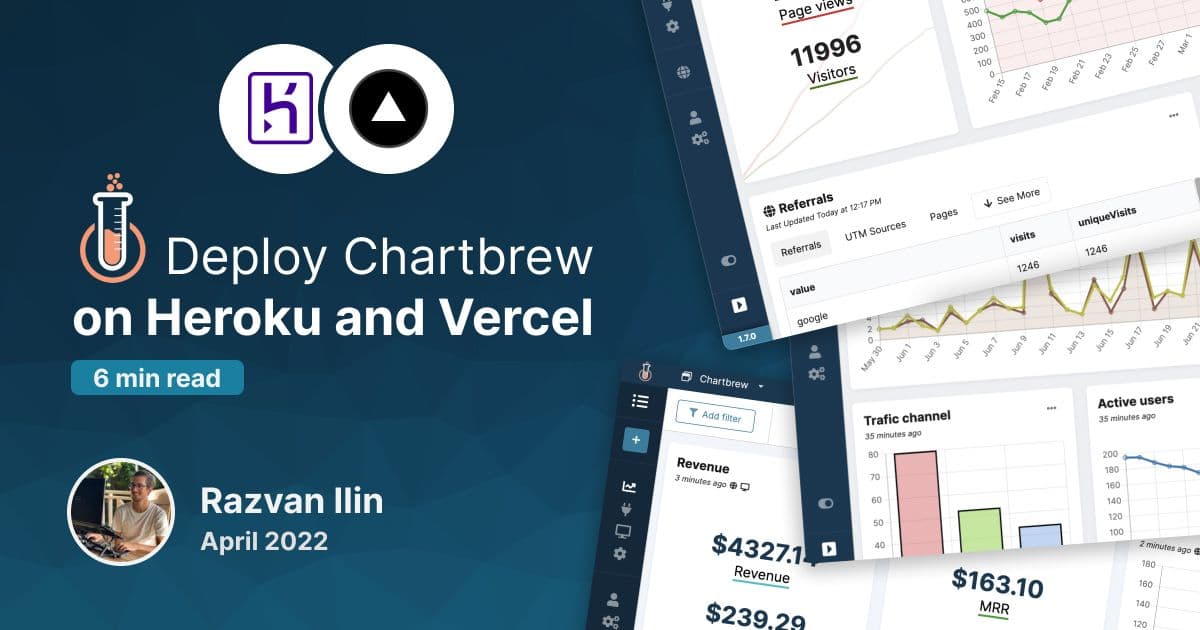
Deploy Chartbrew on Heroku and Vercel and power up your data reporting with a platform where you can gather all your data.
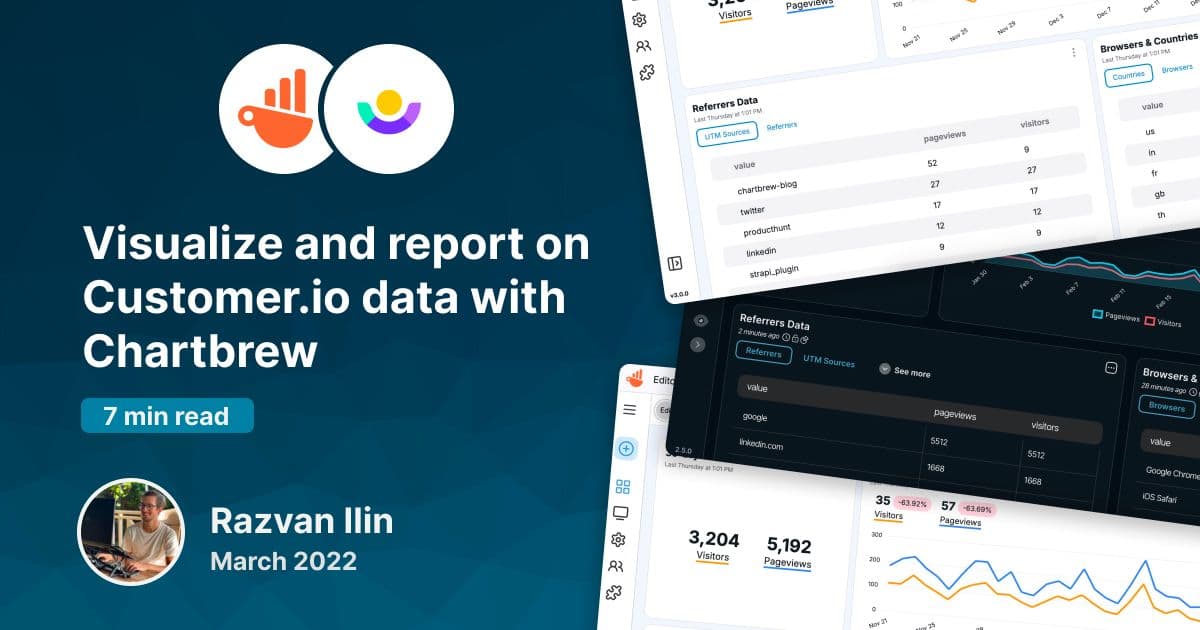
Customer.io is the perfect messaging platform to keep users engaged with your product. Chartbrew can now integrate with Customer.io to get data about customers and visualize it with beautiful charts and live reports.
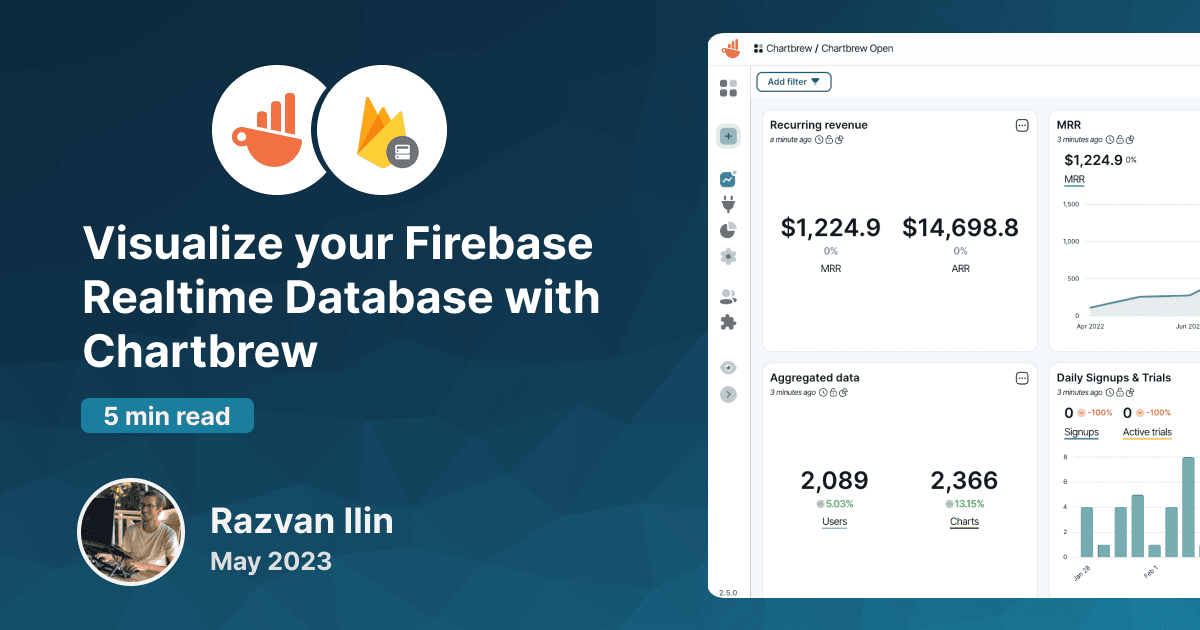
Connect to Firebase Realtime Database to create reports and visualize your data. This tutorial will show you how to connect and create your first chart.
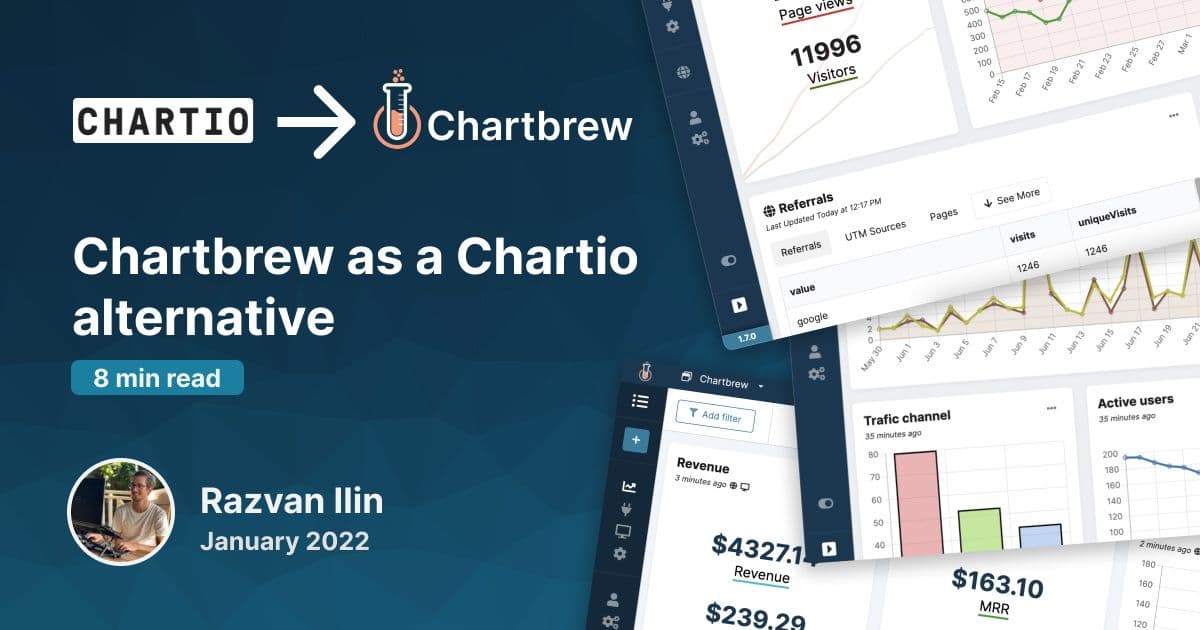
Learn how Chartbrew works as an alternative to Chartio. In this blog post, you can check all the differences, pros, and cons in transitioning to Chartbrew.
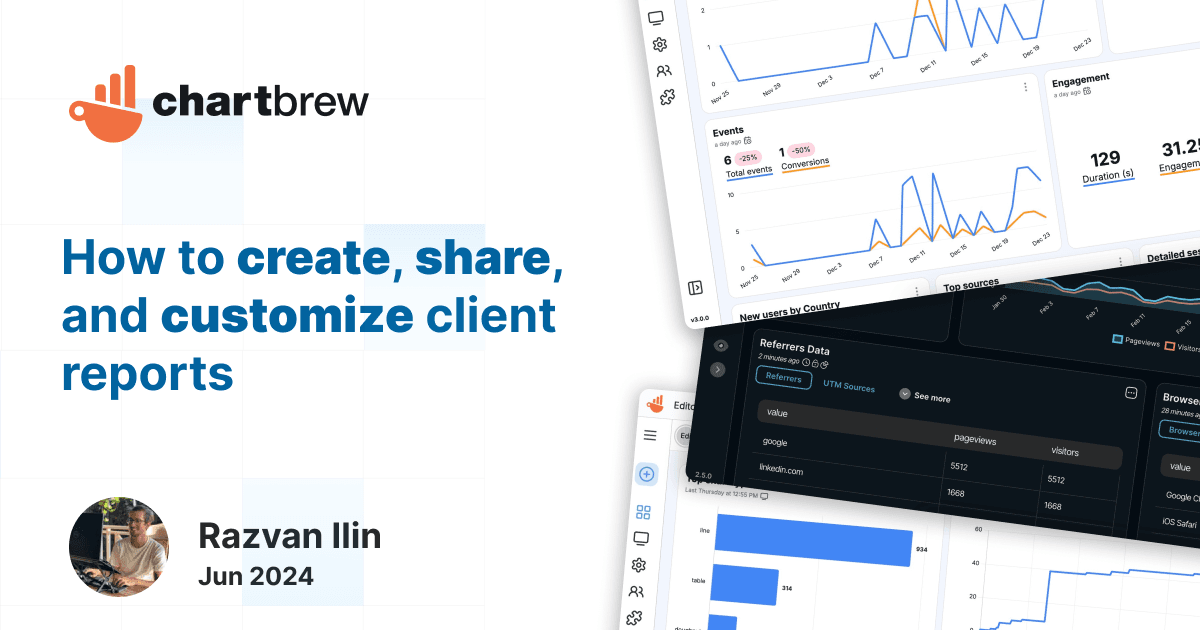
Learn how to create, share, and customize client reports with Chartbrew. Enjoy features like unique public URLs, team-only access, password protection, and extensive customization options.
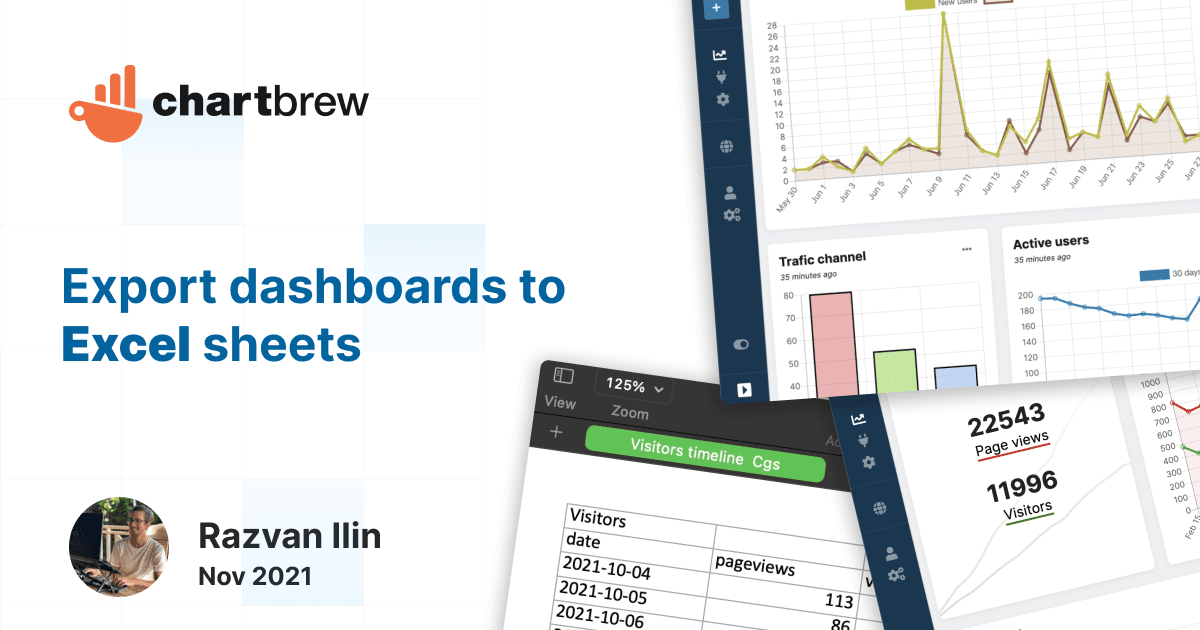
This post will show you how you can connect to multiple data sources and export the data to excel sheets. Supports APIs, databases, Firestore, and more.
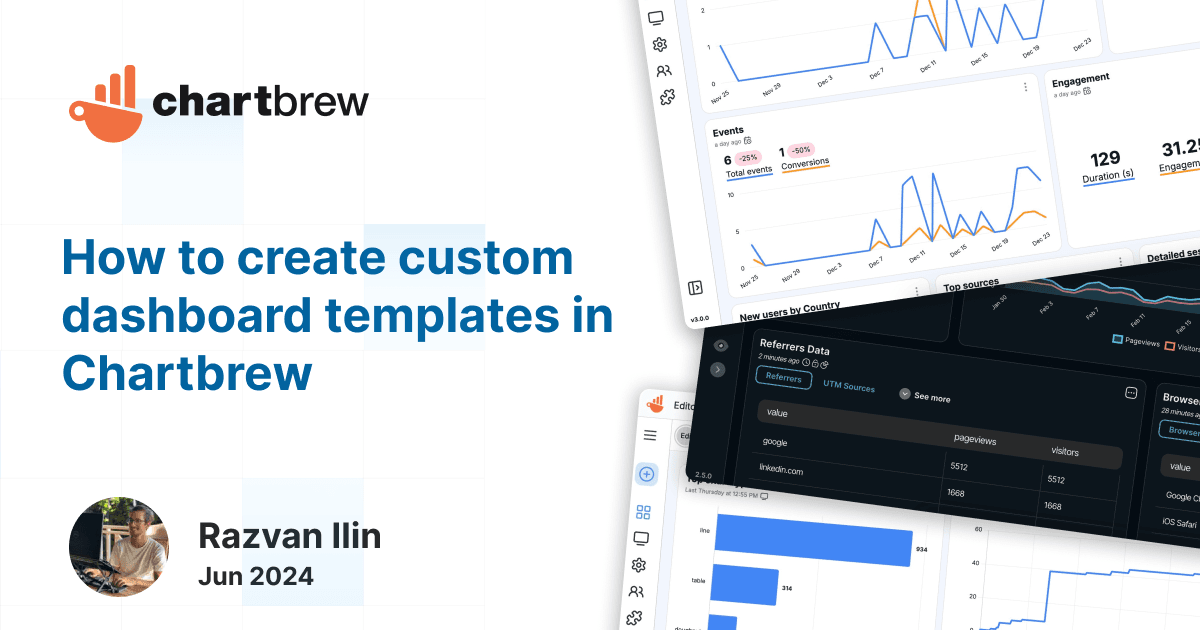
Replicating a dashboard for different clients has never been easier. This tutorial will walk you through how to use the new template feature to replicate dashboards or individual charts across your projects.
Ready to start
Connect your data, build live dashboards, and give your team one place to check the numbers that matter.
