 Realtime Database integration
Build Firebase Realtime Database dashboards for JSON paths, users, and app activity
Connect Firebase Realtime Database to Chartbrew and turn JSON paths, app records, users, events, statuses, timestamps, counters, and operational data into live dashboards.
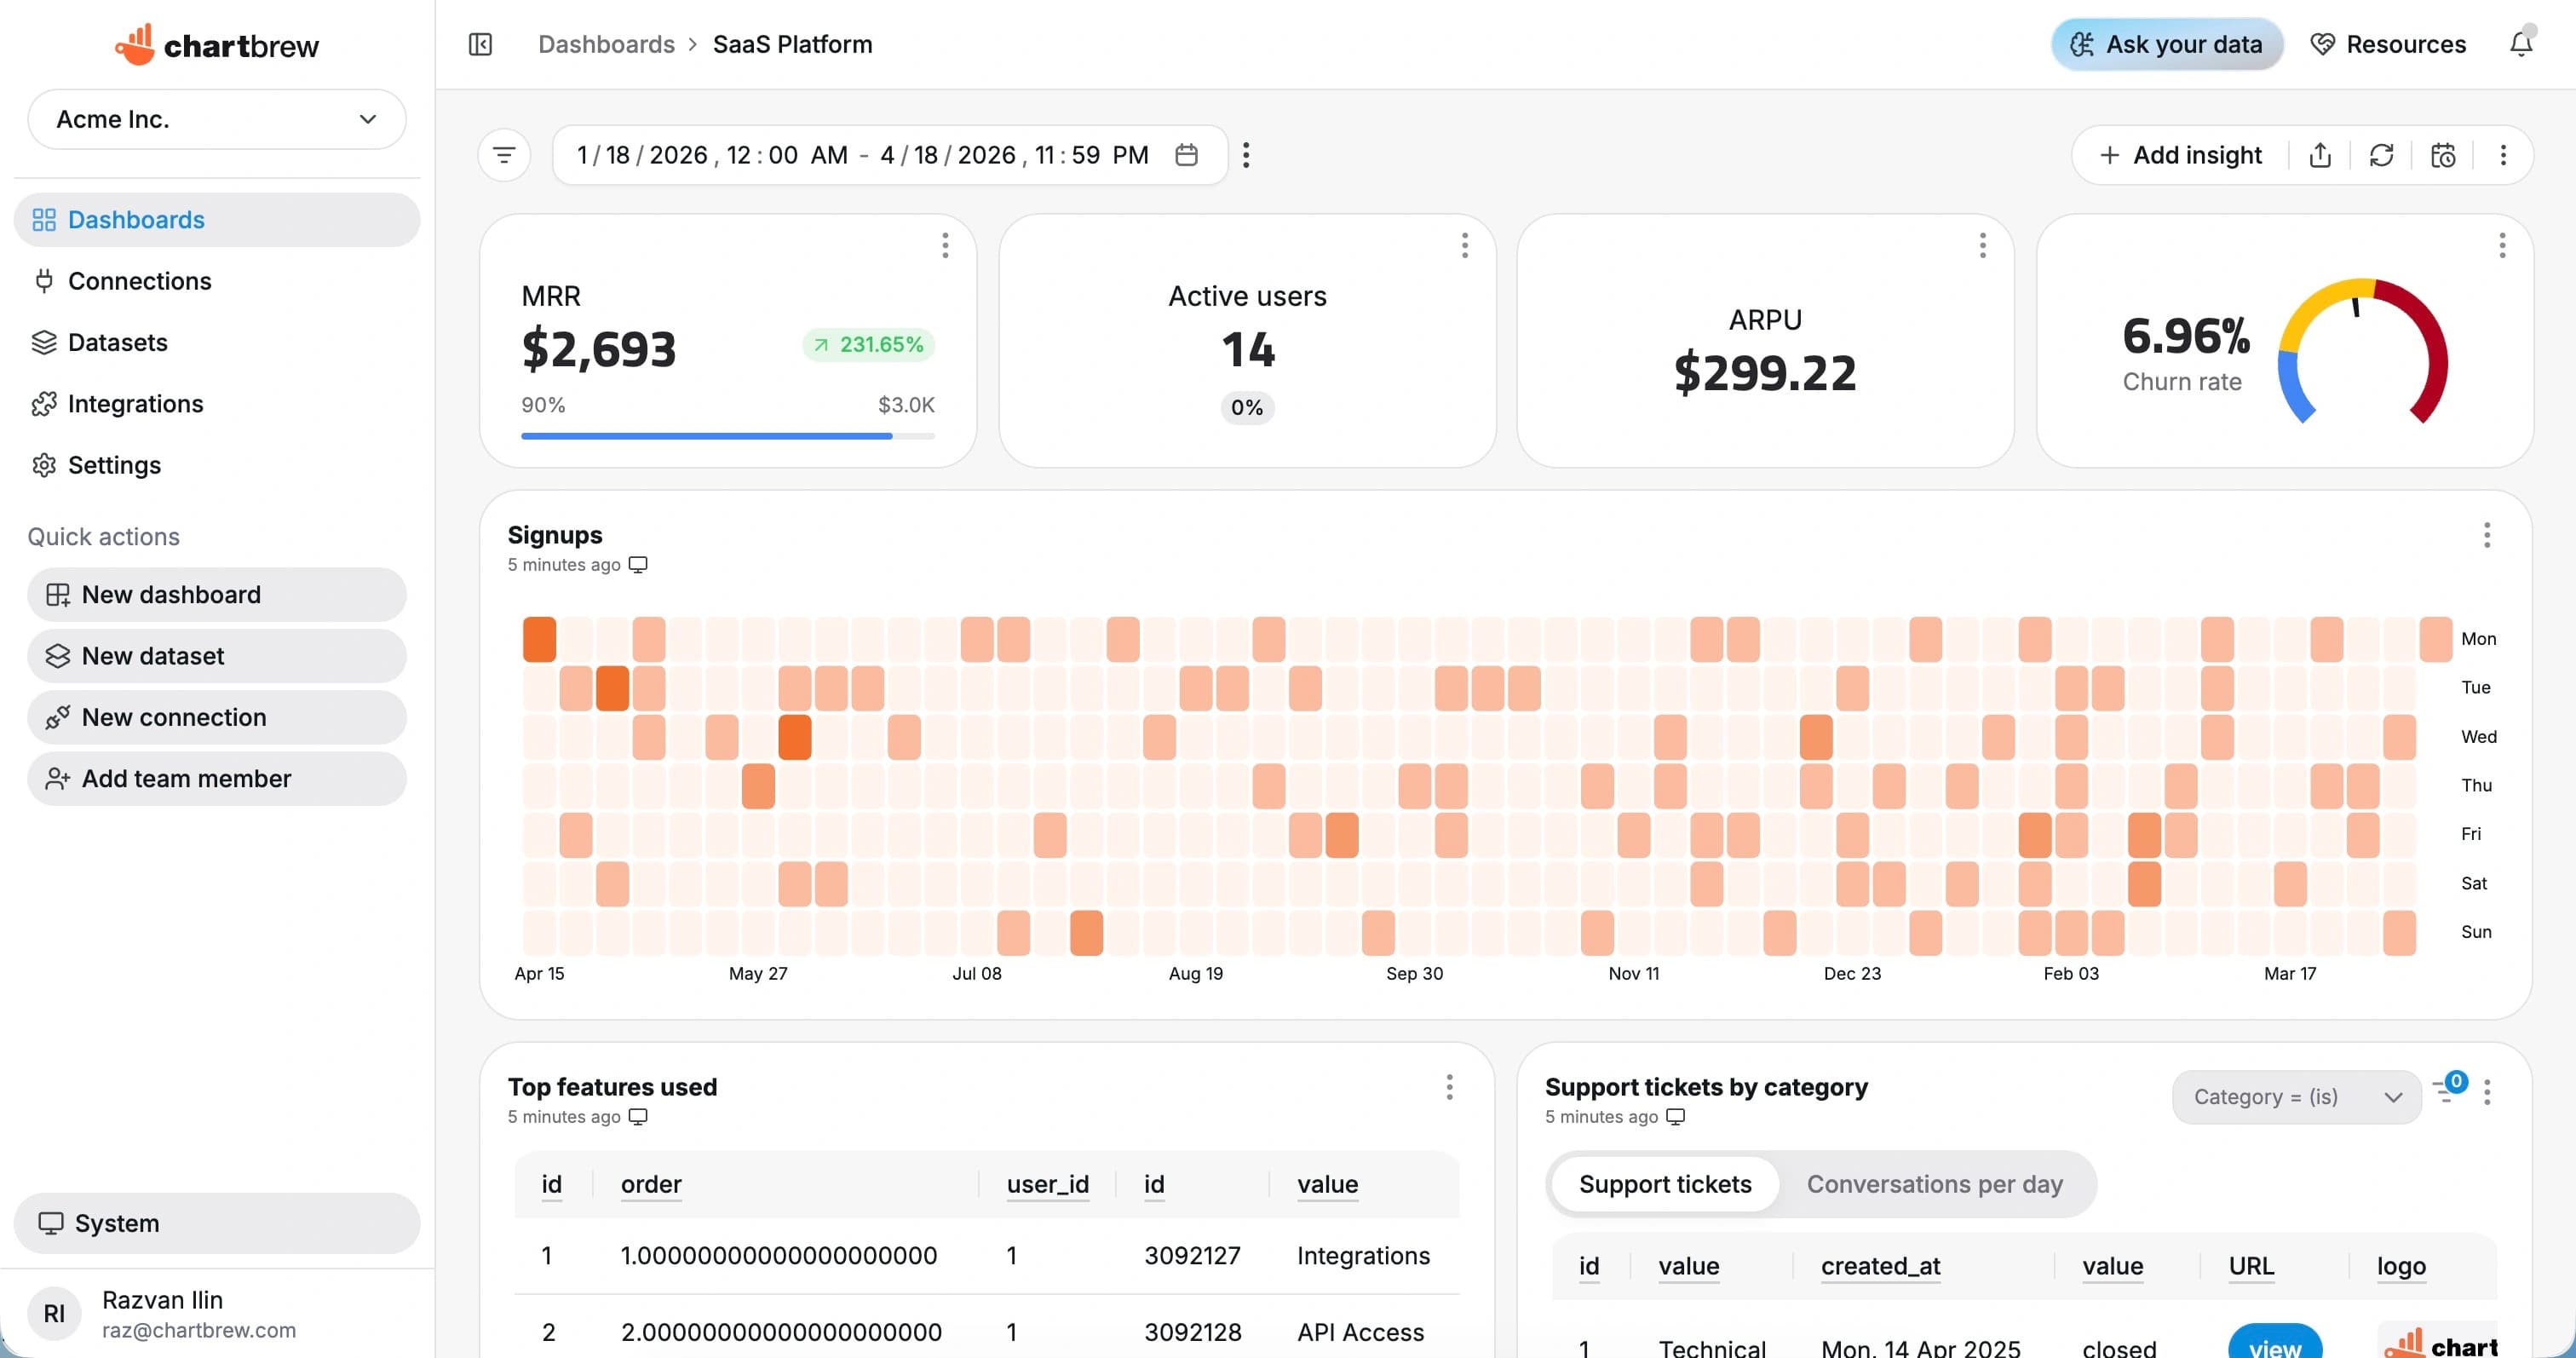
What You Can Track
Realtime Database metrics for app and operations reporting
Use Chartbrew to report on JSON records and Firebase application data without writing a custom admin reporting interface.
Path totals
Track counts and summaries from important JSON paths in your database.
User activity
Report on users, sessions, devices, accounts, or app events stored in Realtime Database.
Status breakdowns
Group records by status, type, role, region, plan, or workflow state.
Timestamp trends
Chart created, updated, completed, or event timestamps over time.
Operational tables
List stale records, pending items, recent updates, or records that need review.
Filtered dashboards
Reuse dashboard views across projects, customers, regions, apps, or environments.
How It Works
From Firebase Realtime Database connection to live dashboard
The Firebase Realtime Database workflow is built around a source connection, reusable datasets, scheduled refreshes, and shareable dashboards.
Connect Realtime Database
Add a Firebase service account with access to the Realtime Database you want to report on.
Choose the reporting scope
Choose JSON paths, fields, filters, date fields, and grouping dimensions for your dashboard datasets.
Create datasets
Turn the response fields you need into KPI, chart, and table datasets with filters and date ranges.
Share live reporting
Publish dashboards, embed reports, or send scheduled snapshots so reporting stays repeatable.
Why Chartbrew for Firebase Realtime Database
Dashboards for Firebase data without custom reporting code
Chartbrew gives Realtime Database records a shareable dashboard layer with refresh schedules, snapshots, embeds, and AI-assisted exploration.
JSON path reporting
Build datasets from Realtime Database paths and fields that matter to product and operations teams.
Application dashboards
Turn app records into charts for users, devices, events, statuses, and workflow activity.
AI-assisted exploration
Use Chartbrew AI to draft dataset and chart ideas around Firebase data.
Scheduled refreshes
Keep Realtime Database dashboards current with automatic refresh schedules.
Secure sharing
Share dashboards and snapshots without giving every viewer Firebase console access.
Cross-source context
Combine Firebase metrics with GA4, Stripe, APIs, SQL databases, and Customer.io.
Setup Requirements
What you need before connecting Firebase Realtime Database
Start with the right Firebase Realtime Database access, a clear reporting scope, and a few fields that map to useful dashboard metrics.
A Firebase project with Realtime Database enabled
A service account with permission to read the database paths used for reporting
Database URL and target JSON paths for the first datasets
Timestamp, status, user, numeric, or category fields for useful dashboards
Optional customer, project, app, environment, or region filters
| Dataset idea | What it can power |
|---|---|
| Records by status | JSON records grouped by status, type, or workflow state |
| New records | Records created by day, week, or month |
| Active users | Users or accounts with recent timestamps or event records |
| Path summary | Counts and numeric totals from important database paths |
| Pending records | Items waiting for sync, review, approval, or completion |
| Recent updates | Latest records sorted by updated timestamp |
| Event activity | Events grouped by name, user, or app version |
| Environment view | Metrics filtered by app, project, environment, or tenant |
Setup Guide
Follow the Realtime Database visualization guide
Use the walkthrough to connect Firebase Realtime Database, choose JSON paths, and build your first Chartbrew dashboard.
Related Features
Features that make Firebase Realtime Database reporting useful
Use Firebase Realtime Database dashboards with Chartbrew automation, AI workflows, sharing, embeds, filters, and reporting tools.
Reporting API
Use Chartbrew alongside API-driven reporting workflows when teams need dashboards and programmable access.
Webhooks
Trigger reporting workflows and keep dashboards aligned with events from the rest of your stack.
Chartbrew AI
Turn API, product, marketing, and operational questions into chart and dataset ideas faster.
Data update schedules
Keep API dashboards refreshed on the cadence your reporting workflow needs.
Dashboard snapshots
Send recurring API dashboard snapshots to stakeholders without rebuilding weekly status reports.
Embedded reports
Publish API-powered charts inside client portals, internal tools, and shared reporting pages.
FAQ
Firebase Realtime Database integration questions
Practical details about using Firebase Realtime Database data in Chartbrew dashboards.
Build your Realtime Database dashboard
Turn Firebase JSON paths into live reporting dashboards
Connect Realtime Database, create reusable datasets, and share app, user, event, and operations reporting.
