Chartbrew v5.2.0, Jira dashboards, better AI tools, and smarter schedules
Chartbrew v5.2.0 is out
This release continues the work from v5.1.0 by expanding Chartbrew's source plugin system and making the AI orchestrator more useful across different connection types.
The main highlight is the new Jira integration, which makes it easier to build dashboards around project delivery, sprint progress, issues, story points, and team workflows. This release also improves how Chartbrew's AI understands and works with connected sources, especially APIs, Firestore, RealtimeDB, Customer.io, Google Analytics, and database-backed queries.
What's new
Jira integration
Chartbrew now includes a Jira connection, giving teams a new way to turn project and sprint data into dashboards.
This is useful for tracking things like issue status, sprint completion, story points, team workload, and delivery metrics without needing to manually export data from Jira.
Read more about how to get started with the Jira integration here.
Better AI orchestration
The AI orchestrator received a big upgrade in this release. It now has clearer source tools, better connection-specific context, and broader support across Chartbrew's integrations.
AI support was added or improved for:
- Firestore
- RealtimeDB
- Customer.io
- Google Analytics
- API connections
- Database query generation
This should make AI-assisted dashboard and dataset creation feel more predictable, especially when working with different types of data sources.
AI dashboard creation
The orchestrator can now help create dashboards, not just individual charts or datasets. This is another step toward letting Chartbrew guide users from connected data to usable reports faster.
Empty dashboard starter guide
New empty dashboards now include a starter guide to help users figure out what to do next. This should make the first dashboard setup clearer, especially when users already have connections or datasets available.
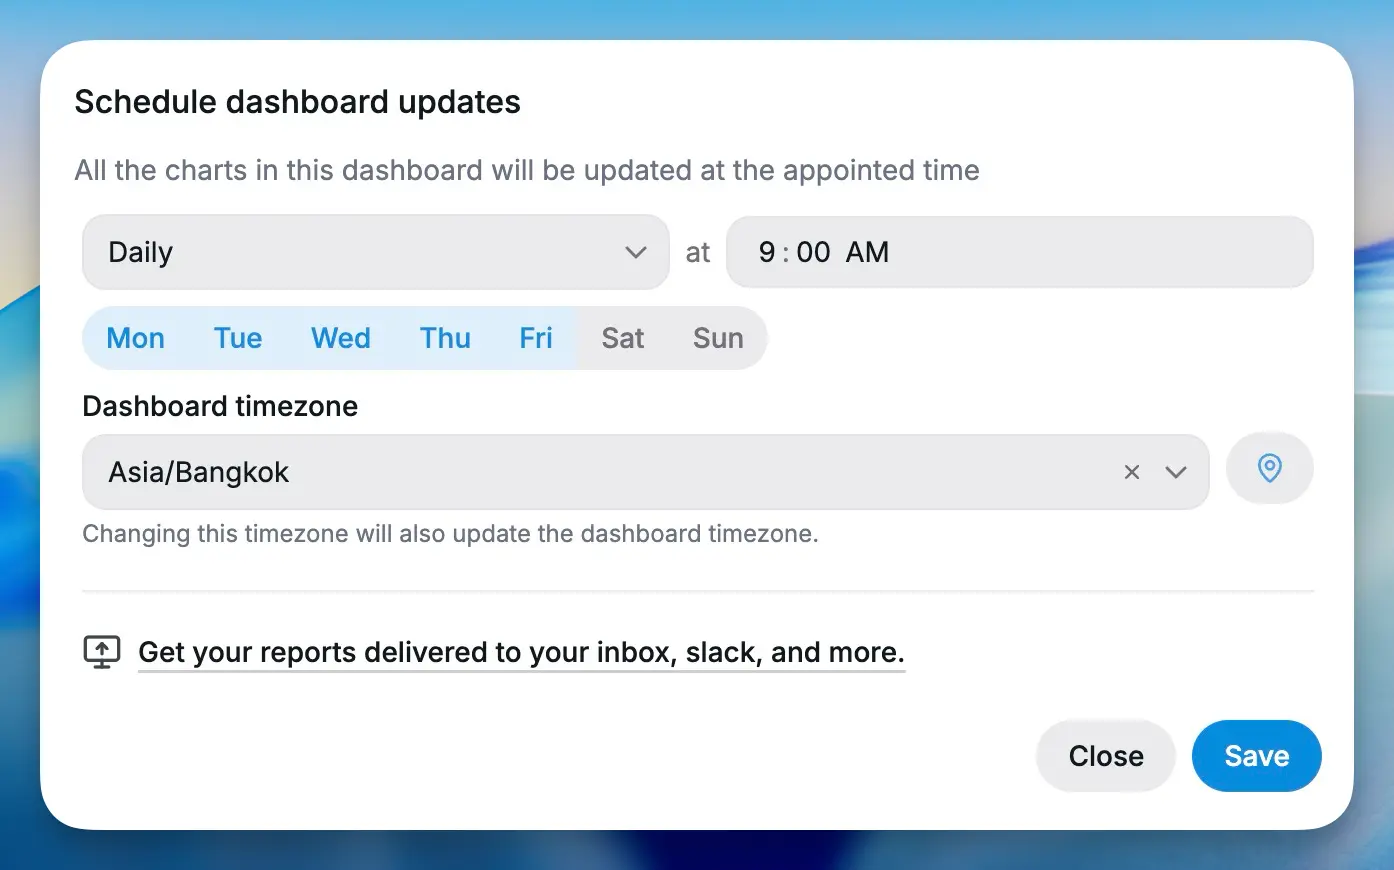
Weekly schedule controls
Dashboard update and snapshot schedules now support selecting specific days of the week. This gives teams more control over when dashboards refresh and when snapshots are sent.
For example, you can now configure reporting to run only on weekdays, or only on the days your team needs updated reports.
Improvements and fixes
This release also includes a new navbar inbox that shows the latest Chartbrew blog articles, improvements to the AI modal, better tool display names, and CI optimisations to avoid unnecessary Playwright installs.
A few important fixes also landed:
- Fixed Stripe compiled metric calculations.
- Fixed monthly interval summing regressions.
- Fixed Jira JQL issues when variables are used as date boundaries.
- Fixed an issue where the orchestrator did not refresh chart data after changing a dataset.
Summary
Chartbrew v5.2.0 is focused on three things: better integrations, better AI support, and smoother dashboard setup.
The Jira integration opens up a new reporting use case for product and engineering teams, while the AI improvements make Chartbrew more capable across the growing source plugin system. The new scheduling controls and dashboard starter guide should also make day-to-day reporting a bit smoother.
