Chartbrew v2 and beyond
It took almost 2 years' worth of work to get to v2 from the initial out of Beta in November 2020. The new version is a culmination of updates added to the platform during this time and a complete UI re-design to modernize the look and feel.
In this blog post, I'm going to go through some of the major updates that Chartbrew has seen in these last 2 years, what is coming next, and how I'm planning to make this a sustainable business moving forward.
What's new in Chartbrew v2
This section will go through the updates in no particular order.
New UI with Dark Mode support
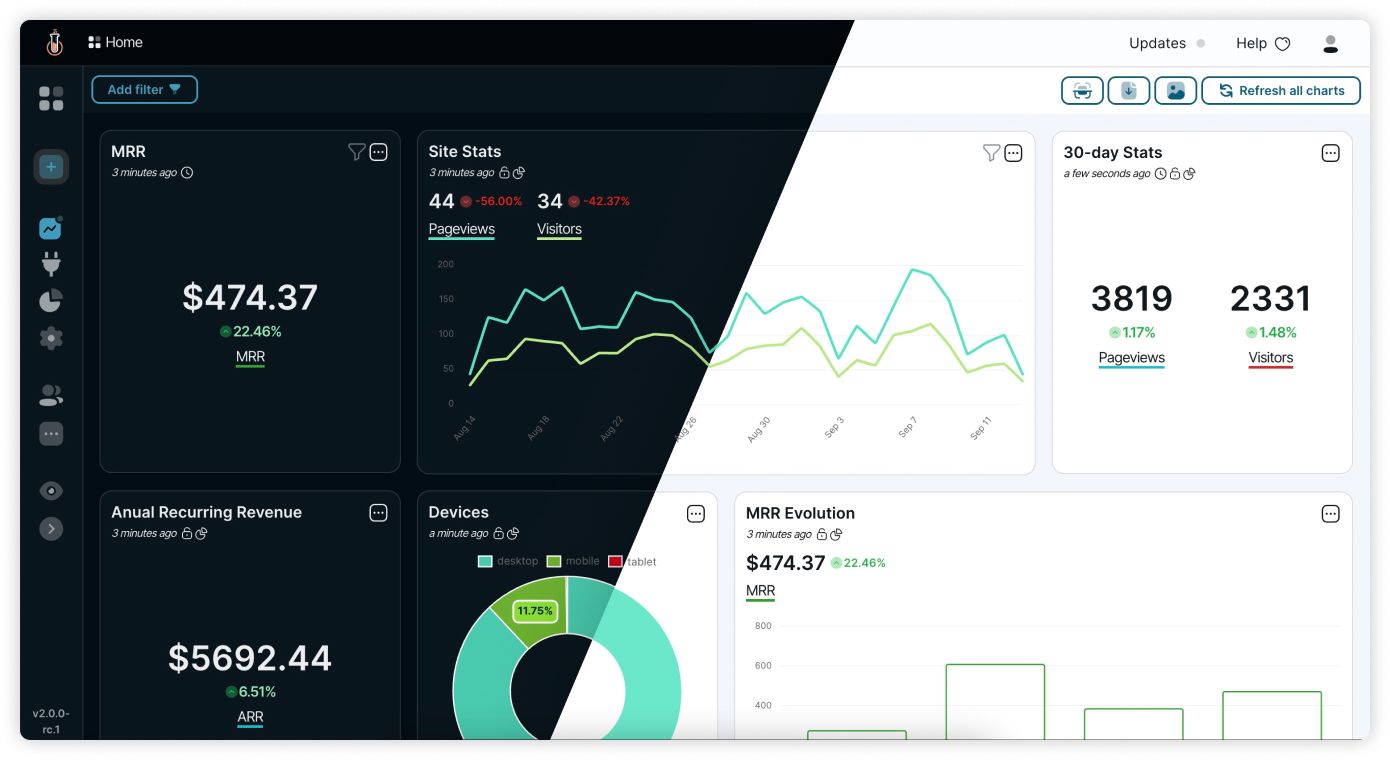
The UI is completely changed from the previous version, but the location and functionality of the features remain the same. These will be improved incrementally in v2 to not confuse the users with a drastic change.
The new UI is more fluid, modern, and comes with dark mode support out of the box. Rest your eyes while looking at those shiny charts of yours!
Fully customizable client reports
This update is central to making Chartbrew a good observability tool for the team that is using Chartbrew but also makes it easy to share this information with stakeholders. The result was a separate view of the main dashboard that can be customized to match the company's branding.
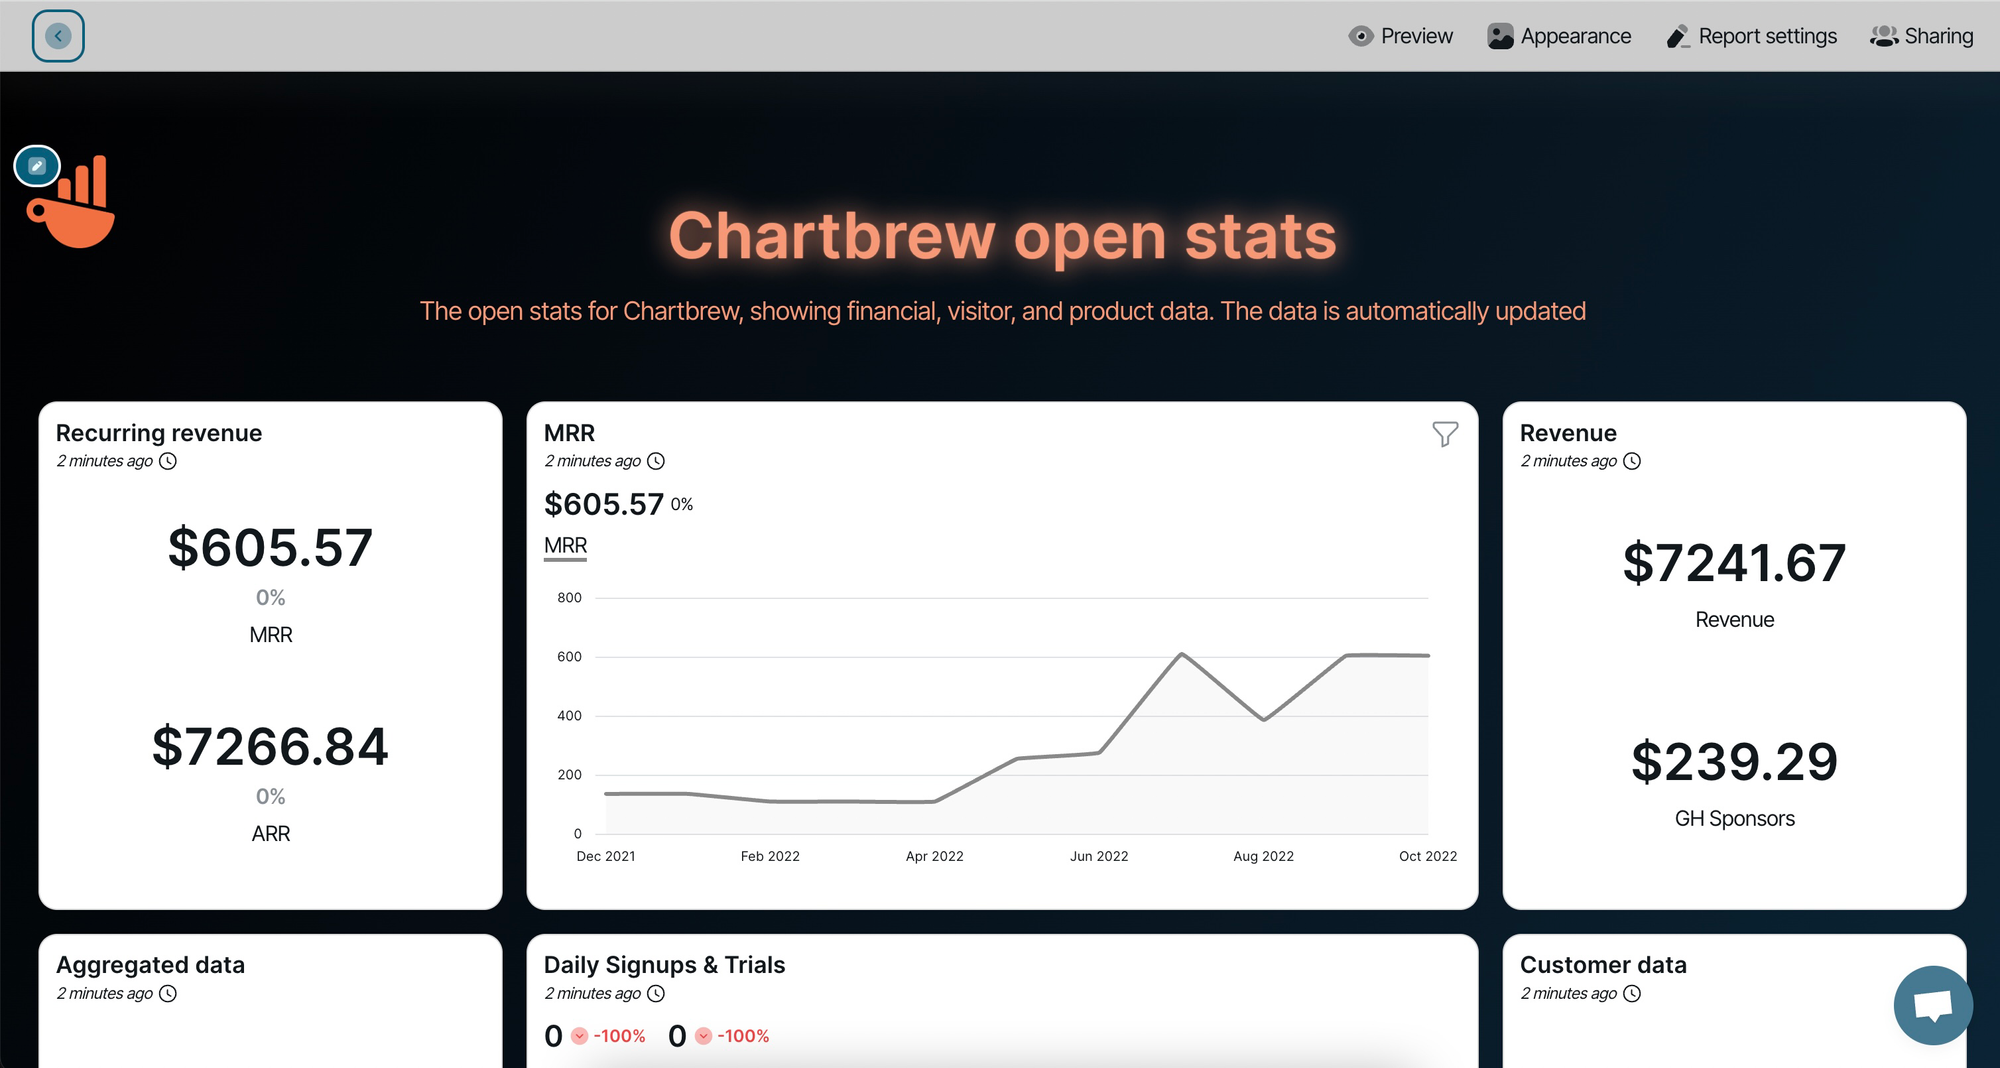
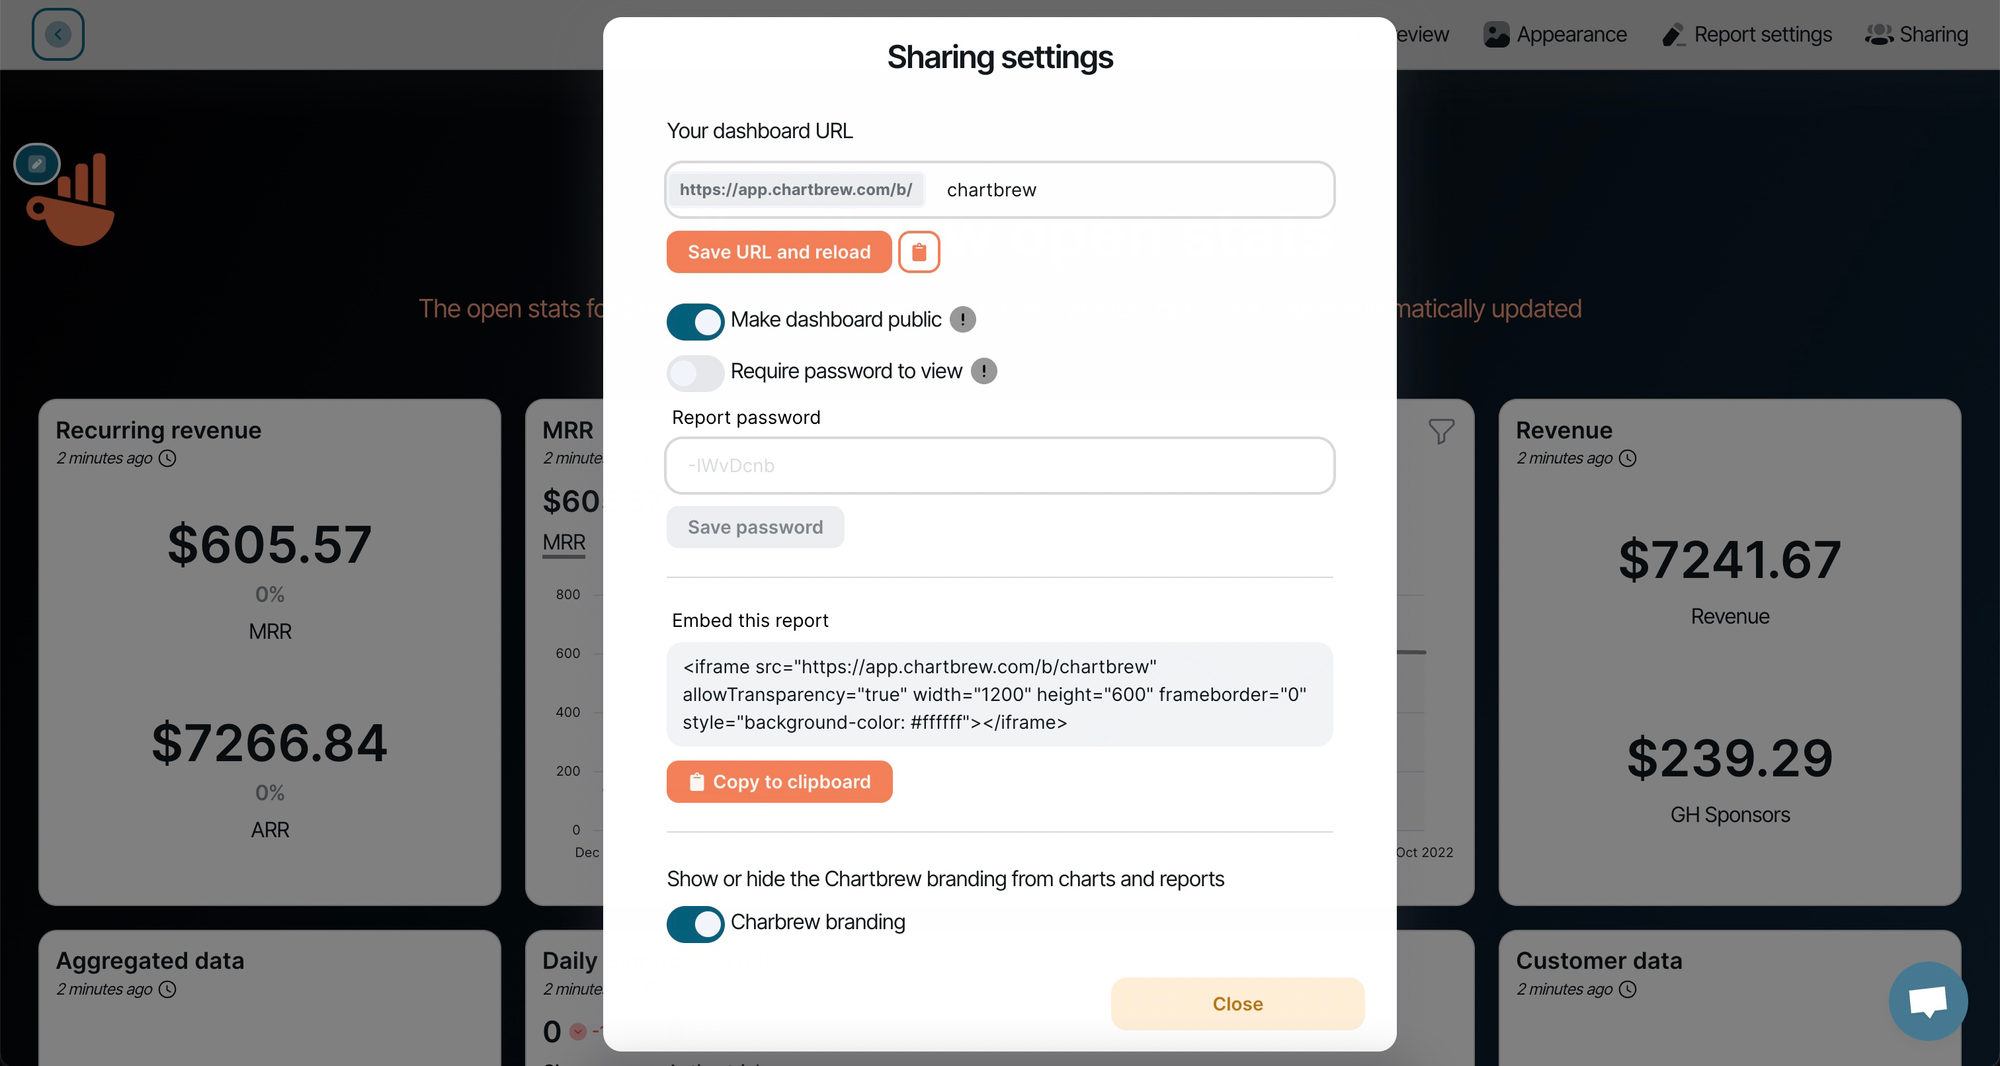
The report is also easy to share with multiple options such as completely public, password-protected and embedded on a 3rd party site.
 Razvan Ilin
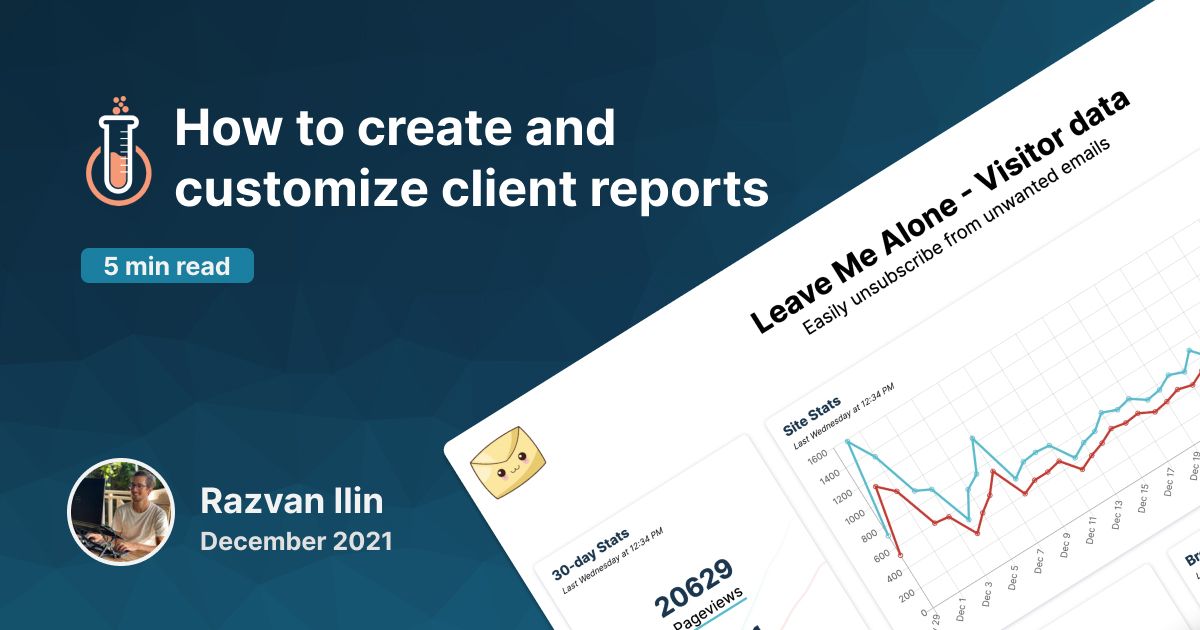
Firebase Realtime Database integration
Something few competitors have tried is to integrate Firebase into their tools. Chartbrew now does this and users can connect to their Firebase Realtime Database to visualize their data.
Razvan Ilin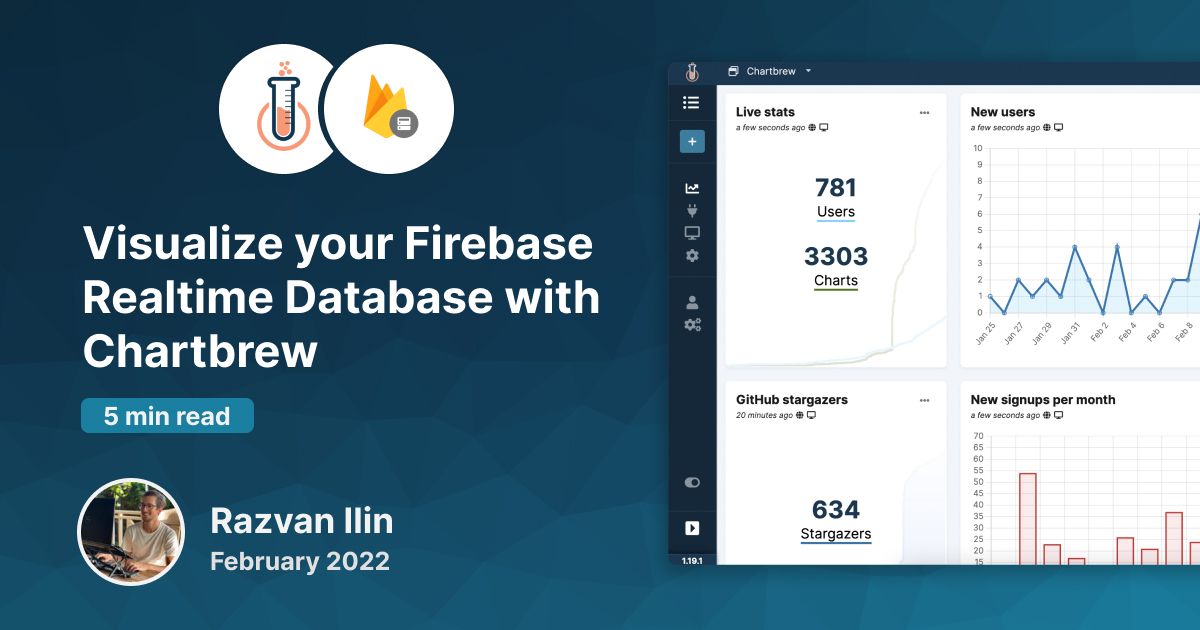
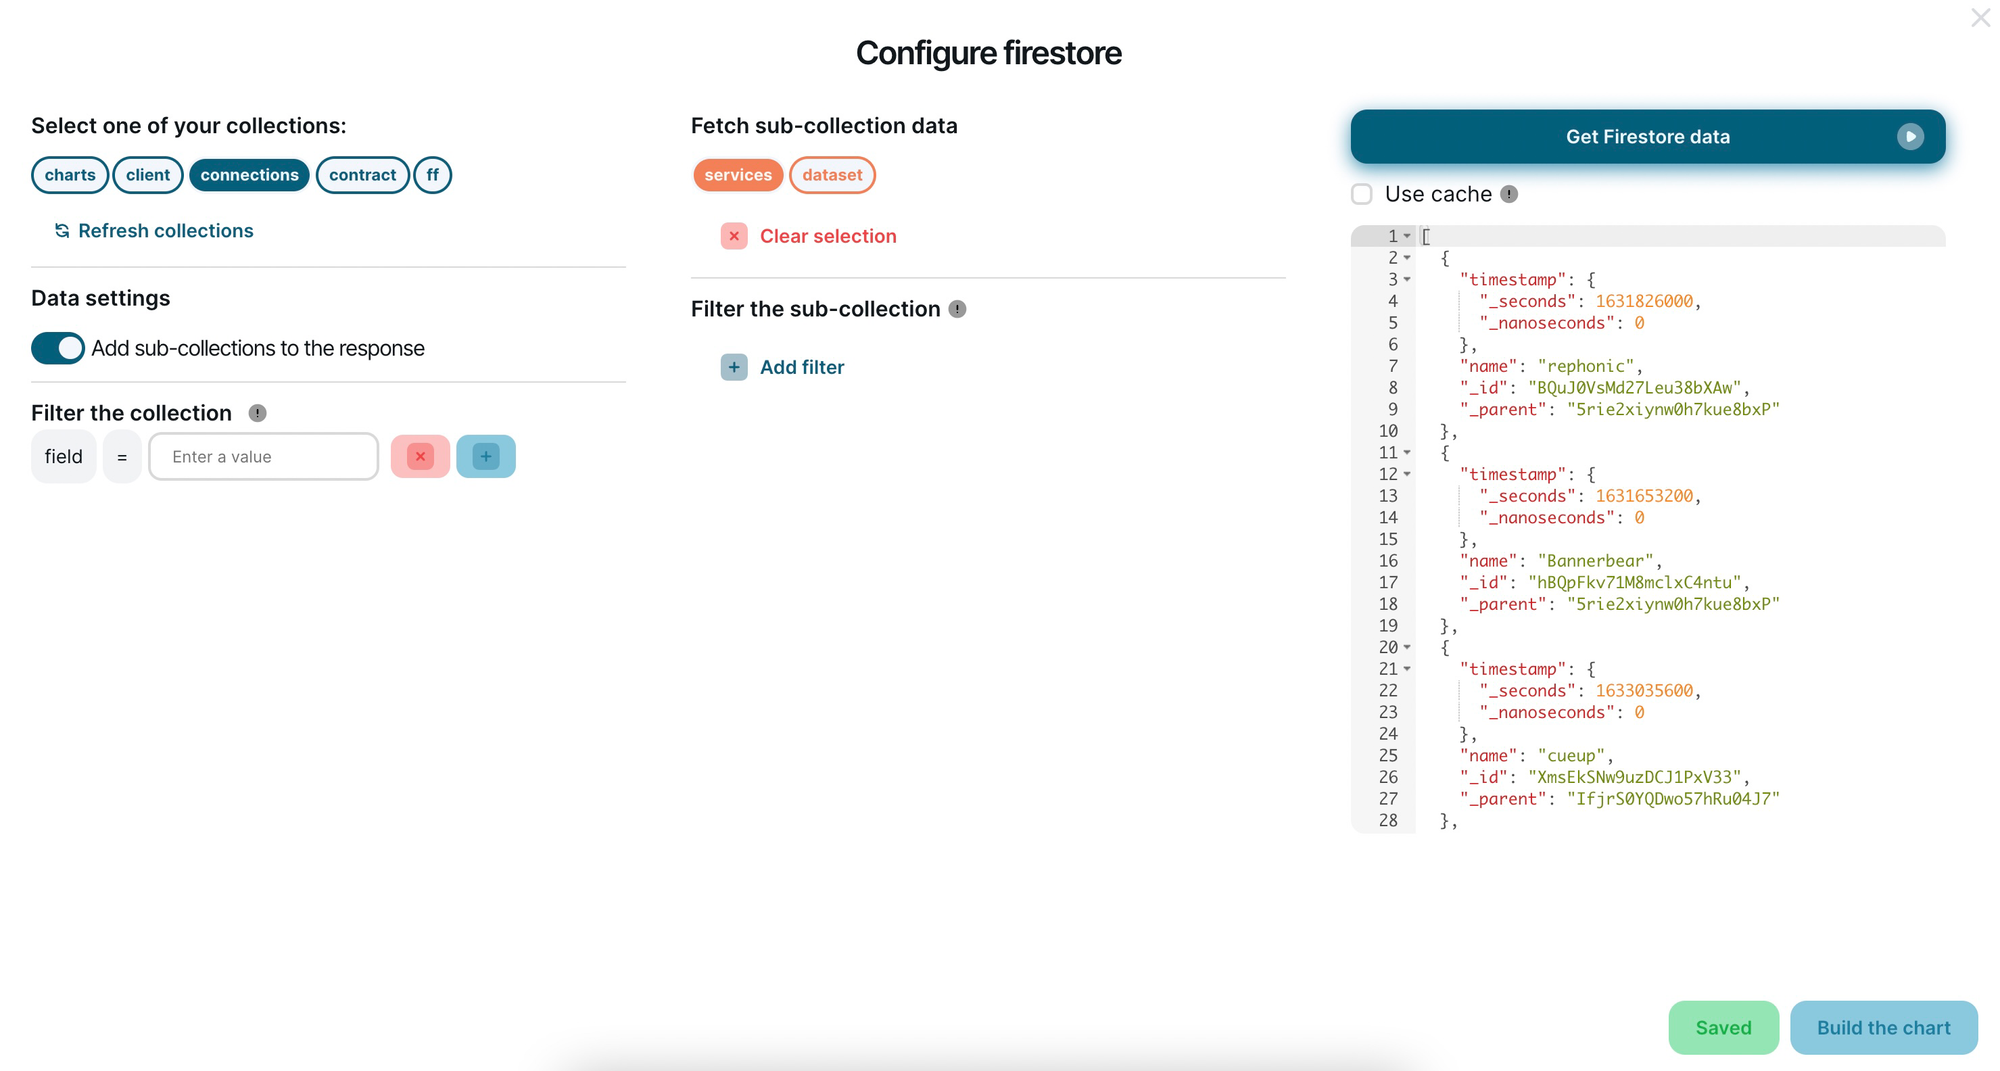
Firestore integration
Users can also connect to Firestore to visualize their data. The connection for both Realtime Database and Firestore works in the same way, but the data fetching UI is slightly different. The interfaces are both no-code, so there is no need to know how to code to get the data you want to visualize.
 Razvan Ilin
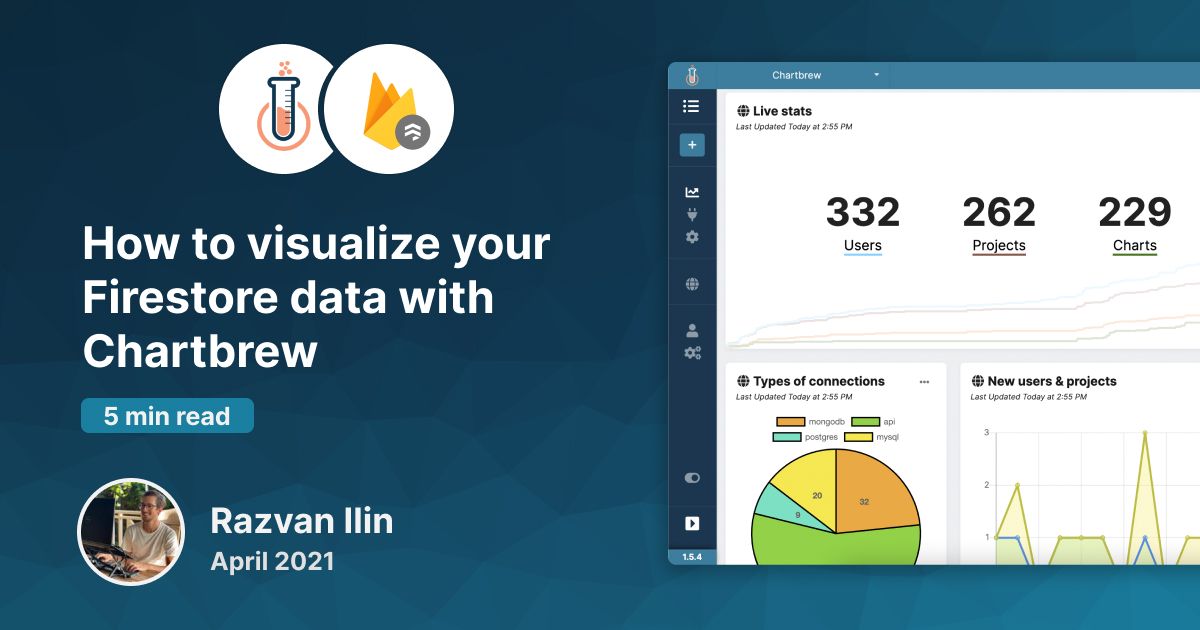
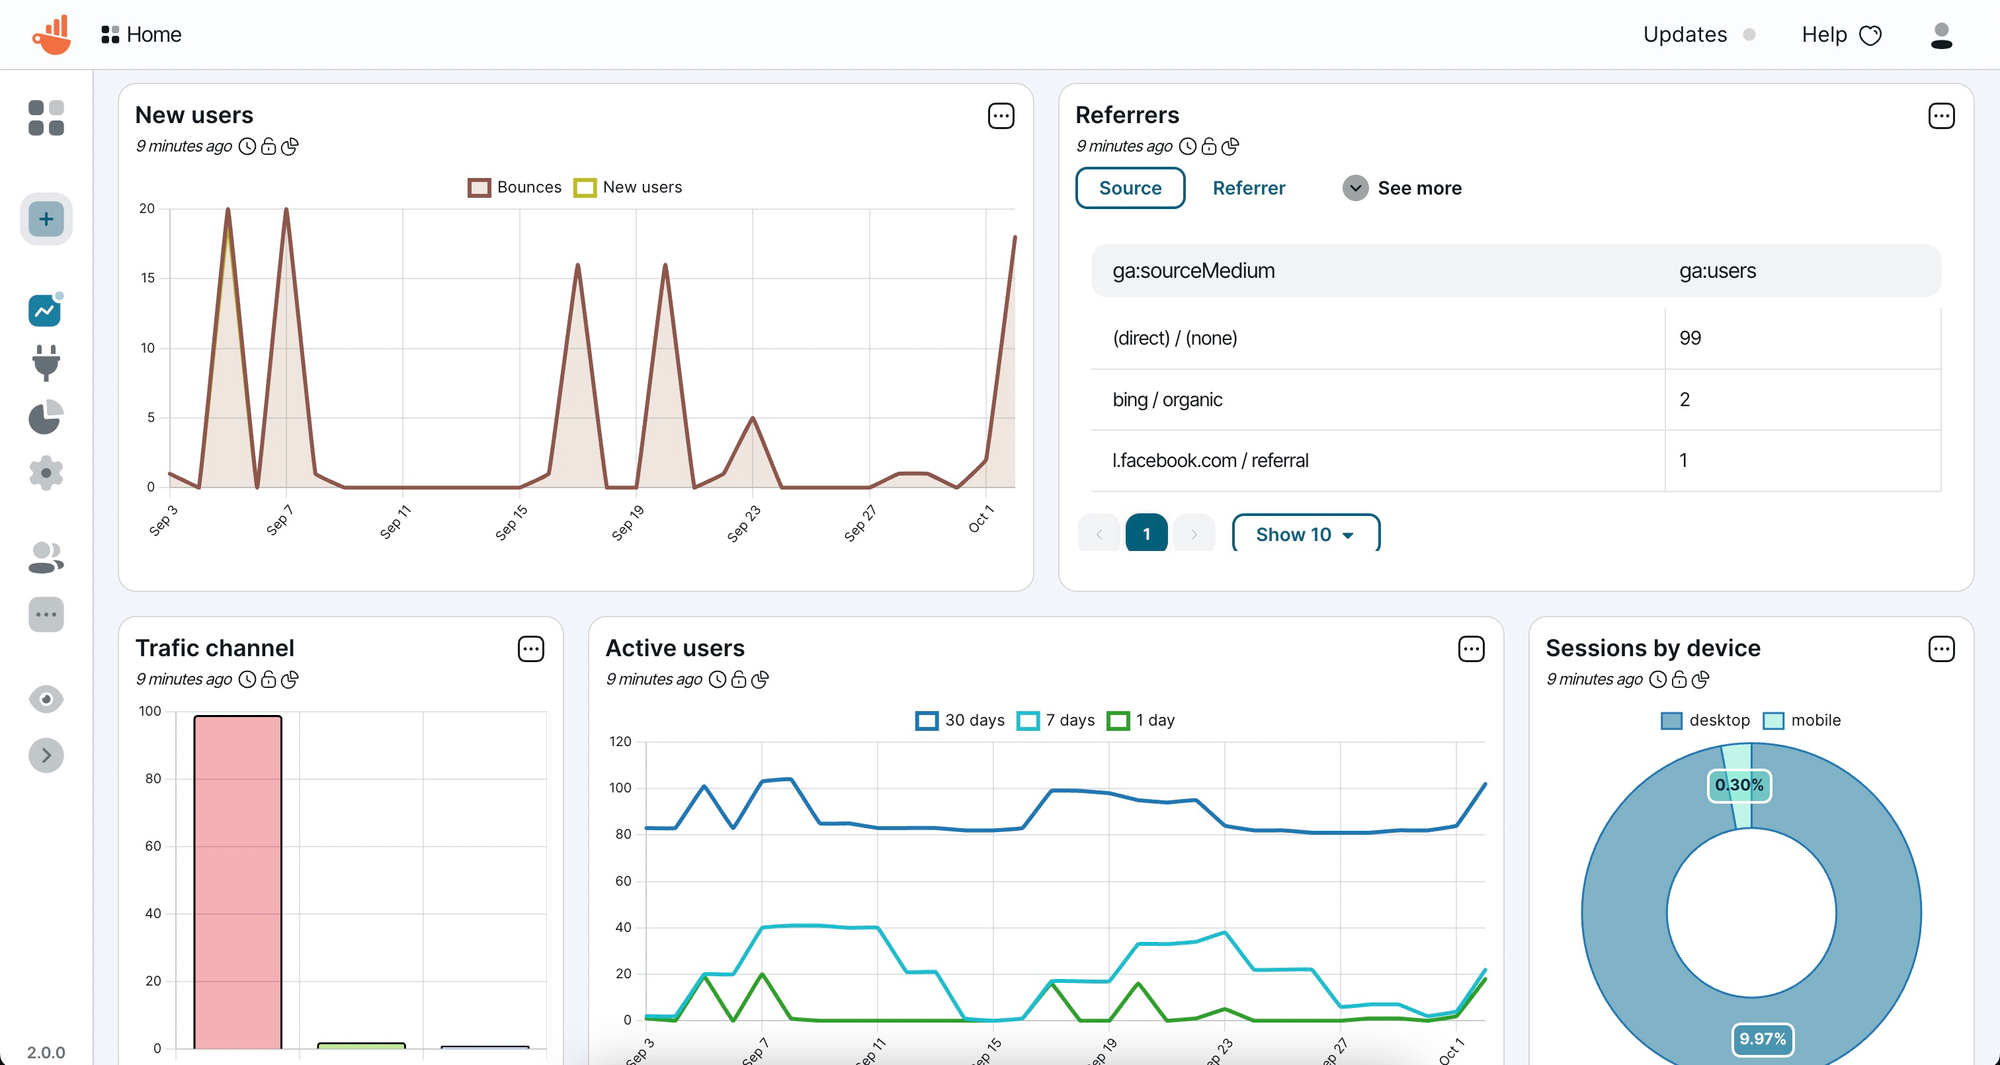
Google Analytics integration
Highly requested, Google Analytics made an appearance in Chartbrew, and also got its template on the platform. The template generates some of the most common visualizations that you get in the GA UI as well. This integration will be updated in v2 to support GA4 properties.
 Razvan Ilin
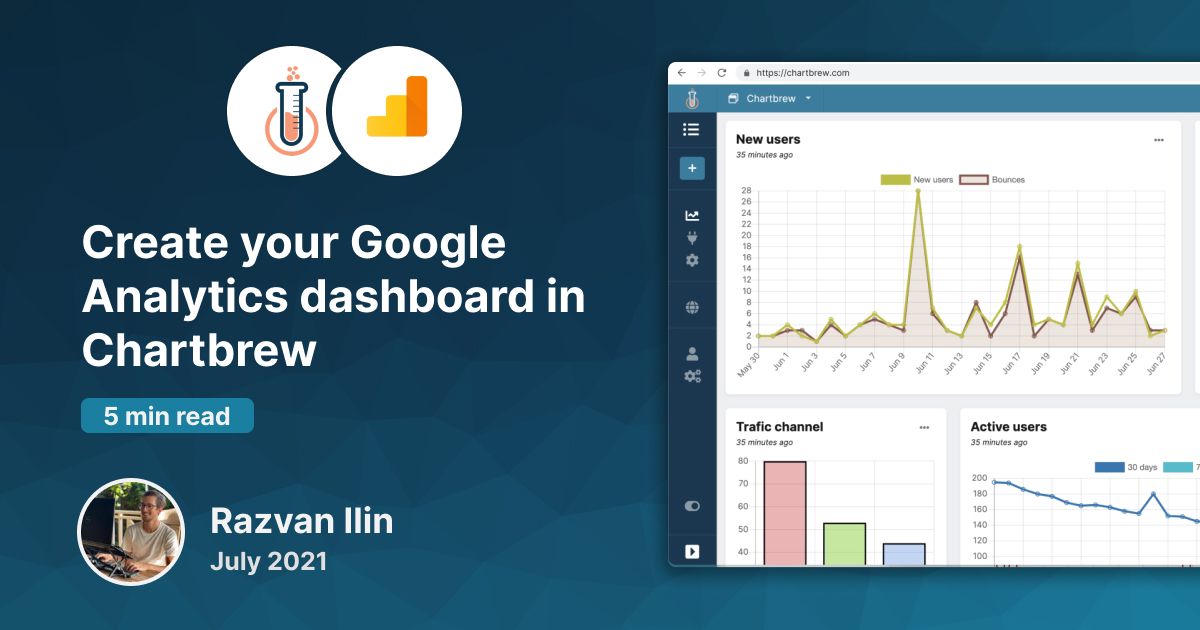
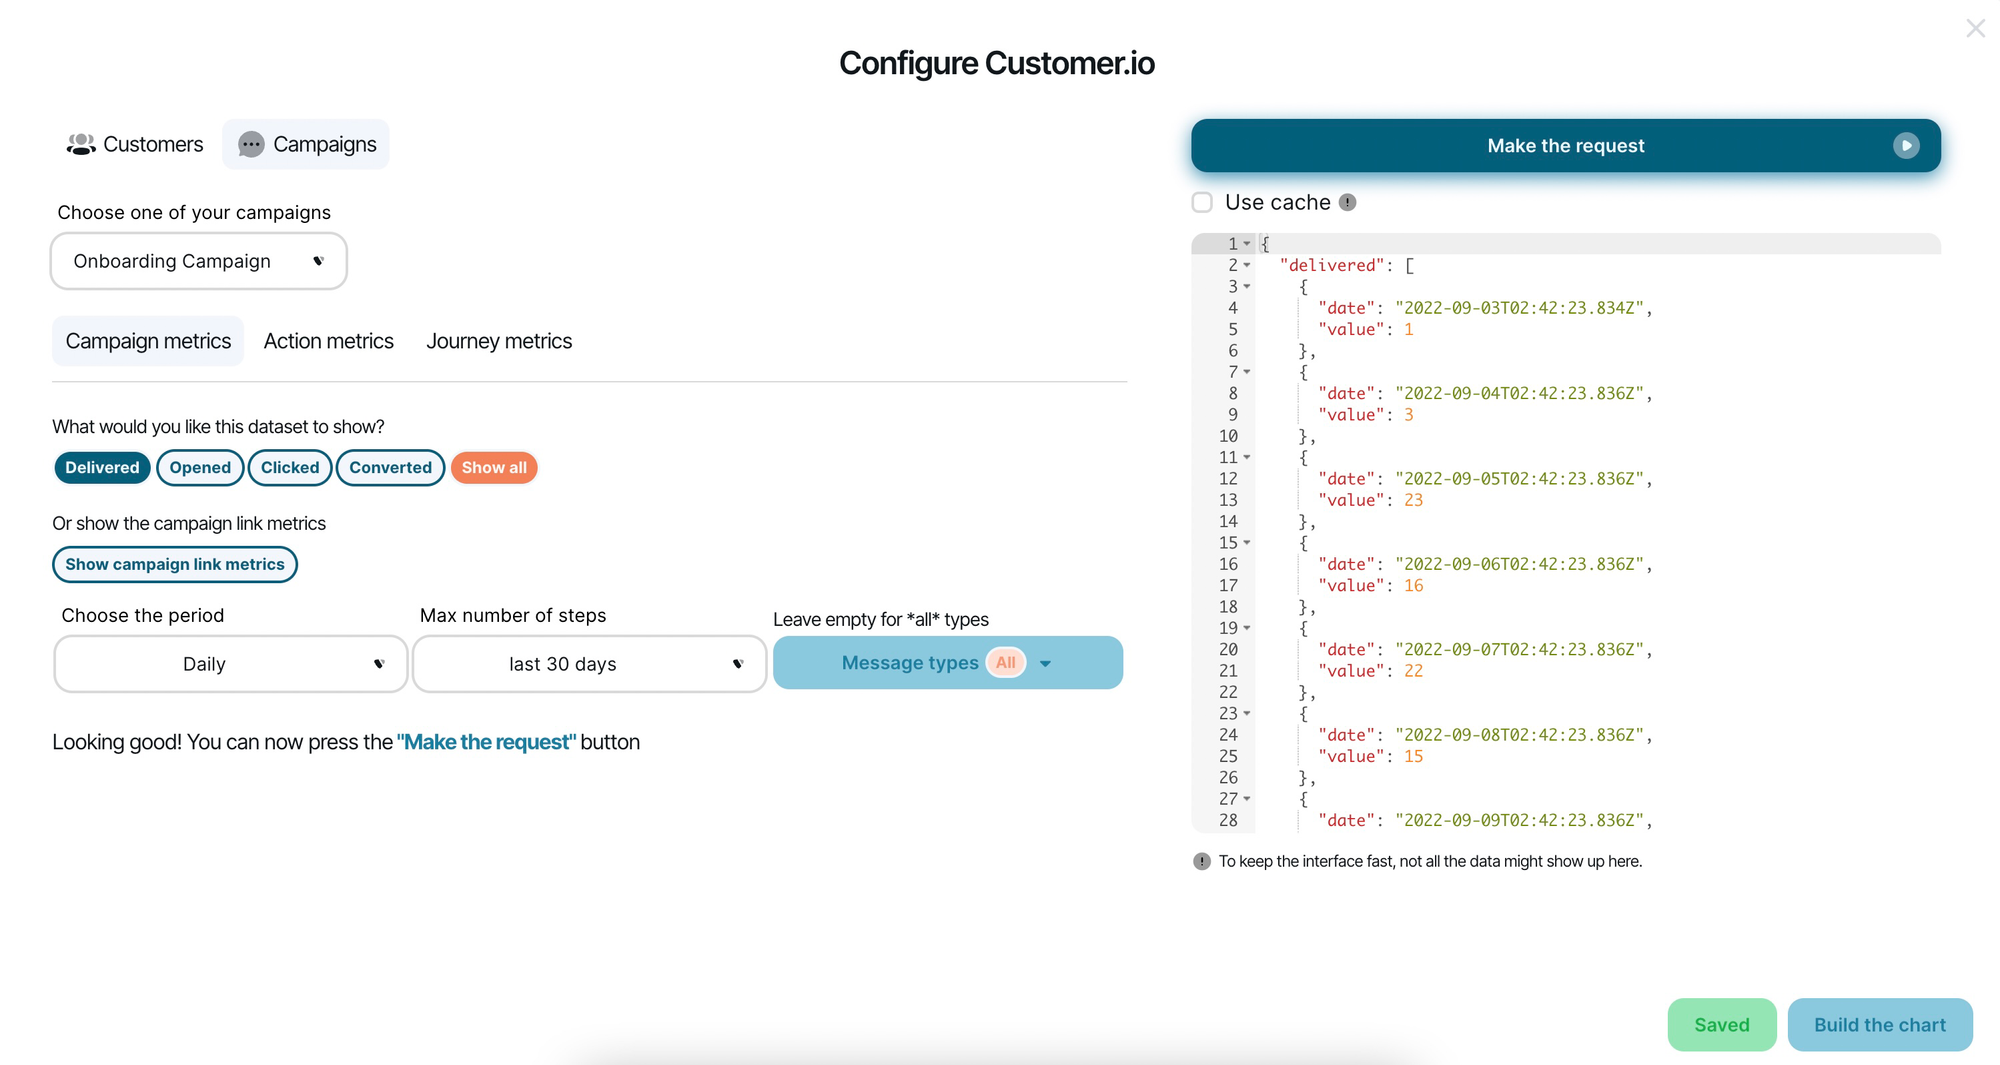
Customer.io integration
The customer.io integration required a bit more work, but it is quite powerful and offers a lot of customization options. When working on this integration, I also had the pleasure to work closely with a customer of both Chartbrew and Customer.io, which helped me design an optimal experience using the integration.
The integration covers both customer and campaign stats. The integration for campaigns can go even deeper and give information about how customers interact with a single action in the campaign or even links in emails.
 Razvan Ilin
Dashboard templates
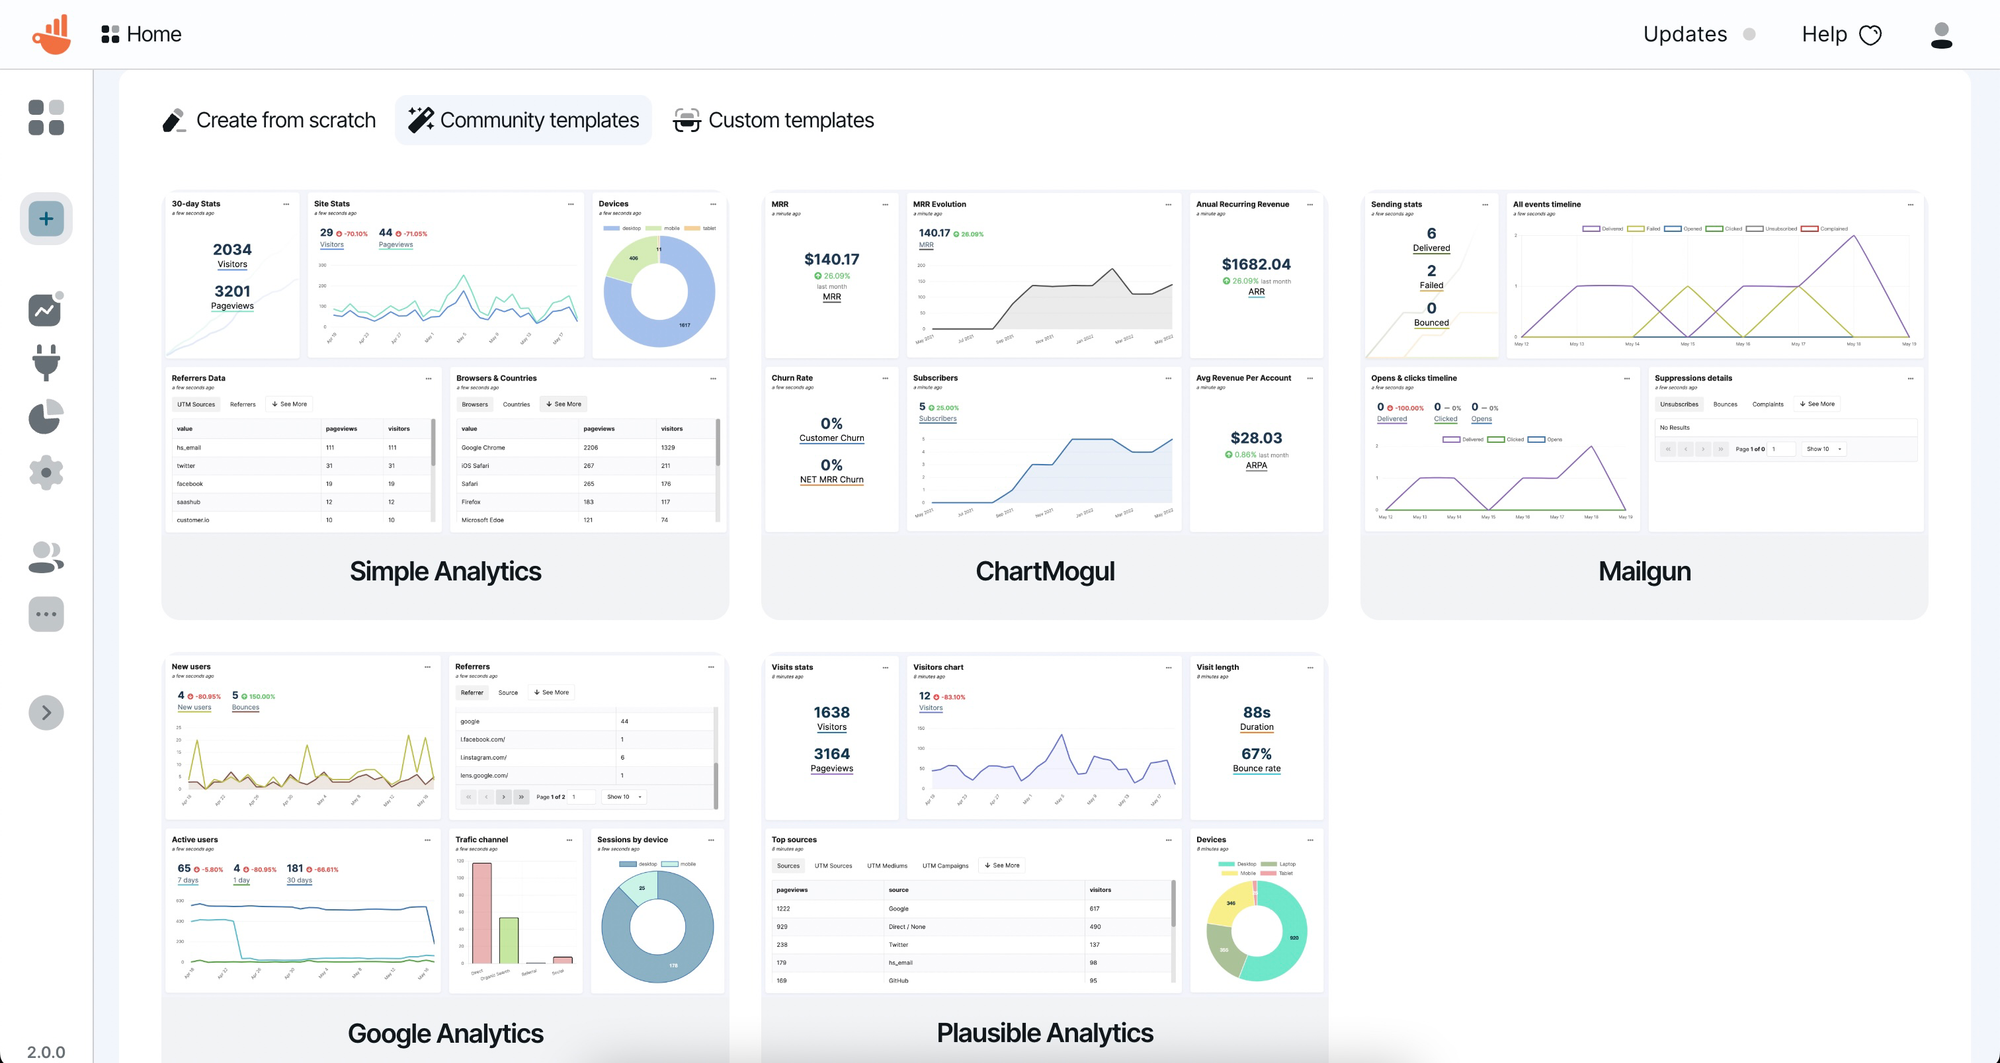
The dashboard templates feature is still in the early version of the implementation as I have big plans for this one. Currently, it's possible to use community templates, which are pre-made dashboards that just require connection parameters to connect to your data sources. These templates will then automatically create visualizations for you.
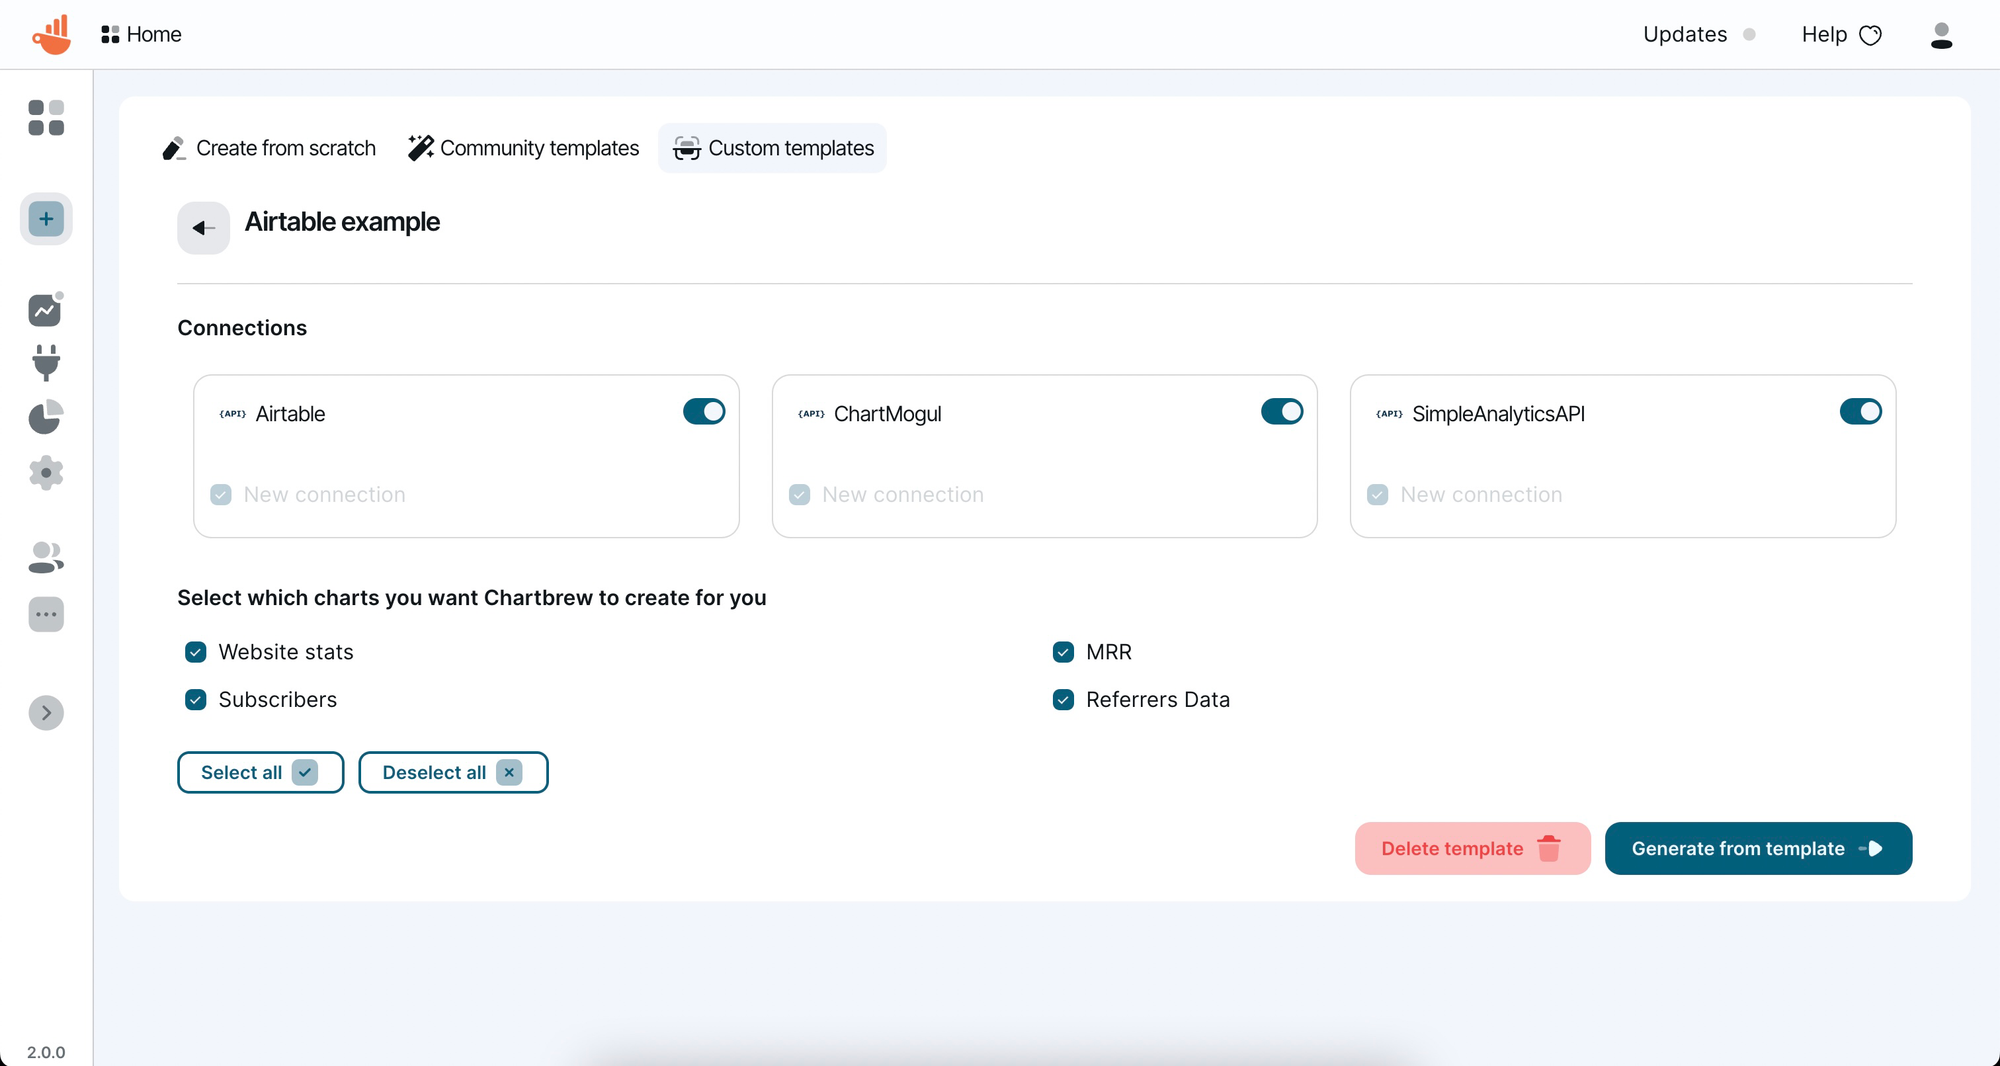
The other option is for each team to have a collection of templates that they can reuse within their organization. Users can create complete dashboards from these templates, or choose only some of the charts in a template to add to an already existing project.
 Razvan Ilin
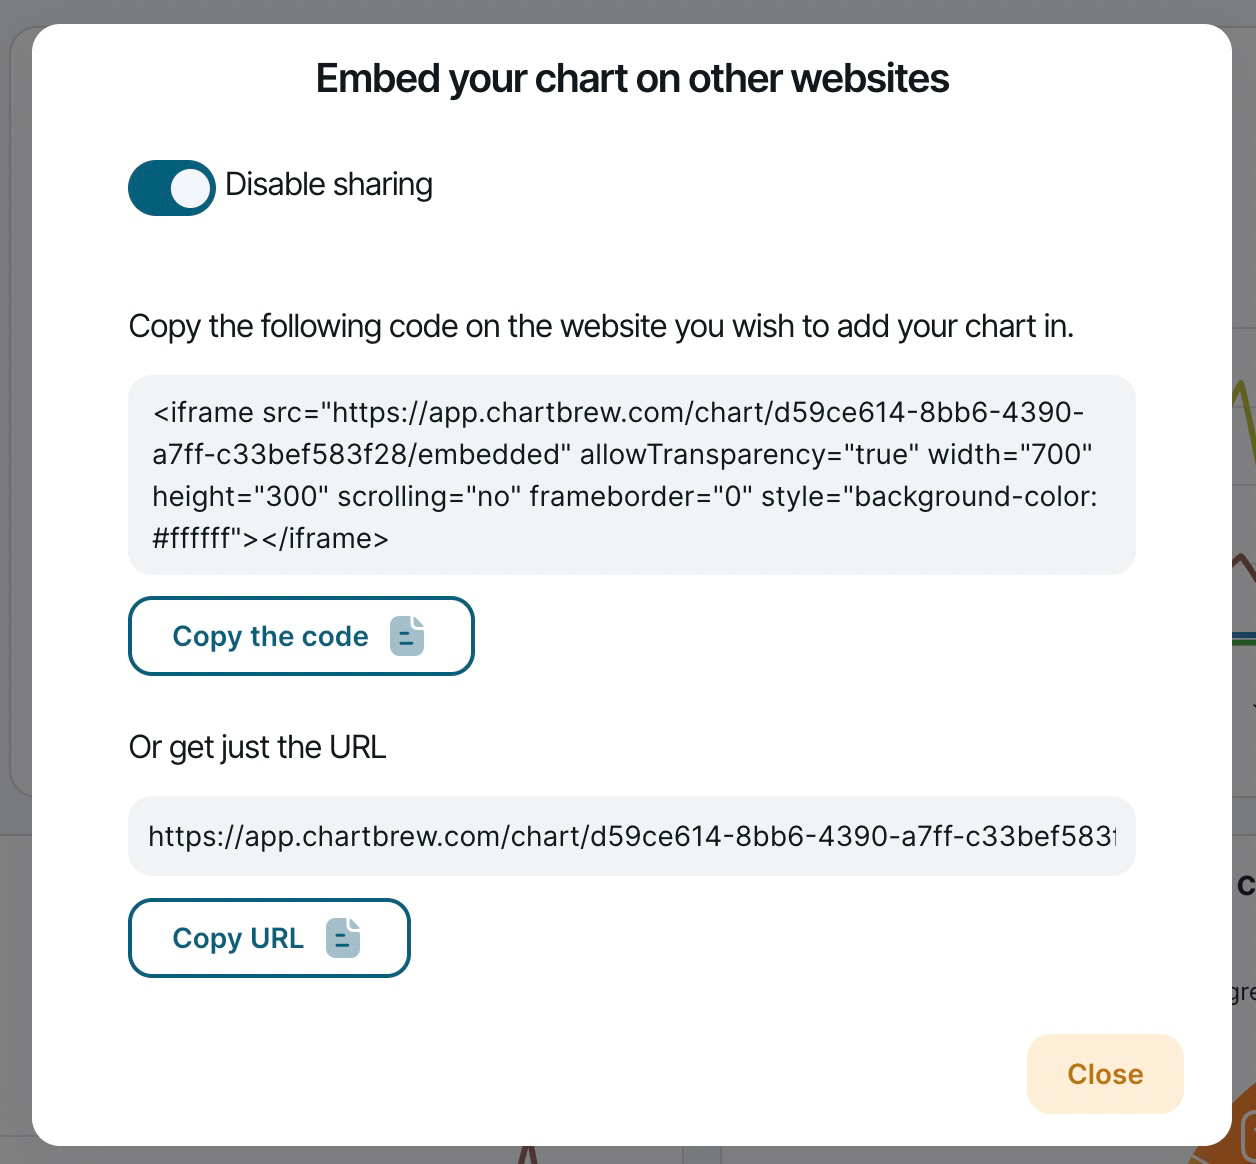
Sharing charts with direct links
Previously, it was possible to share charts by making them public, so the platform was reliant on a flag to be on or off. With the new updates, the chart-sharing feature became more flexible, by keeping the chart private and offering a public link for sharing.
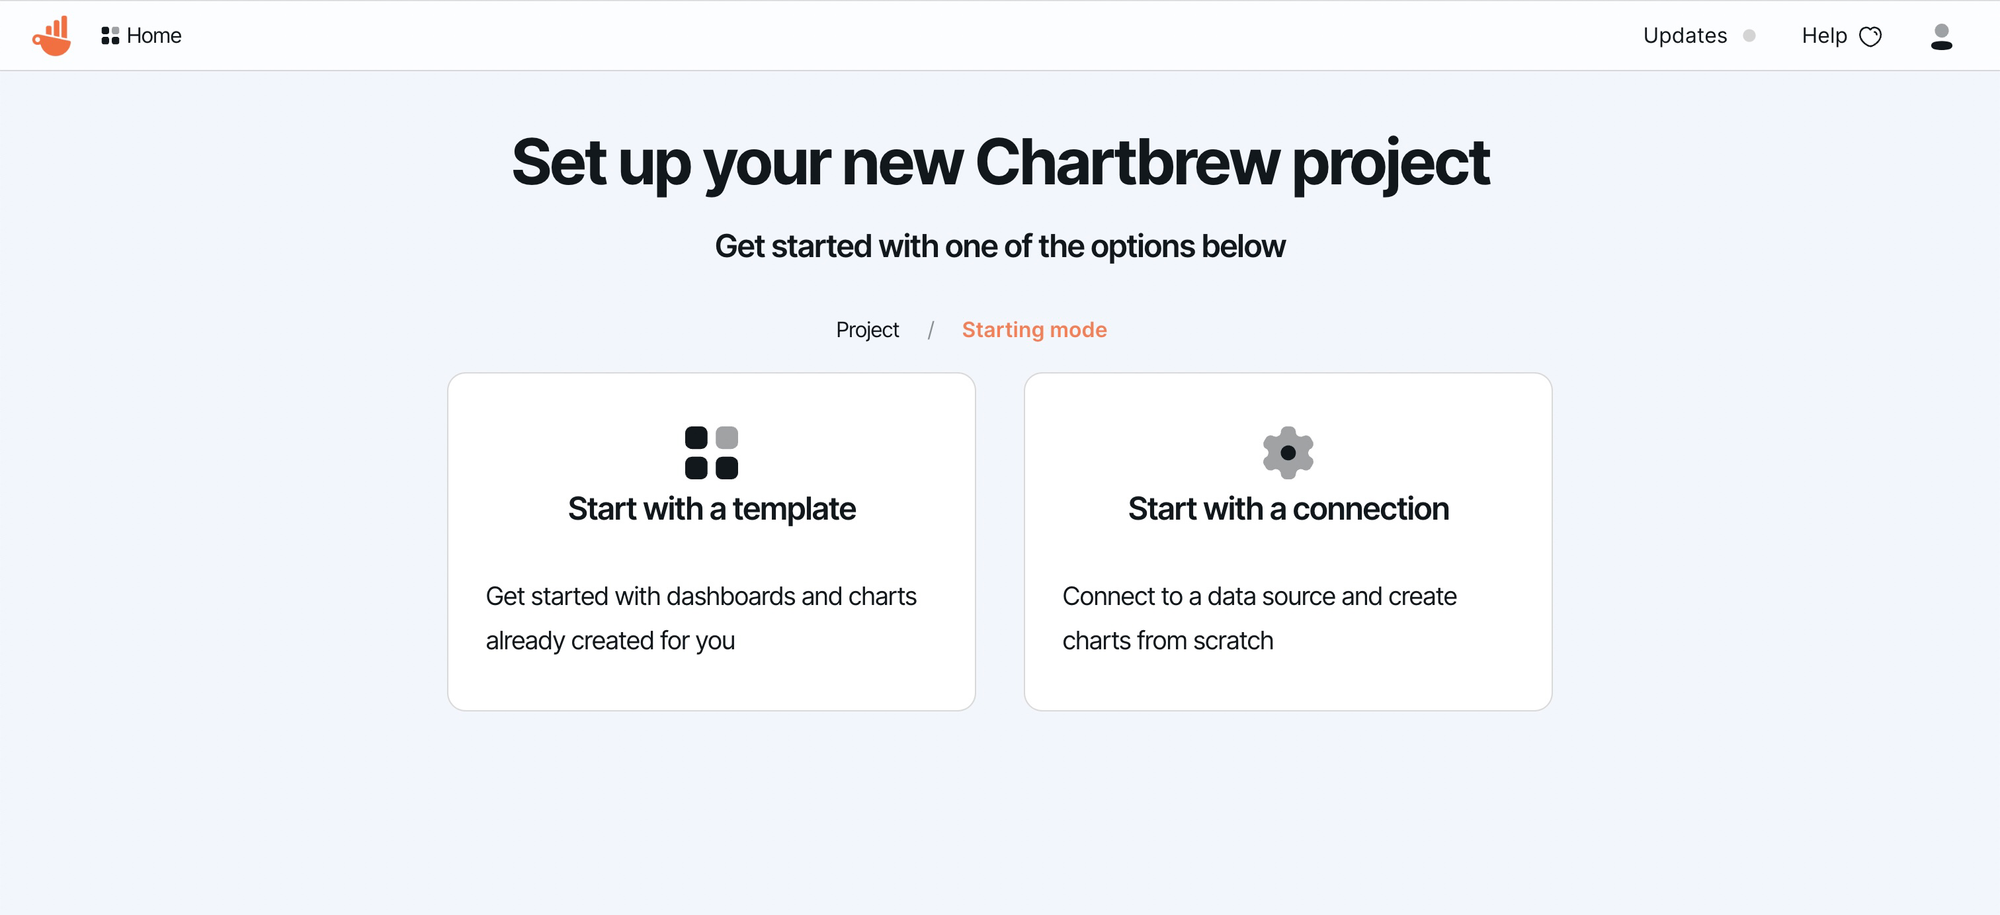
New onboarding sequence
The aim with Chartbrew is to be able to get from signup to a useful dashboard in as less time as possible. The onboarding sequence is meant to help with this. The current implementation goes from creating a project to selecting a starter dashboard template or connection.
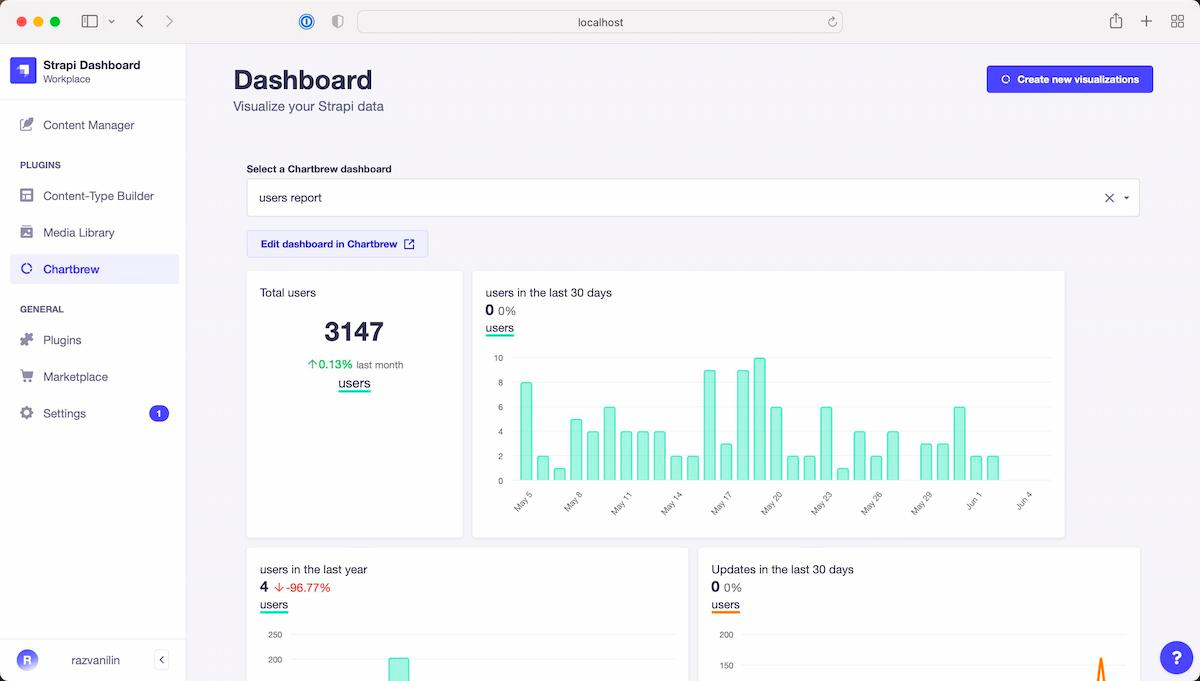
Bring your Chartbrew dashboards to Strapi
A new important update was to add Strapi dashboard templates used within a Strapi plugin. It is now possible to use the official Chartbrew plugin to access your dashboards directly in the Strapi admin view.
Exporting dashboards to Excel spreadsheets
A very powerful feature within Chartbrew is the ability to export chart data in Excel. This can also be useful if you want to export data from your data sources through Chartbrew. There is a more detailed explanation of how this works in this blog post:
Razvan Ilin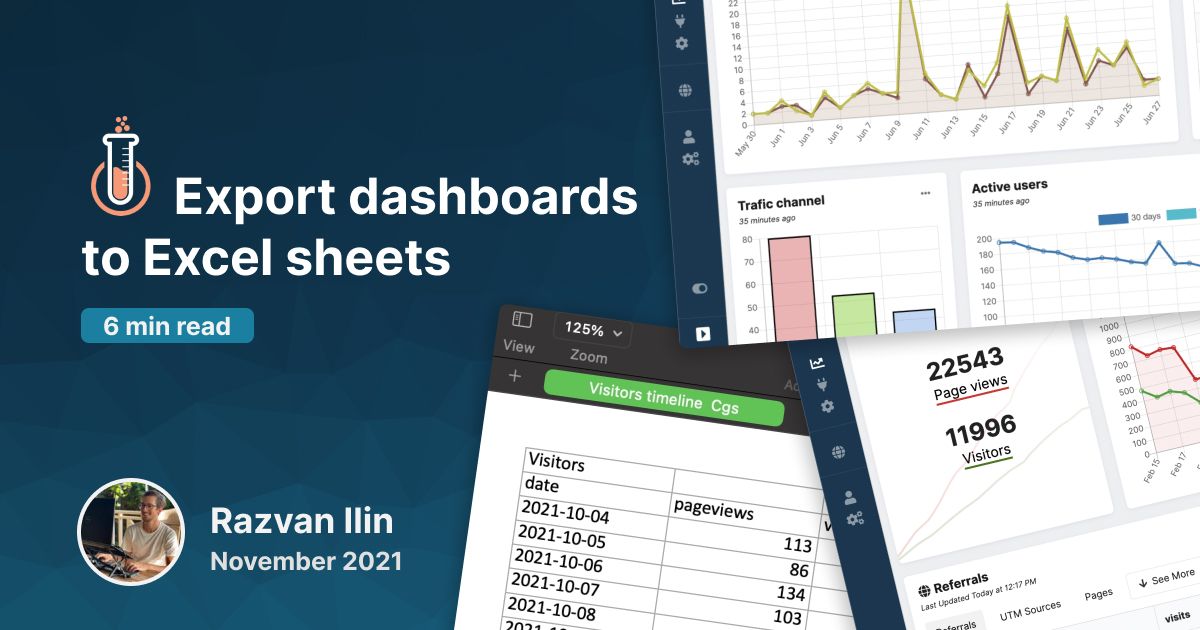
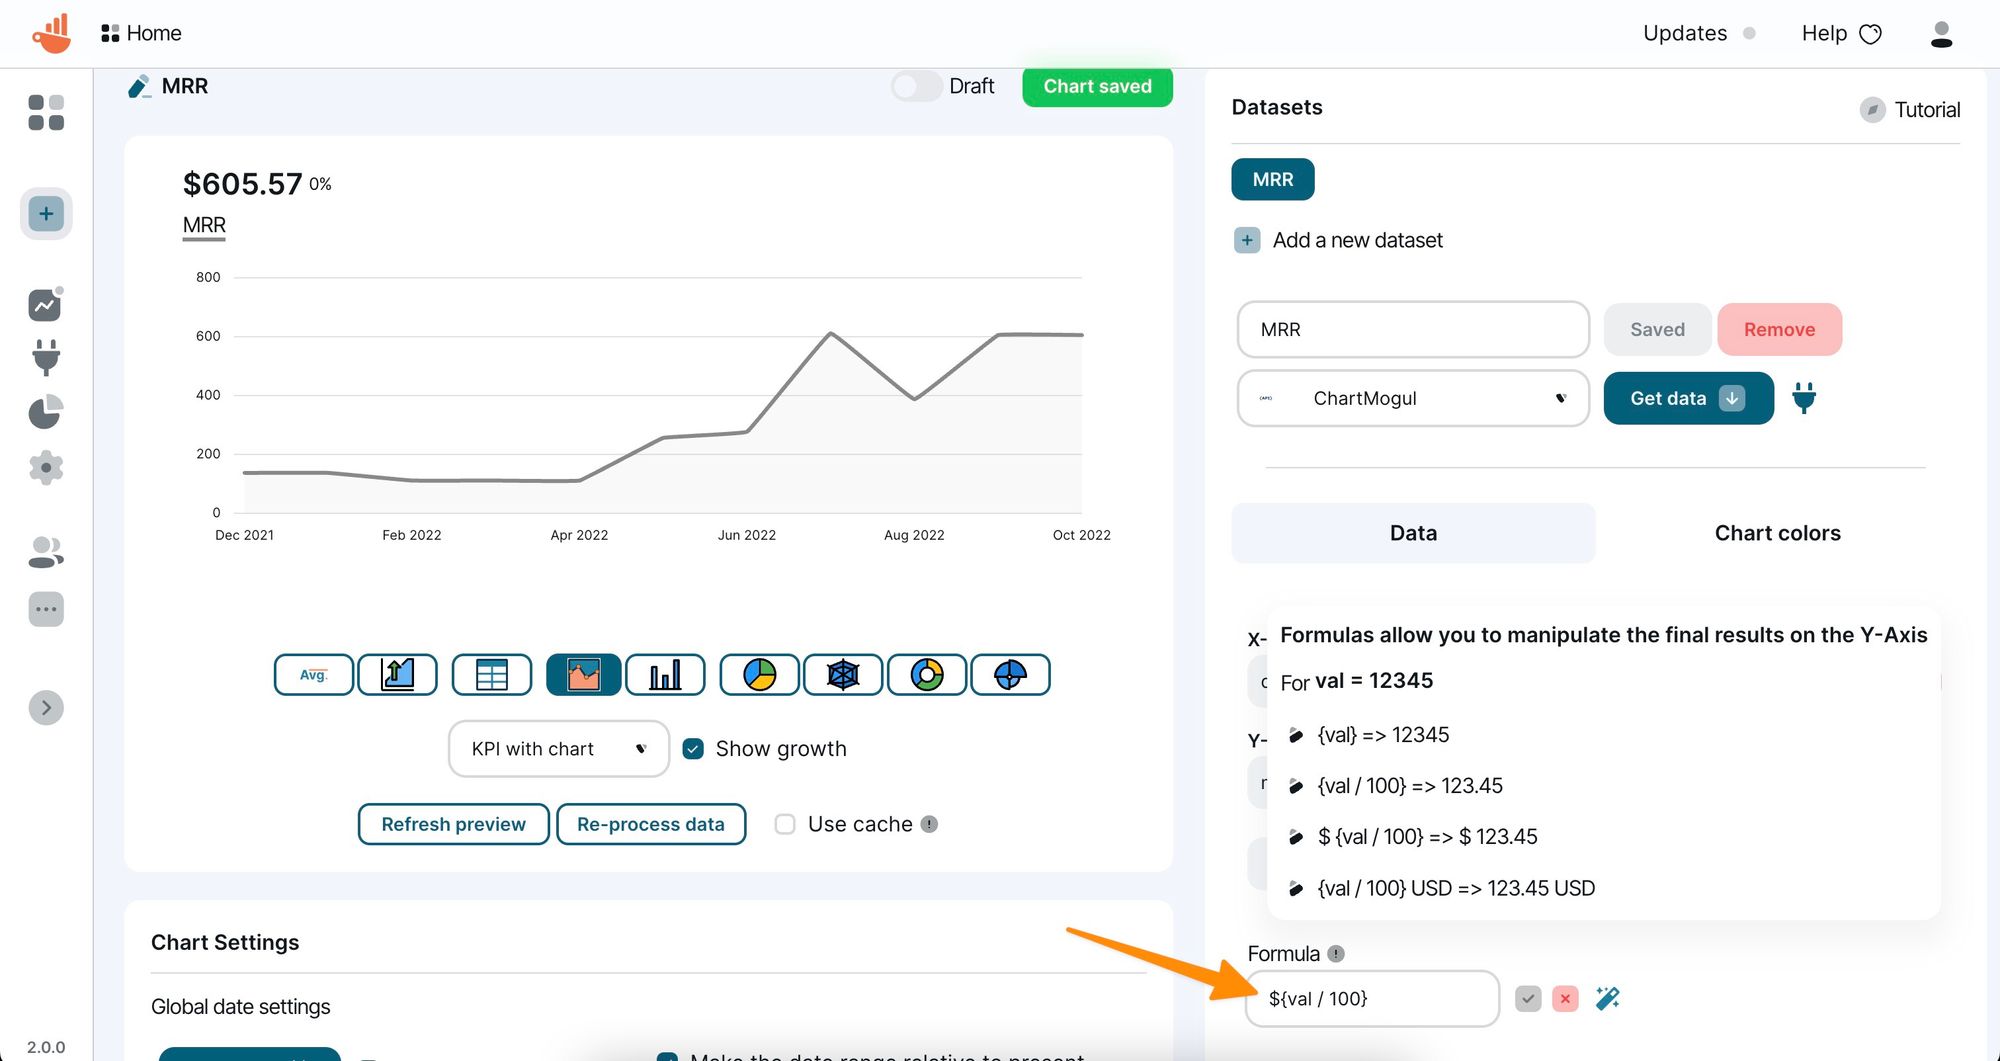
Formulas
The formulas are useful if you want to change the final values on the chart. Some examples are changing cents values to full dollars or adding strings at the start or end of the value.
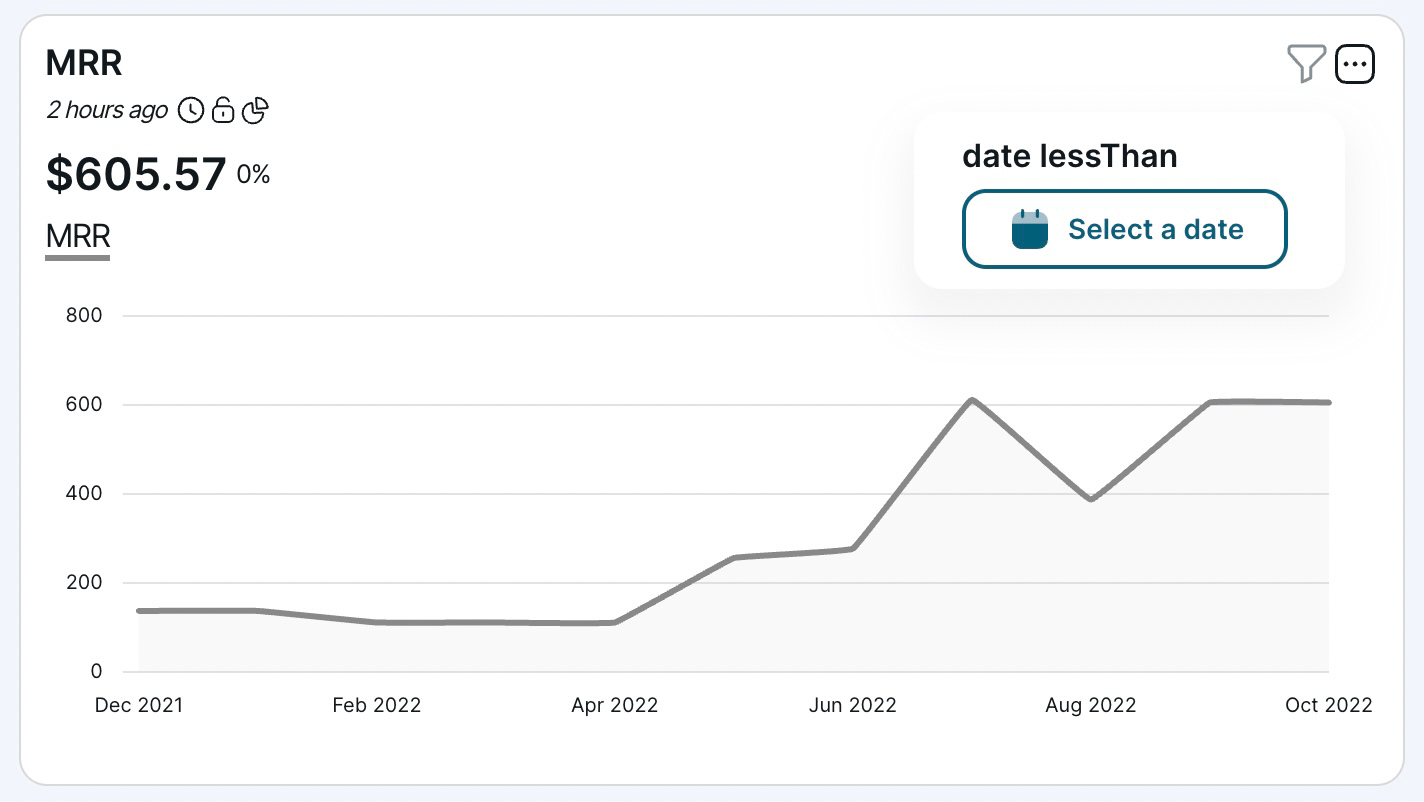
Exposed chart filters for viewers
The filters received an important update to allow viewers to interact with the chart data. The filters have a new option that will expose them and make them appear at the top of your charts. These filters are session-based, which means that if a viewer changes the filter, it will only change the chart data for them.
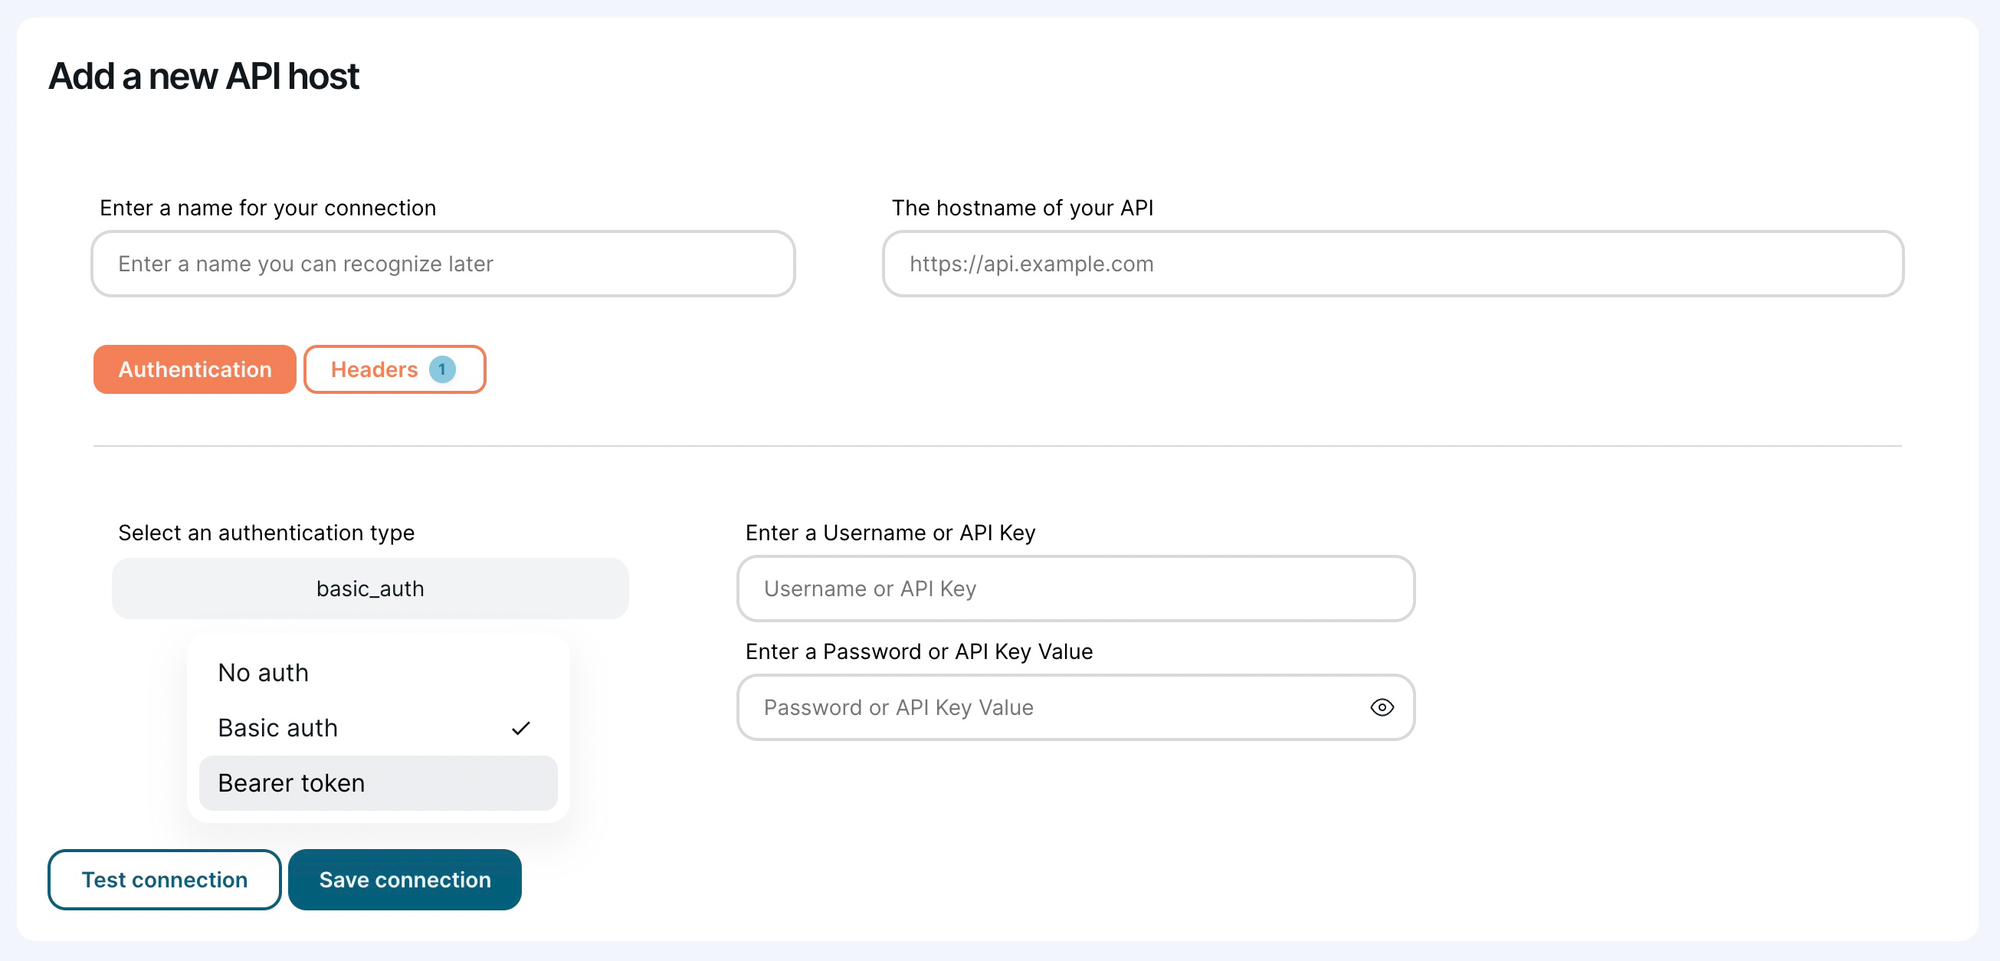
Authentication methods for API connections
When creating a new API connection, you can now specify what kind of authentication is required to access the data. This authentication method will be automatically used every time a request goes to the API. Currently, Chartbrew supports Basic auth and Bearer token.
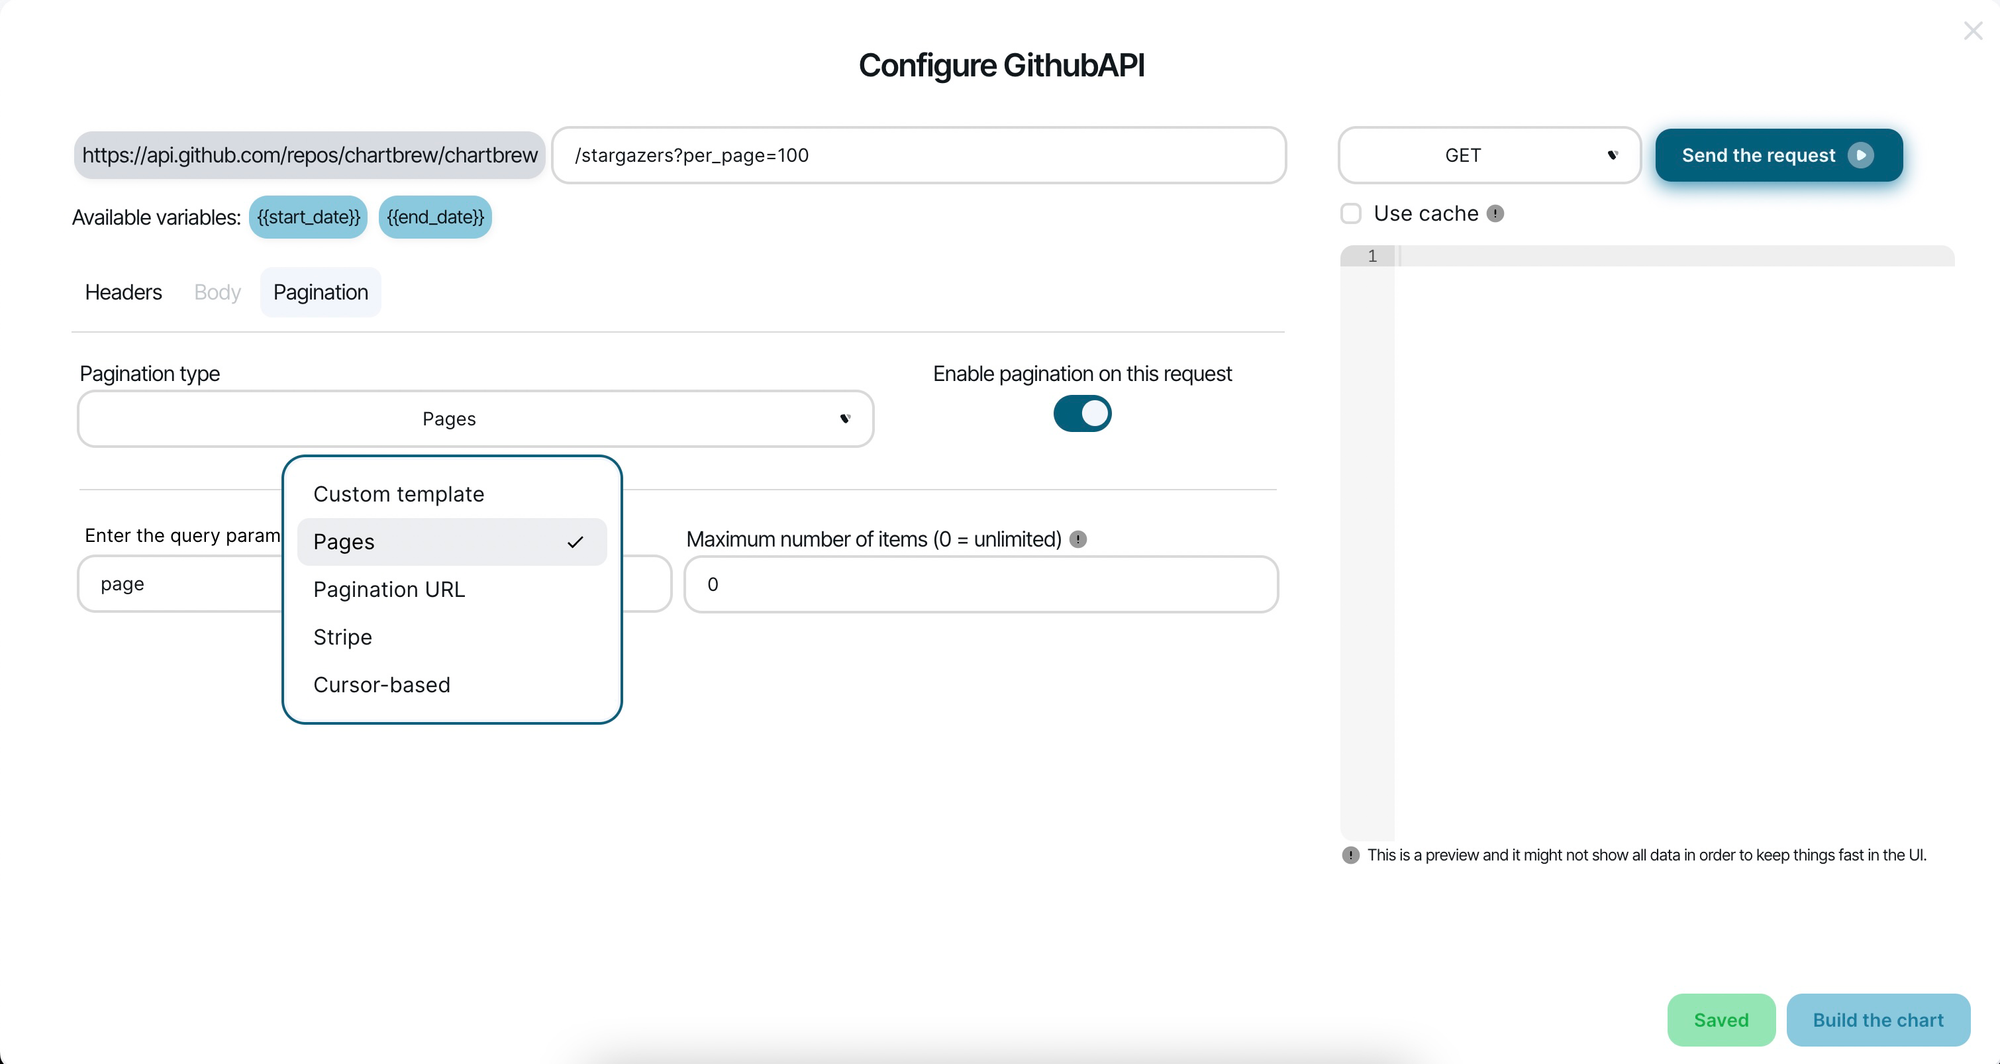
More pagination options for API requests
Most APIs take advantage of pagination features to limit the amount of data that is fetched for each call. Chartbrew can paginate requests automatically, so if you want to get all the data from the API, Chartbrew will paginate these requests for you. There are multiple pagination templates available and this covers most of the API use cases.
Granular project access within a team
The team feature released with v1 was a bit limited in the fact that each user had the same access to all the projects. This feature was enhanced and now the admins can give granular access to the projects to the team members. The invitation method was also changed from email to a sharing link to make it easier to share with teams over chat.
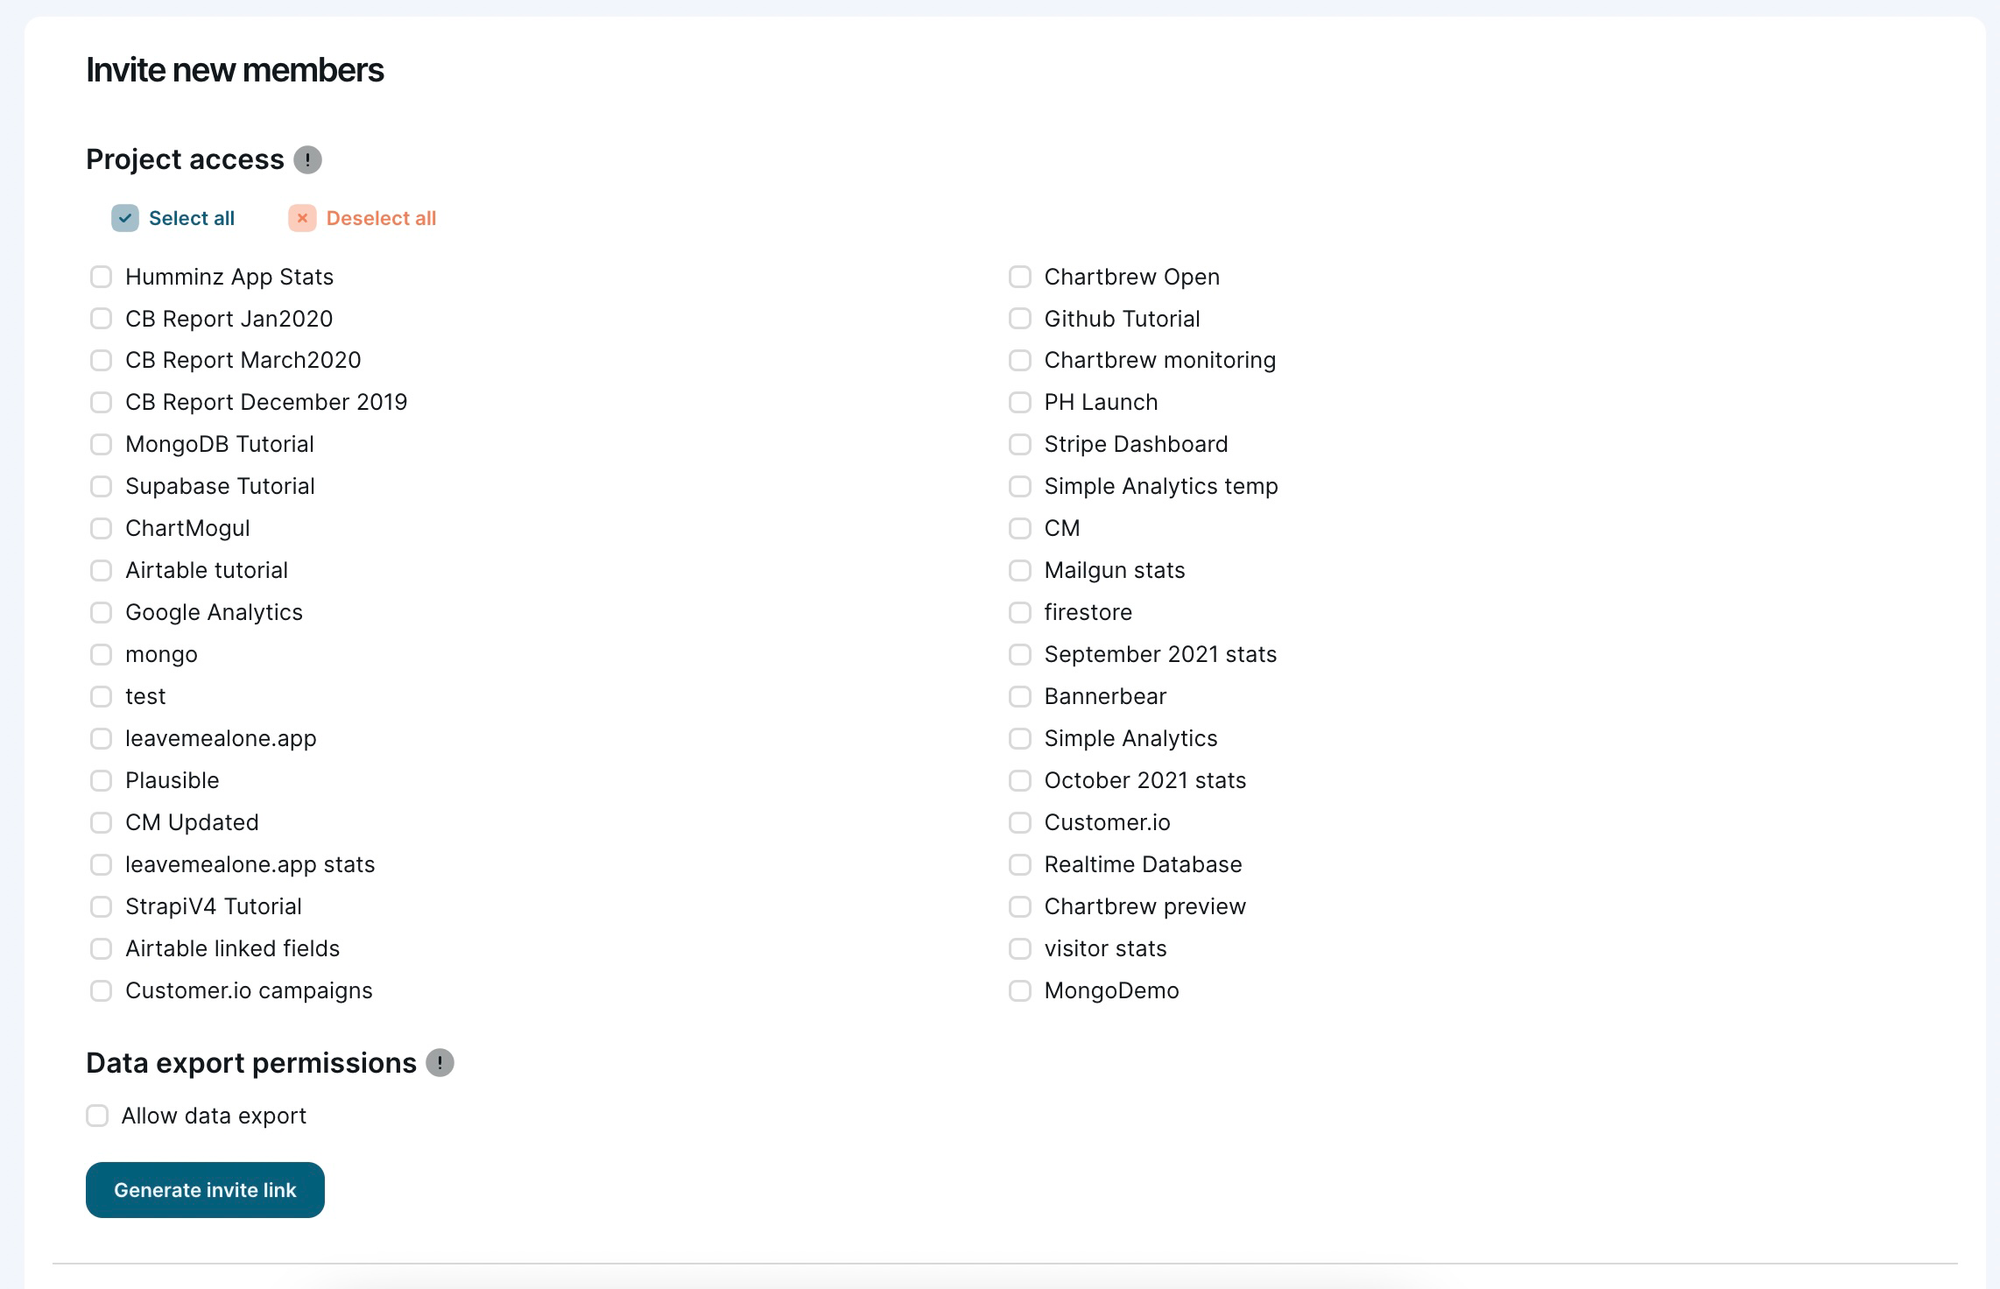
Table views and Polar, Radar, and doughnut charts
Surprisingly enough, v1 did not launch with all these visualization types. The star of the show is the table view, which is used quite extensively by Chartbrew users. The Table view comes with extra options such as the ordering of columns, pagination, and grouping.
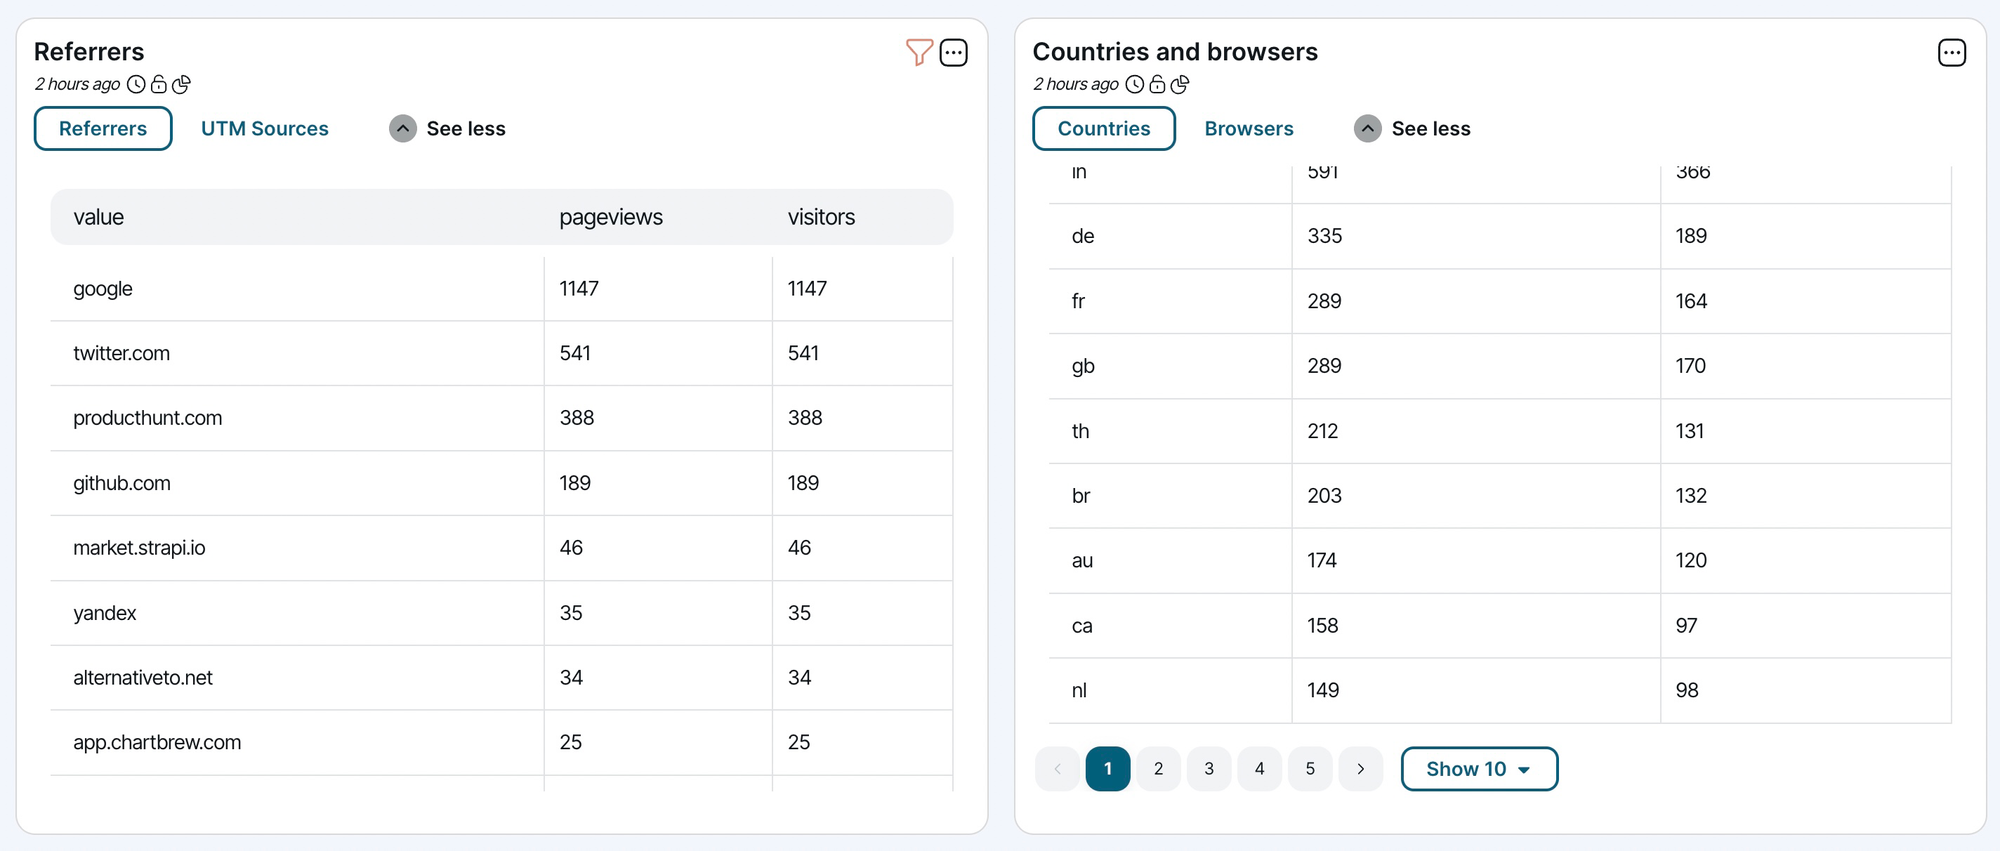
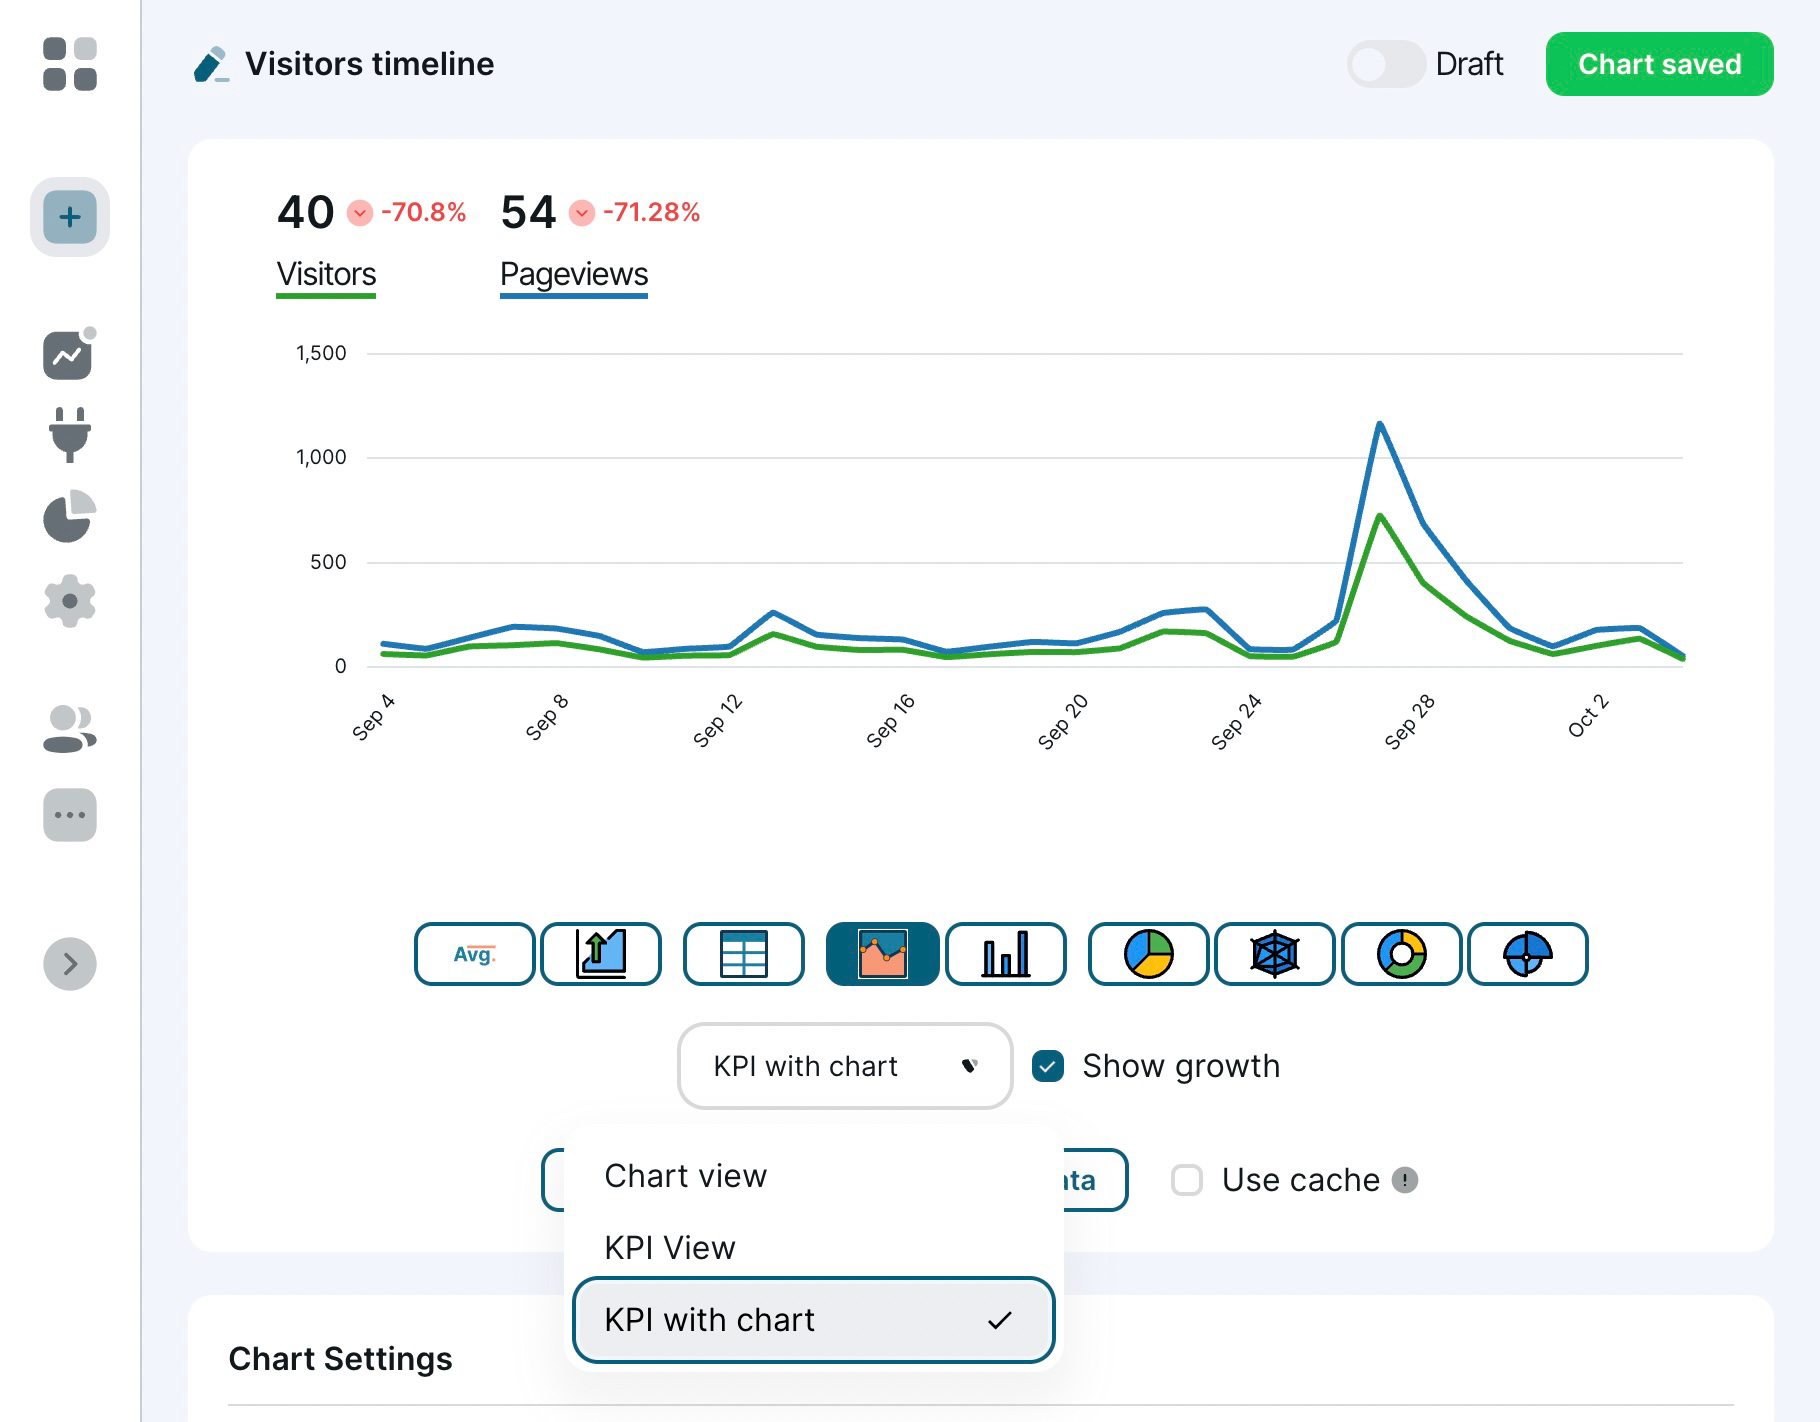
Chart + KPI view and growth calculation
A more recent update allows for an easy view of the growth state of a certain dataset. This adds to the other views available in Chartbrew and now there are 3 options:
- Chart view
- KPI view
- Chart + KPI view
Official Docker images for self-hosting
With the help of others from the open source community, there is an official Docker image for Chartbrew that others can use to quickly get the project up and running on their servers. Check it out below:
There are lots of other updates not mentioned here, but the blog post will become too long!
Next plans
The plan doesn't go far into the future as things change too fast and focus can change without prior notice. I like to keep things flexible and iterate along the way. That said, there are some major updates on the whiteboard that will be addressed in the near future.
Datasets
- Reorder datasets
- Join datasets on custom fields
- Objectify datasets - re-use them to quickly generate new charts
Filters
- Assign variables to each filter to use when making data requests
- Name filters (useful for public ones)
- Change the design of public filters to appear more like widgets on the charts
Official Airtable integration
Currently, Airtable lacks an easy way to visualize data and more and more users turn to Chartbrew for help. It will be even easier for these users to take advantage of seamless integration between Airtable and Chartbrew. The new integration will be available in Chartbrew soon.
Formulas
More formulas will be added to Chartbrew as in the current state the feature is a bit limiting.
Add support for GA4
Universal Analytics properties are already usable within Chartbrew, but the new properties are not usable. The integration will need to be updated to work with these.
Tables
- Make tables smarter to identify data types
- Editable format (dates, currency, numbers)
2FA
Due to the sensitivity of the data within a Chartbrew team, 2-Factor Authentication will be made available soon.
Chartbrew as a business
Chartbrew is an open-source project, but it also works as a business. While working on the next versions of the platform, the business aspect will be taken into account as well. Chartbrew is 100% bootstrapped and at the moment of writing, it's making $600 in monthly recurring revenue. This is not fully sustainable yet, but things are moving in the right direction.
The current business plan of offering managed service access as a paid version will remain the main revenue stream and nothing is planned to change in the near future.
The business stats are available here as always:

Onwards to v3!
