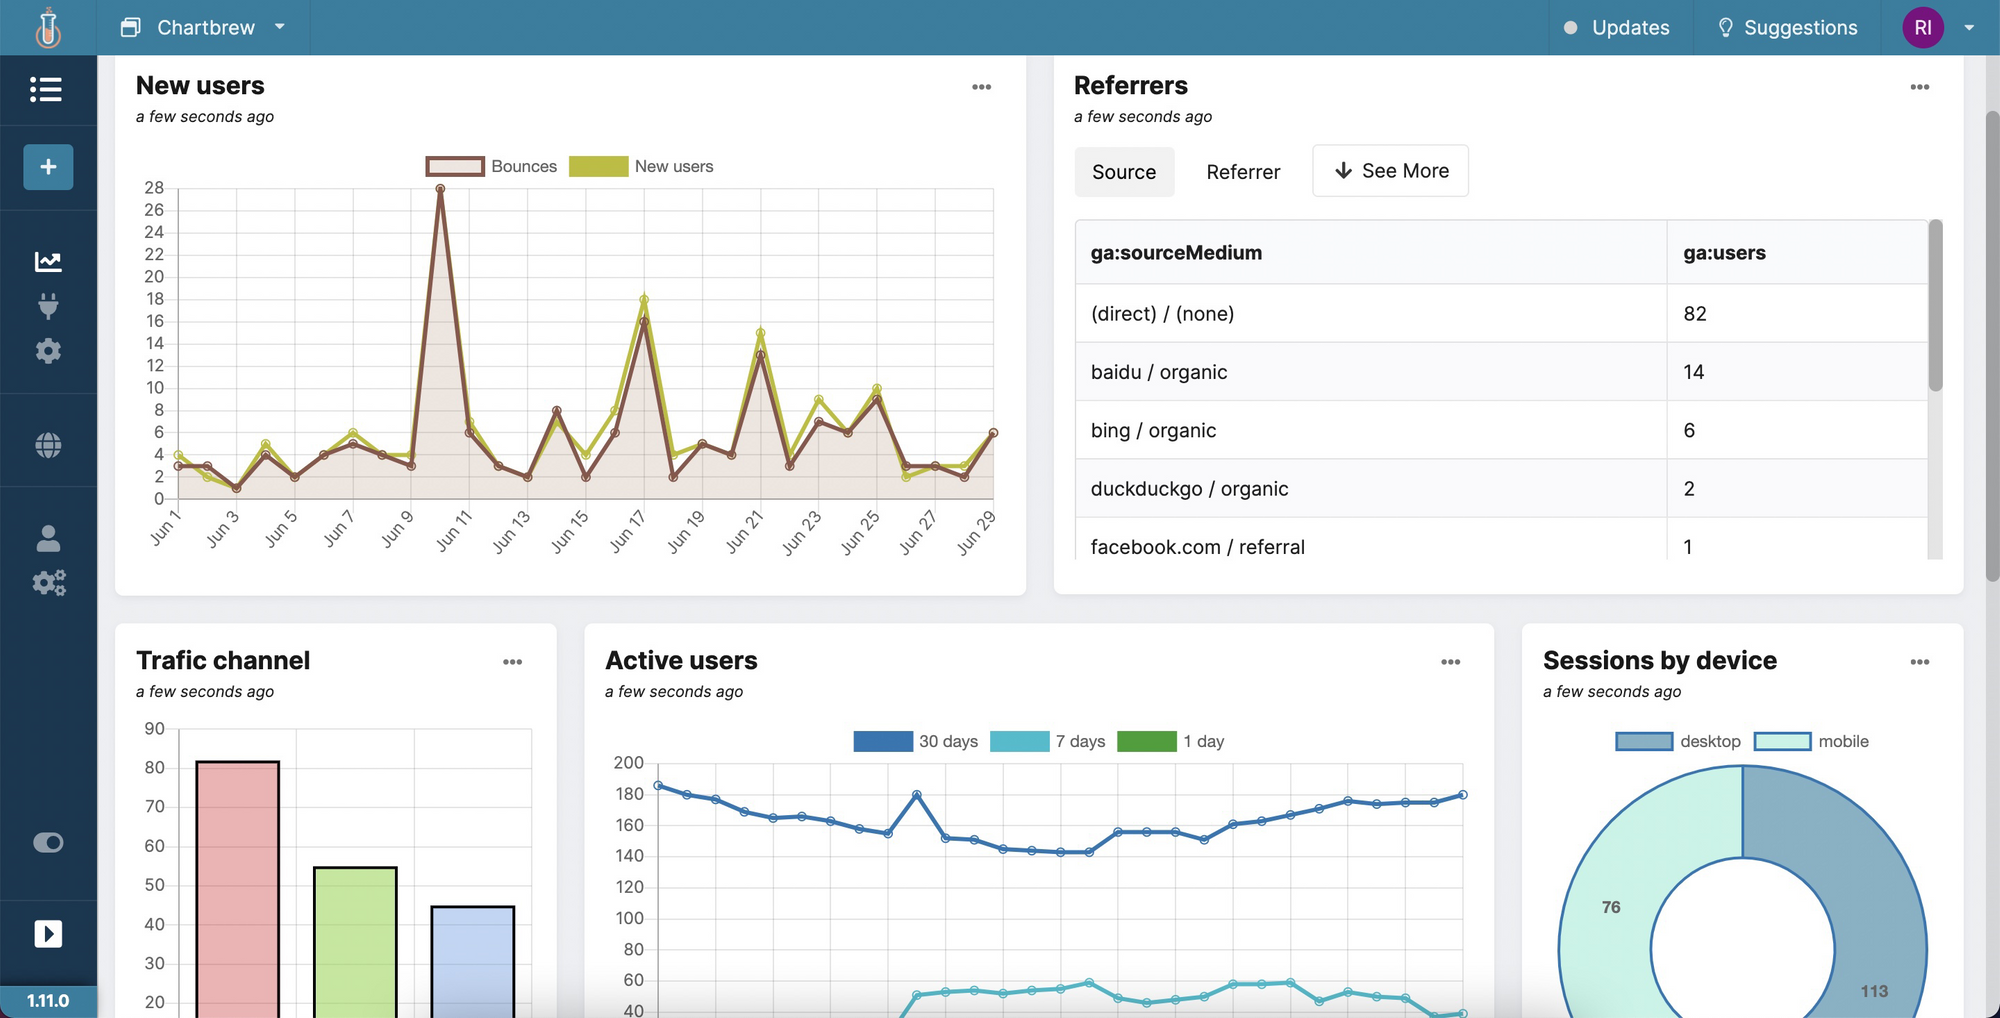
Create your Google Analytics dashboard in Chartbrew
In this tutorial, we are going to connect to a Google Analytics account to track users' session data in Chartbrew. This can be achieved by using a template with pre-made charts, or by creating custom charts from all the metrics and dimensions available in Google Analytics.
Prepare your Chartbrew project
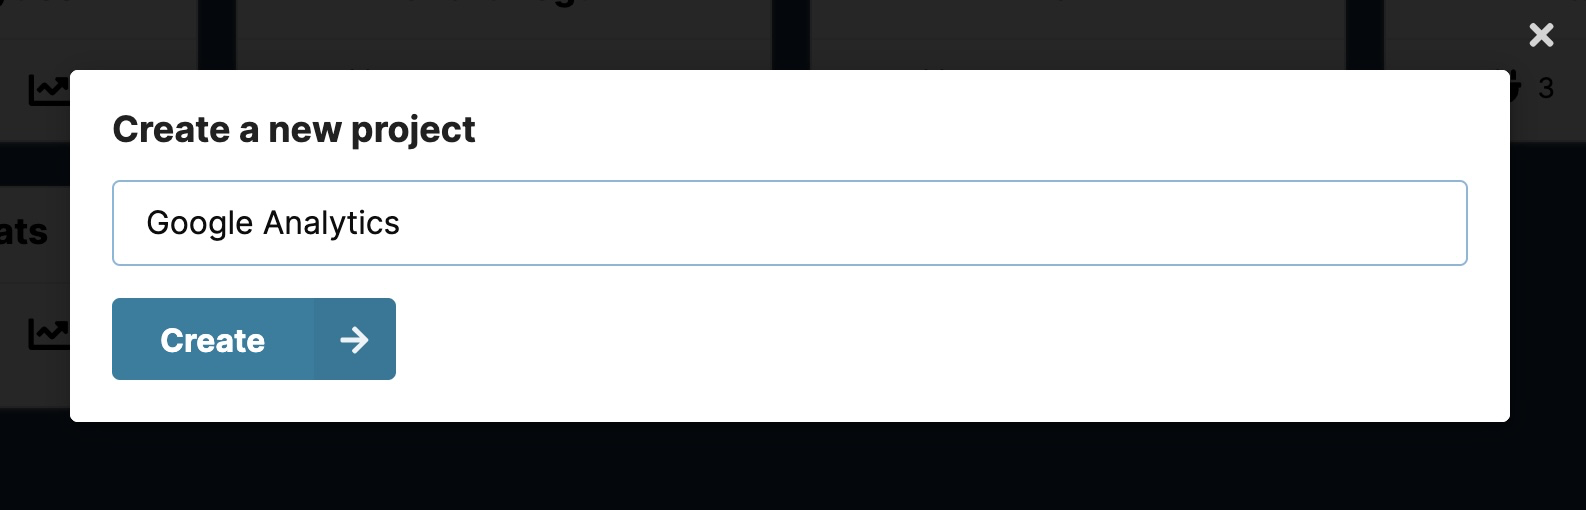
If you don't already have a Chartbrew account, you can head over to chartbrew.com/signup to set one up for free. Head over to your dashboard and create a new project or use an existing one:
First, let's go over how to create charts from the Google Analytics template as it is the easiest way to get started.
Using the Google Analytics template
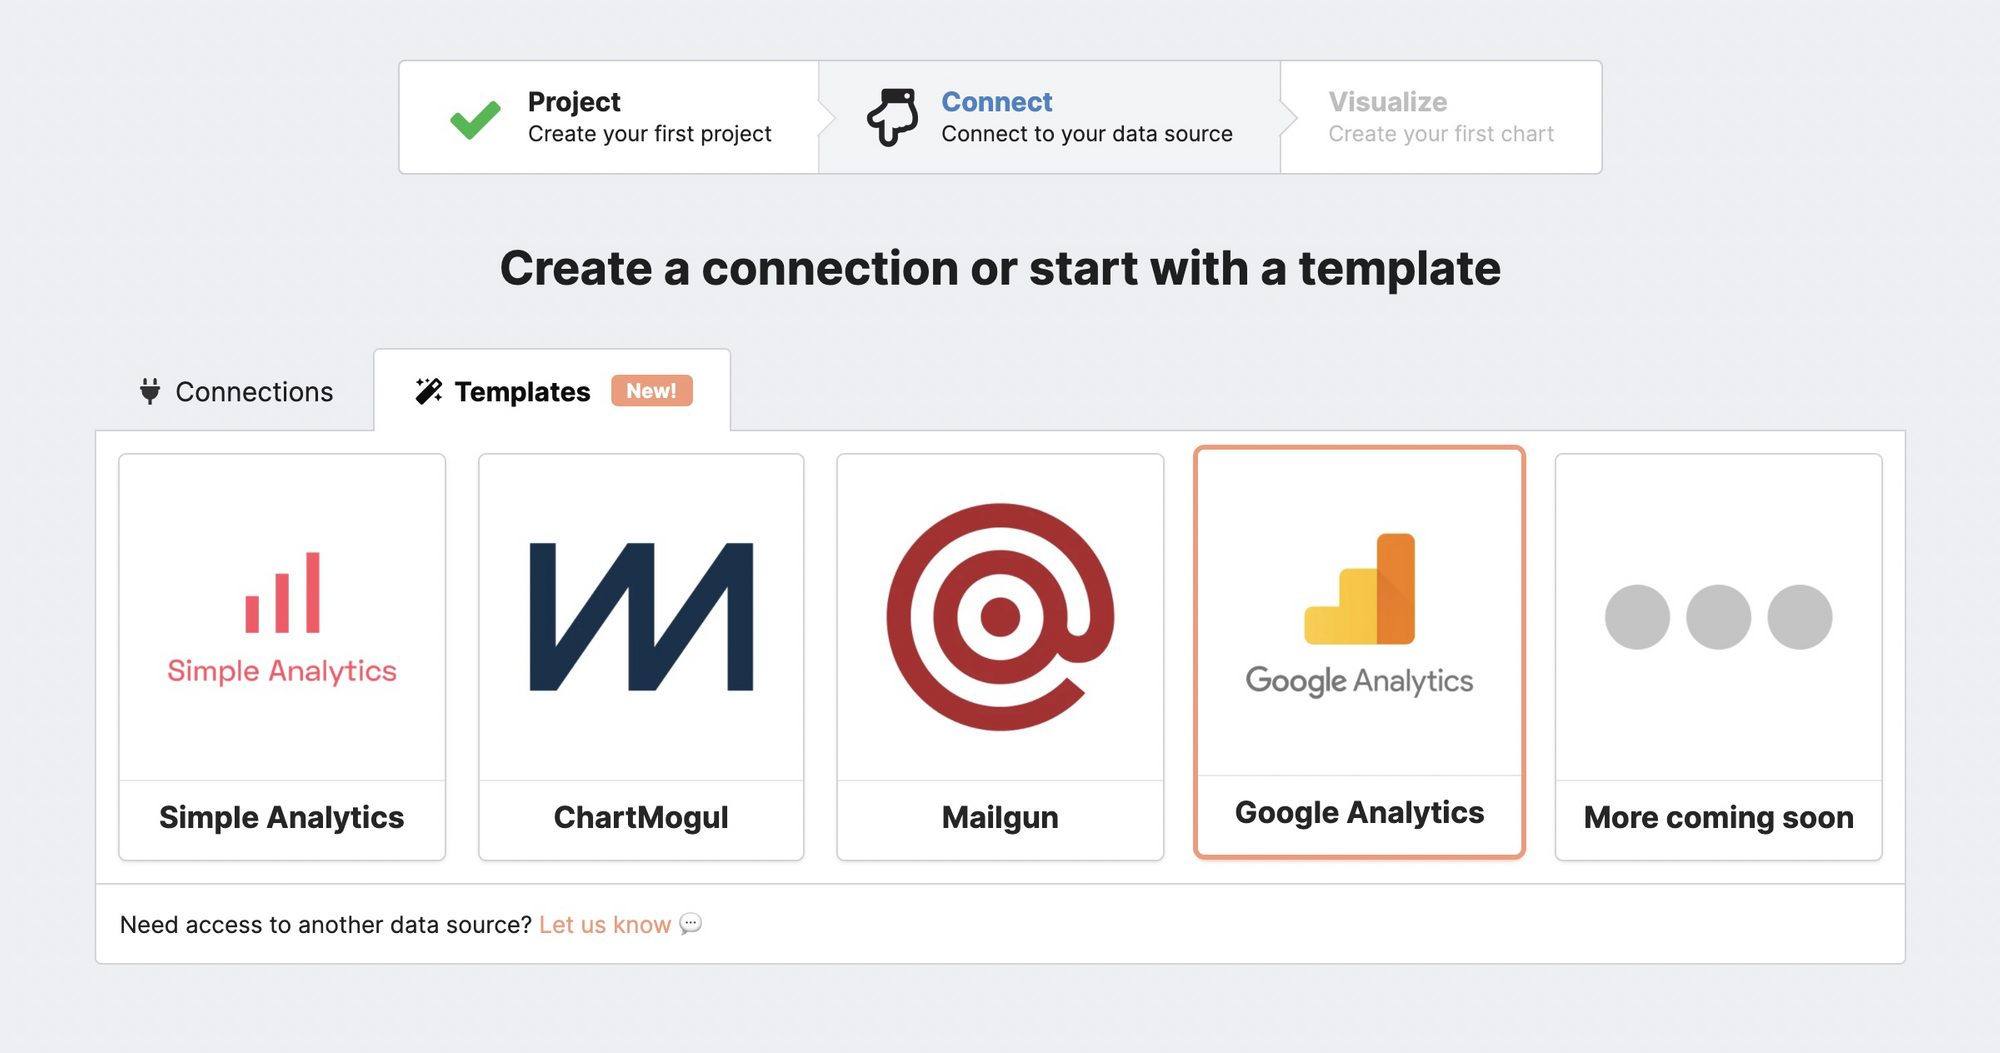
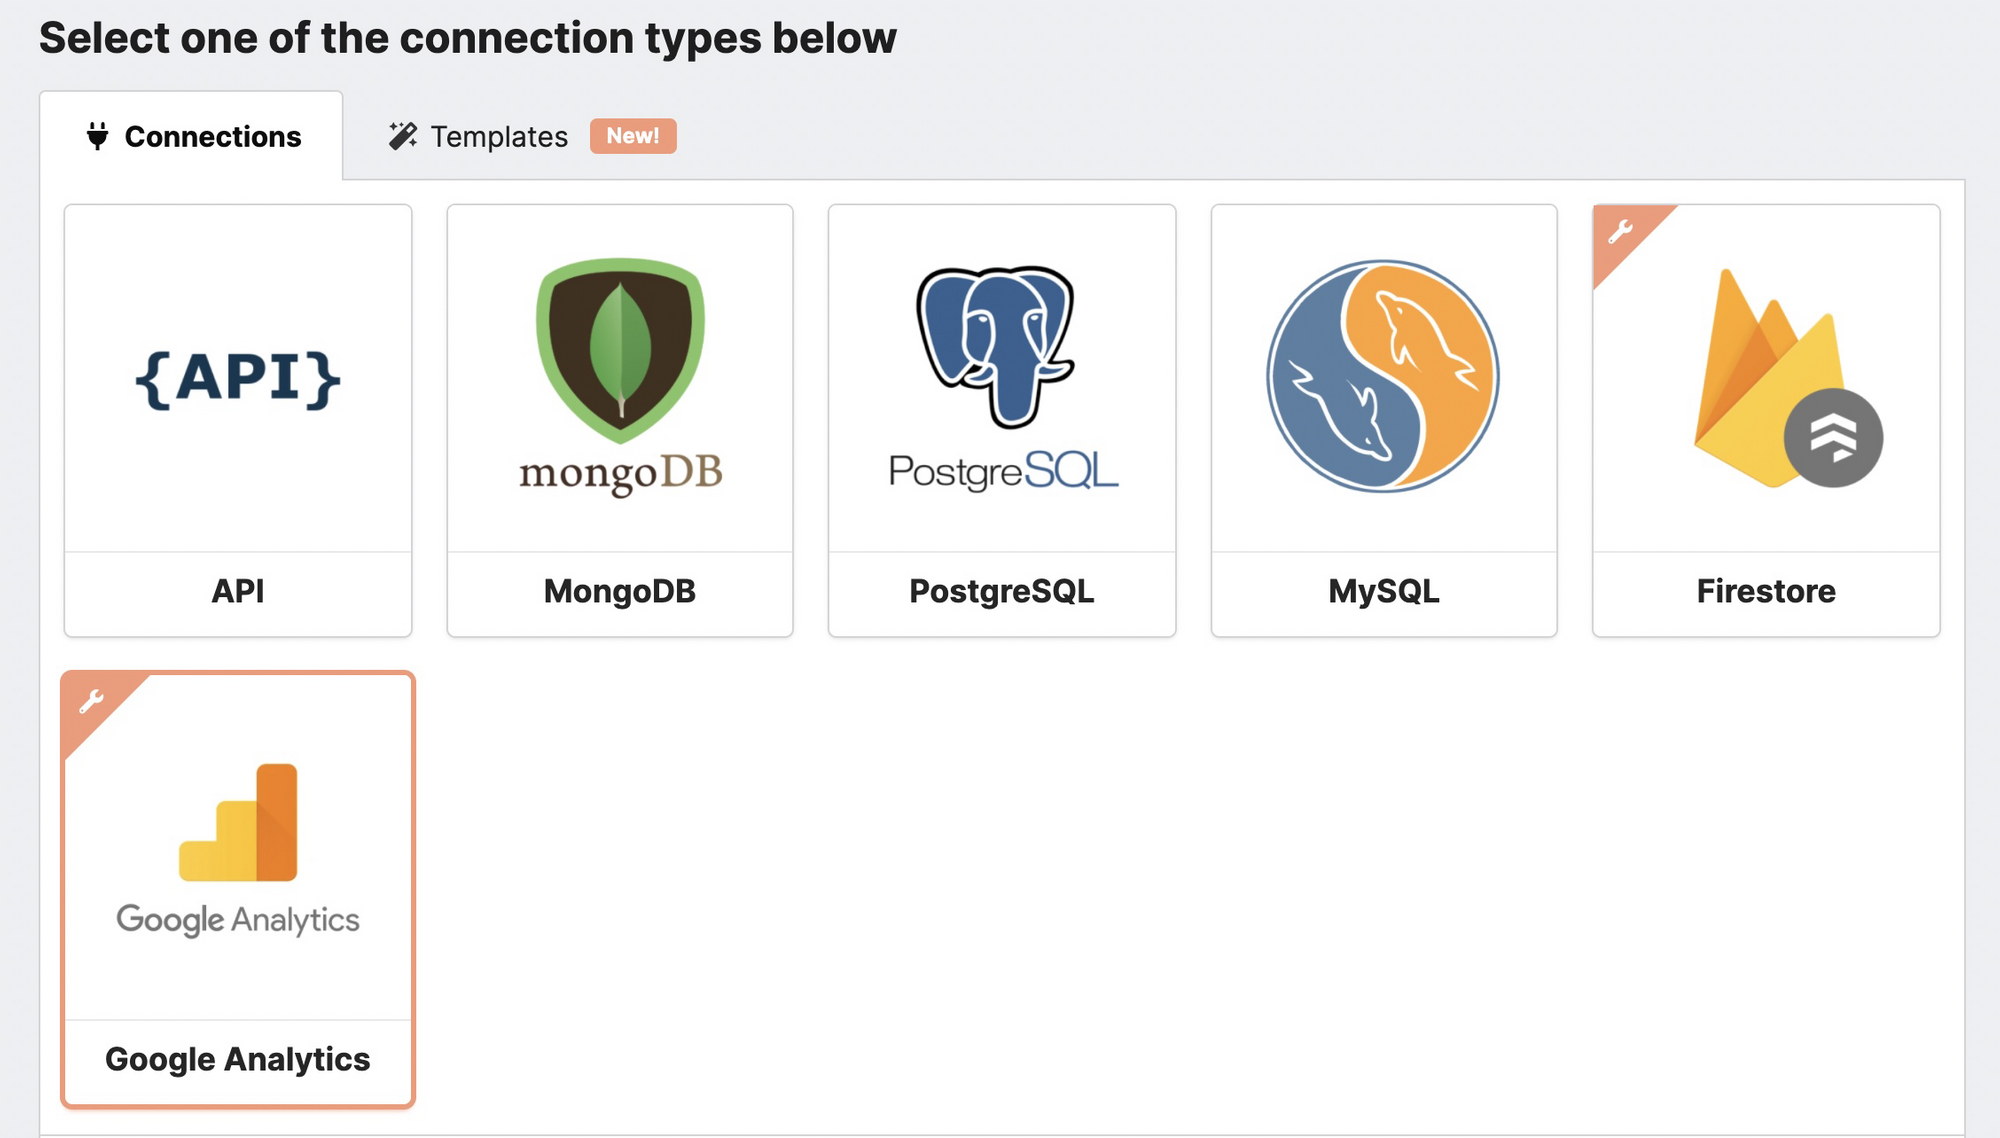
After creating a new project, you will be redirected to the Connections screen. Select the templates section and then click on the Google Analytics card from the list.
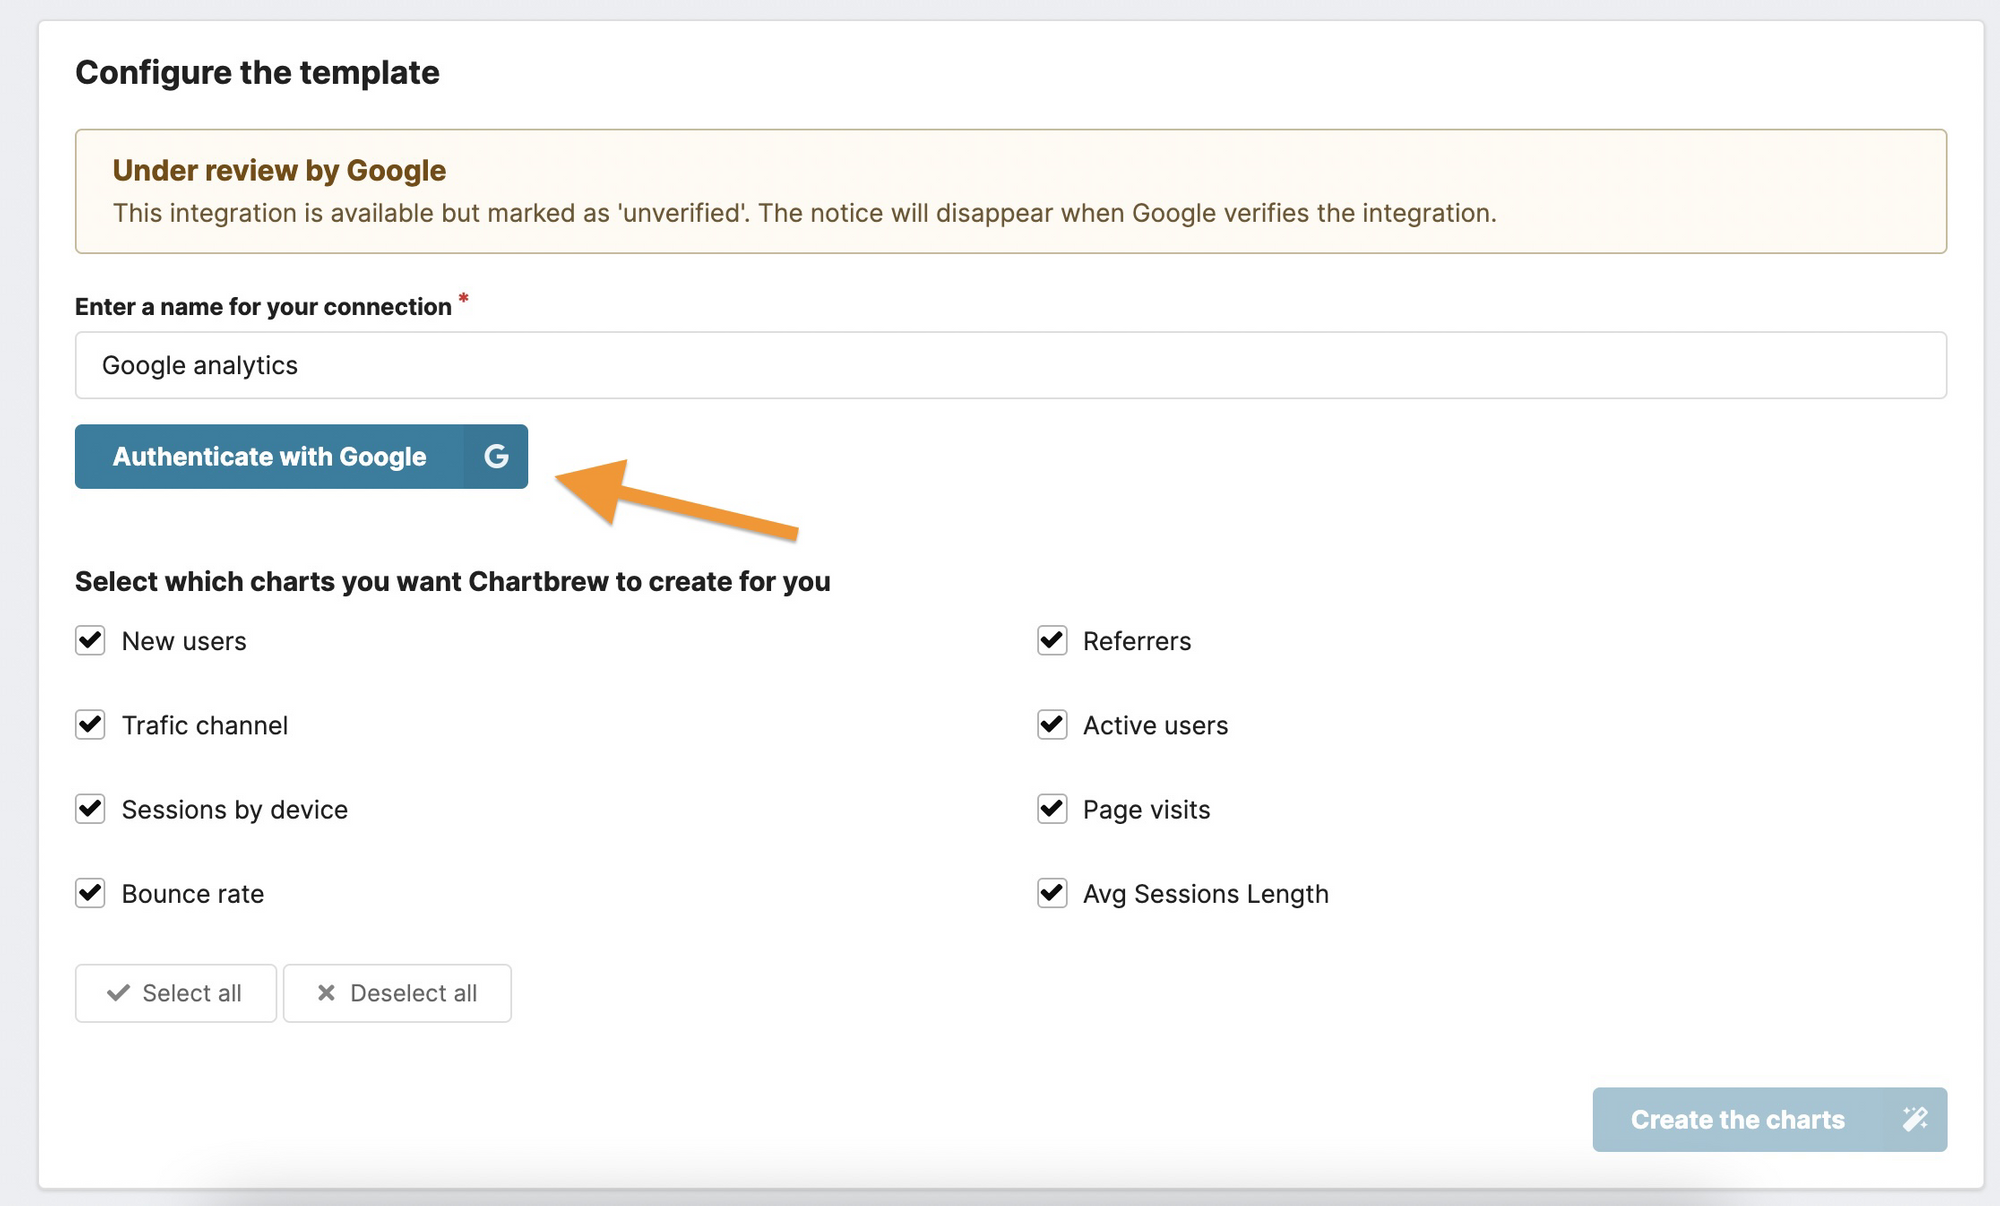
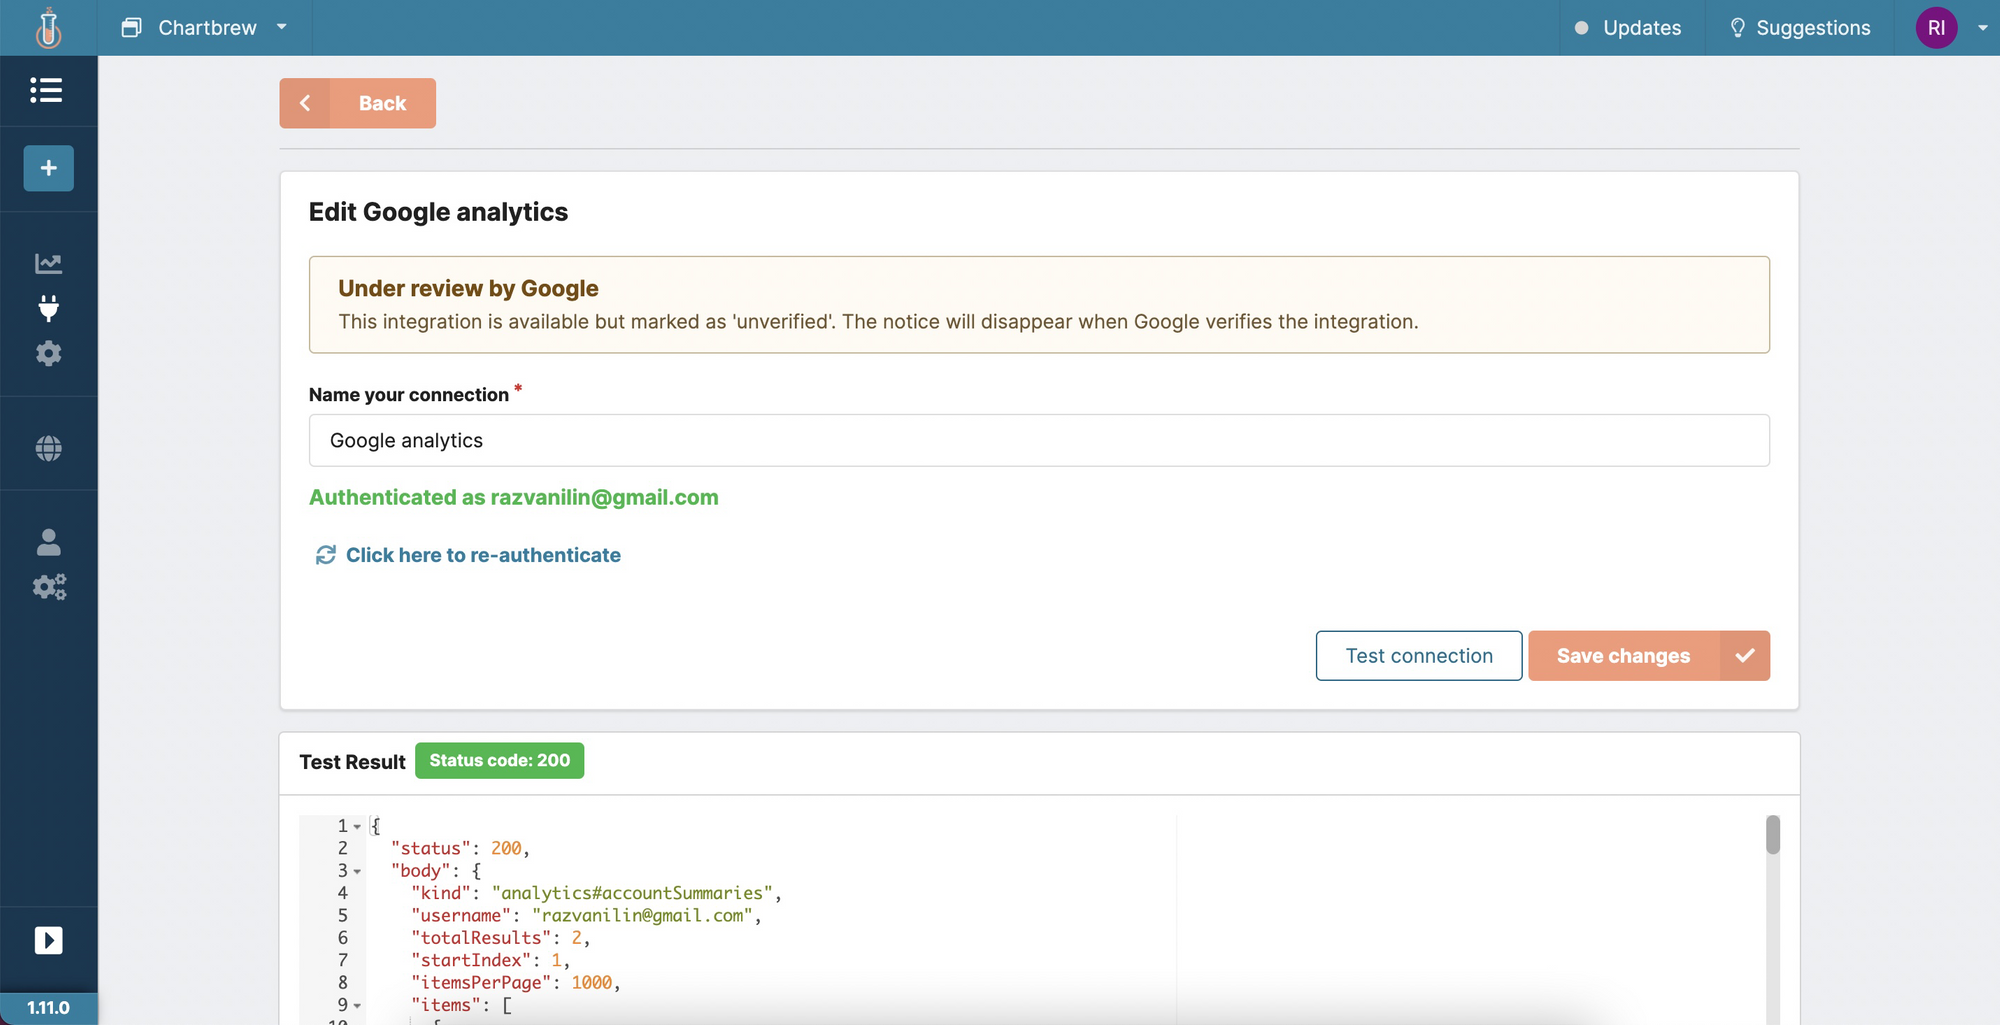
On the next page, enter a name for your connection so you can identify it later. It is helpful to enter a distinct name if you are planning on connecting different Google accounts to the same dashboard. When you are ready, press the Authentication button to allow Chartbrew to read your Google Analytics data.
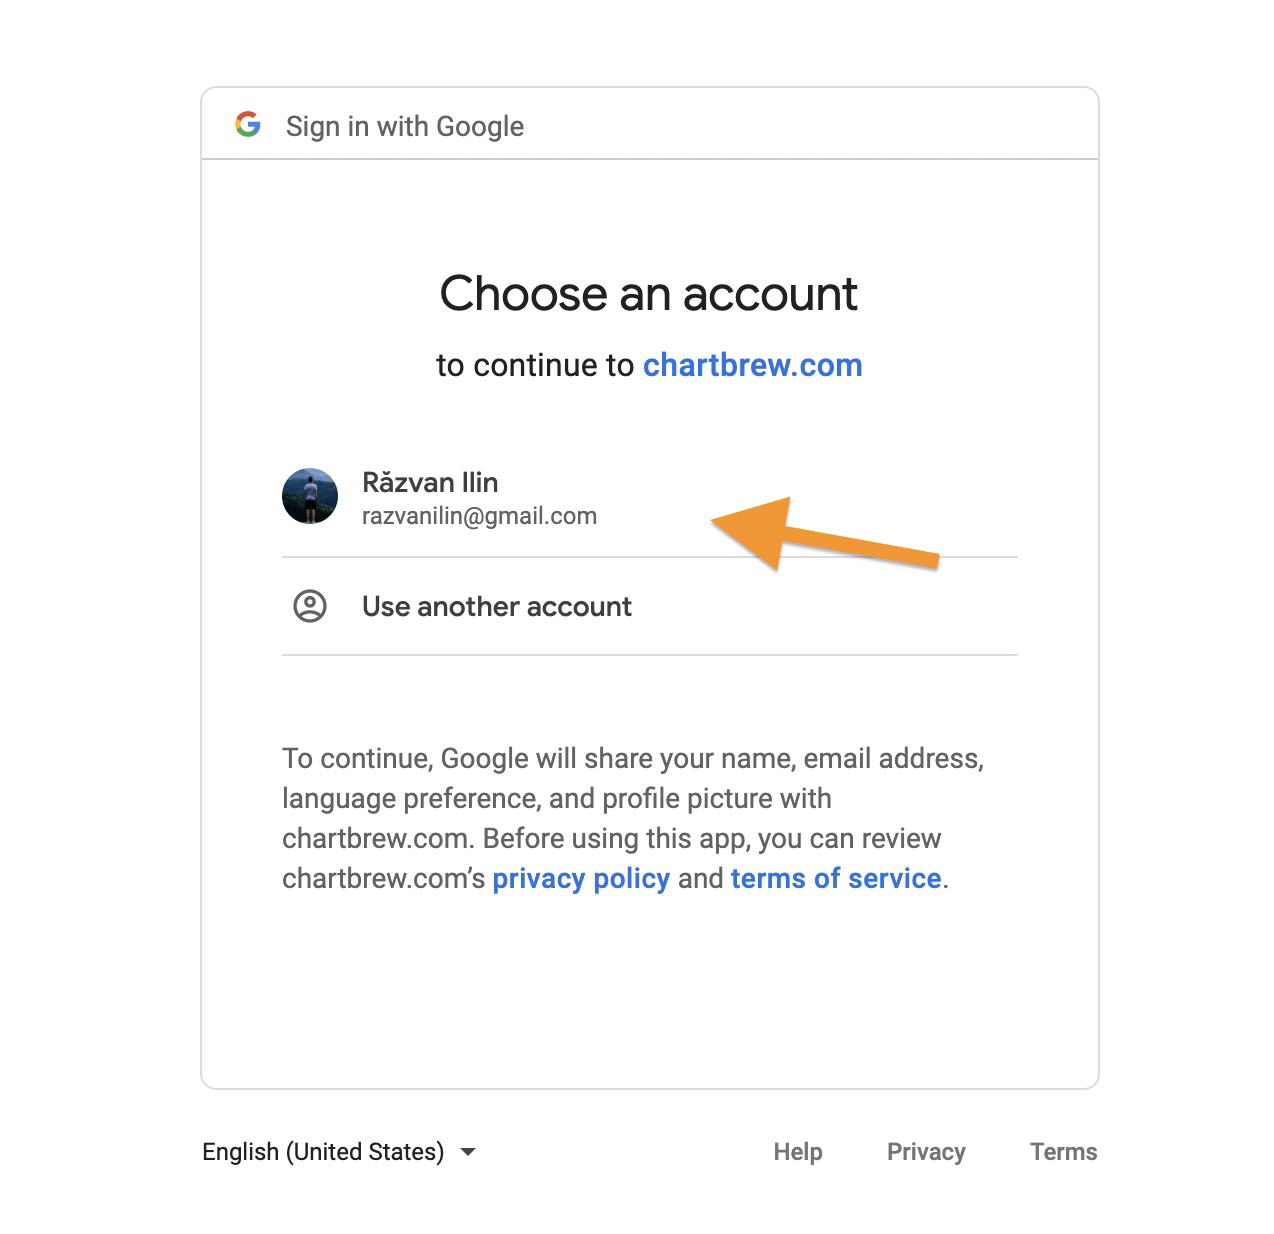
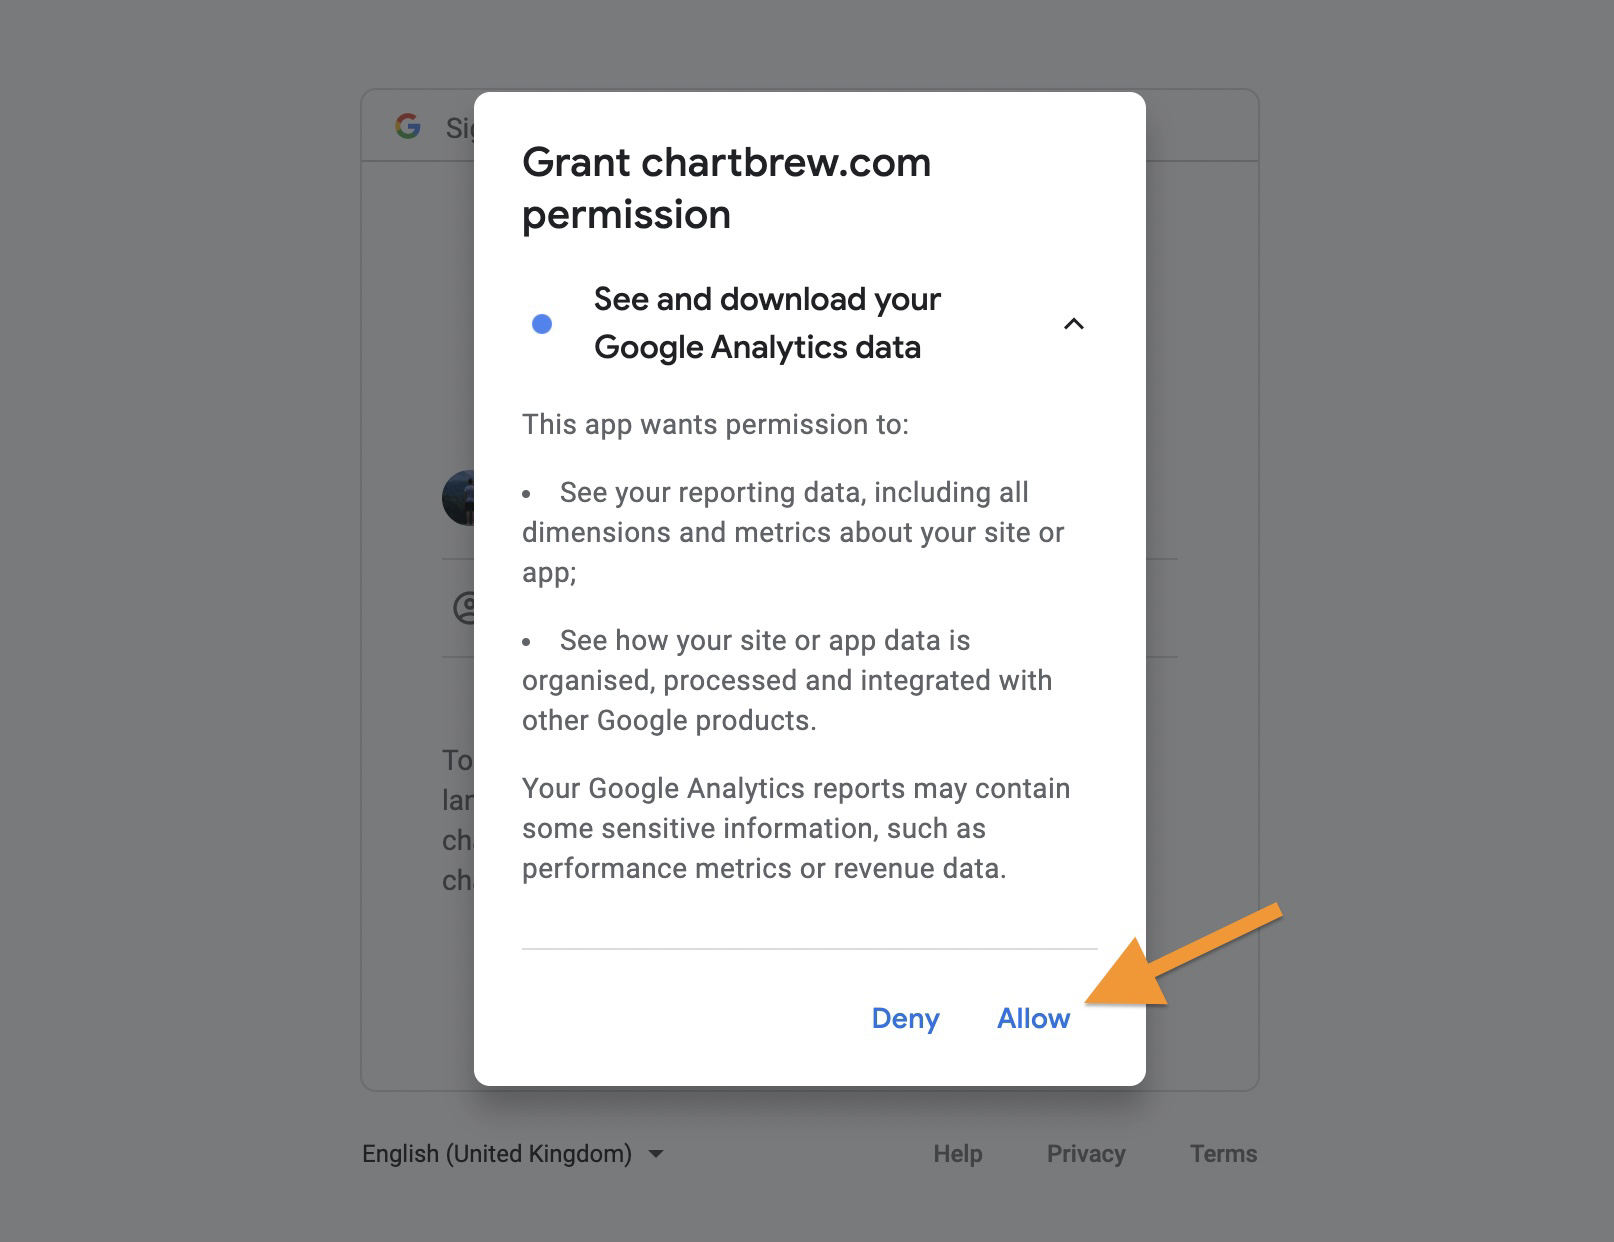
Authenticate with Google
The authentication process will start now. The next screenshots will quickly walk you through the process:
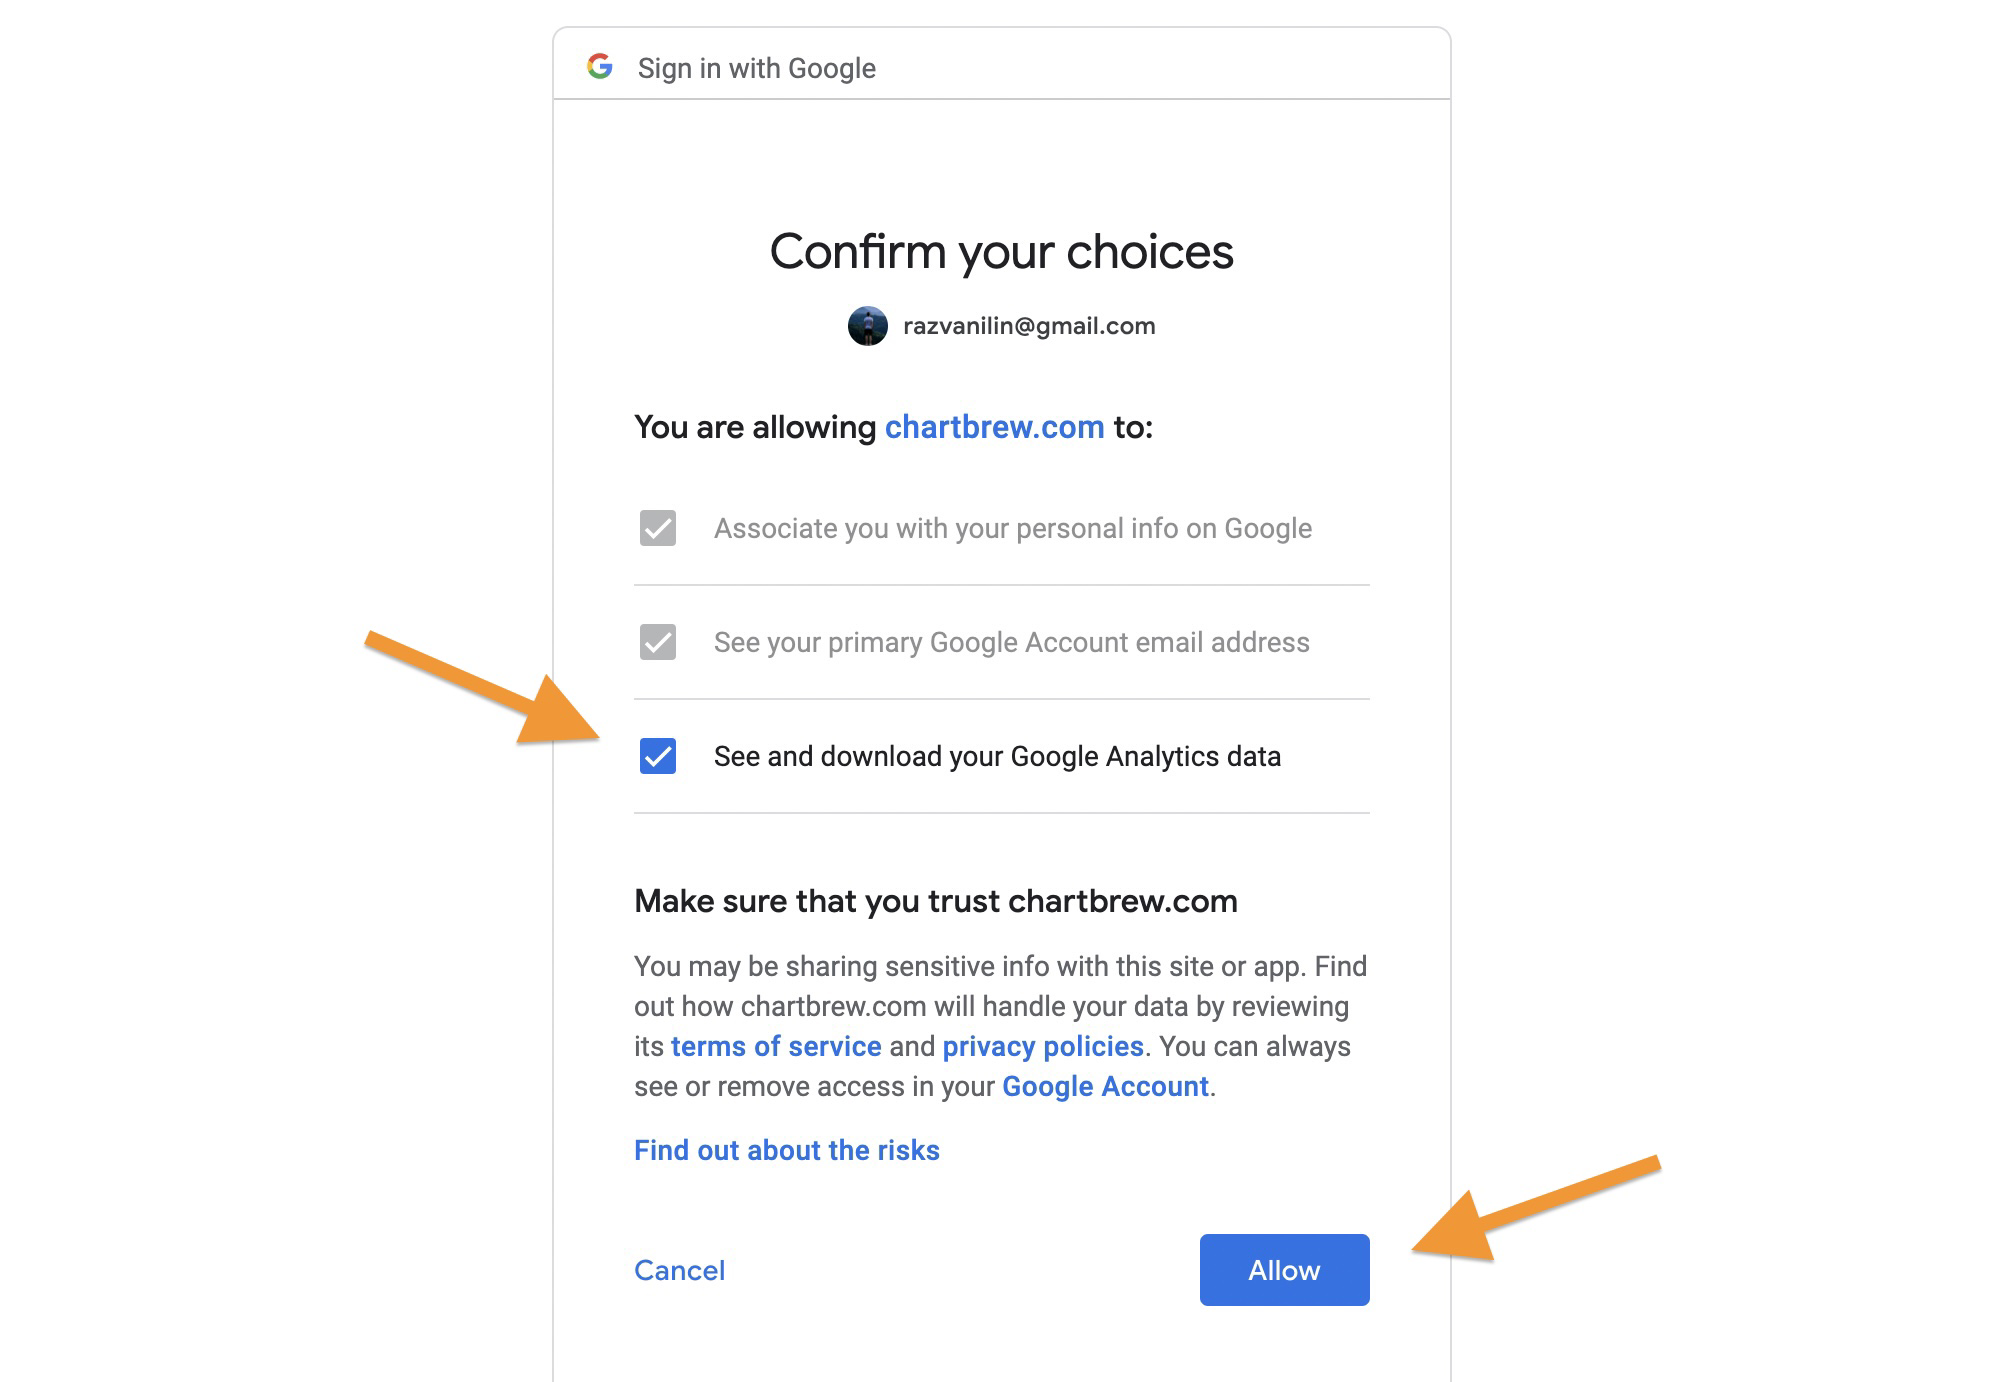
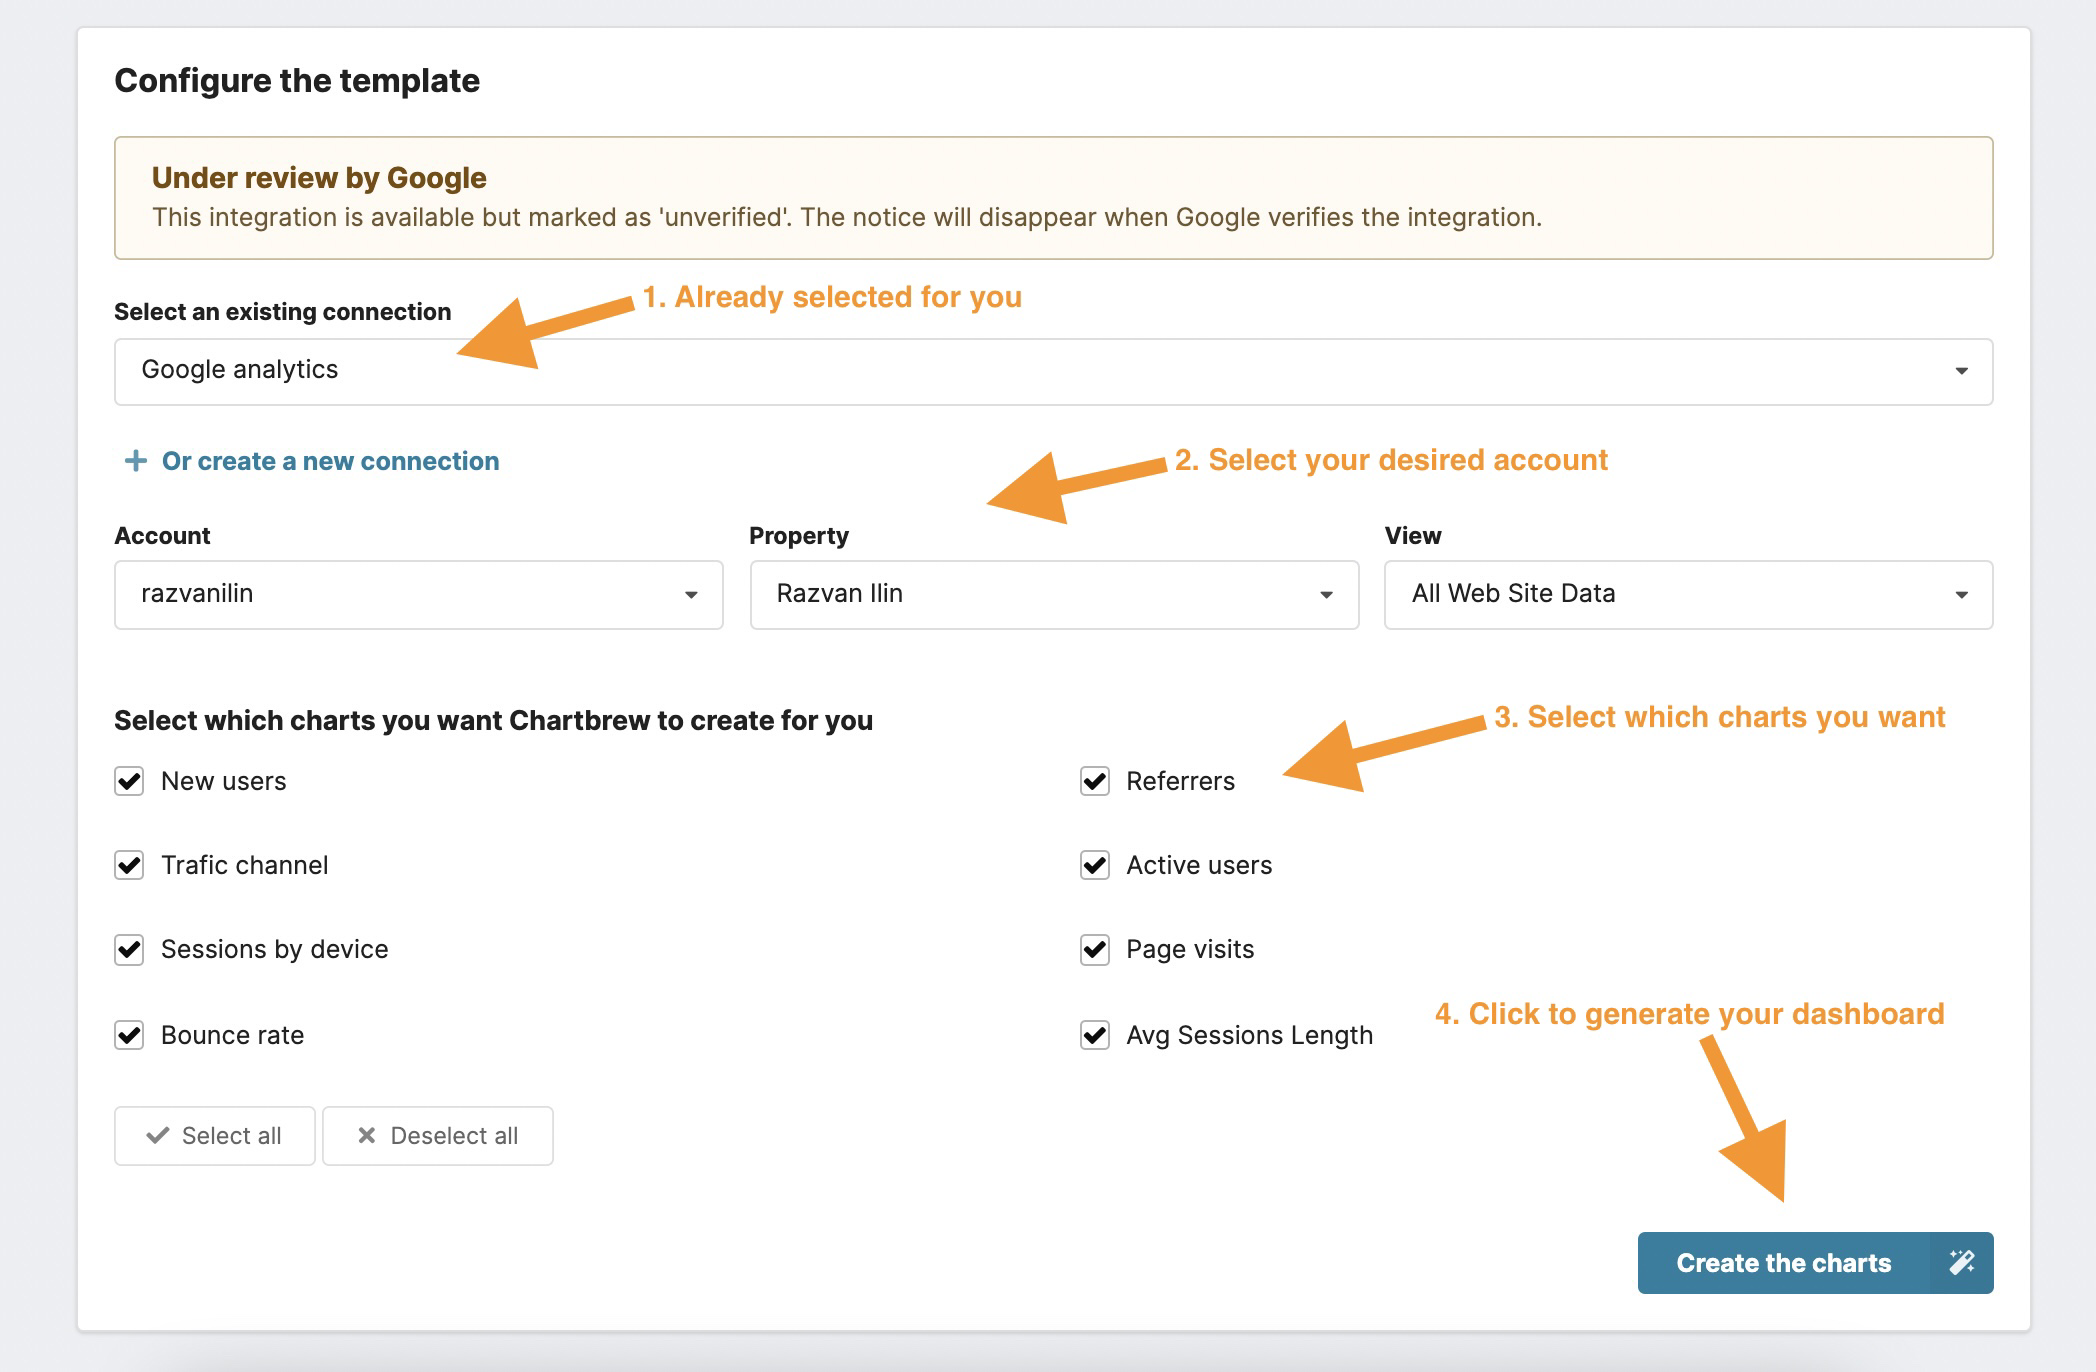
Configuring the template
After clicking "Allow", you will be redirected back to Chartbrew, where you have a brand new Google Analytics connection. You should now be able to browse your accounts and select from which one you want to fetch data. Once you make the selection and choose which charts to create, you will have a brand new dashboard with Google Analytics data.
Create custom charts with Google Analytics
Chartbrew allows you to access all the metrics and dimensions available in Google Analytics. You can then use this data to create visualizations directly in your Chartbrew dashboard.
To get started, head over to the Connections screen and create a Google Analytics connection if you do not have one already.
Next, name the connection and authenticate it with Google. You can see the instructions above. When the authentication is successful, Chartbrew will display the google account it managed to connect to.
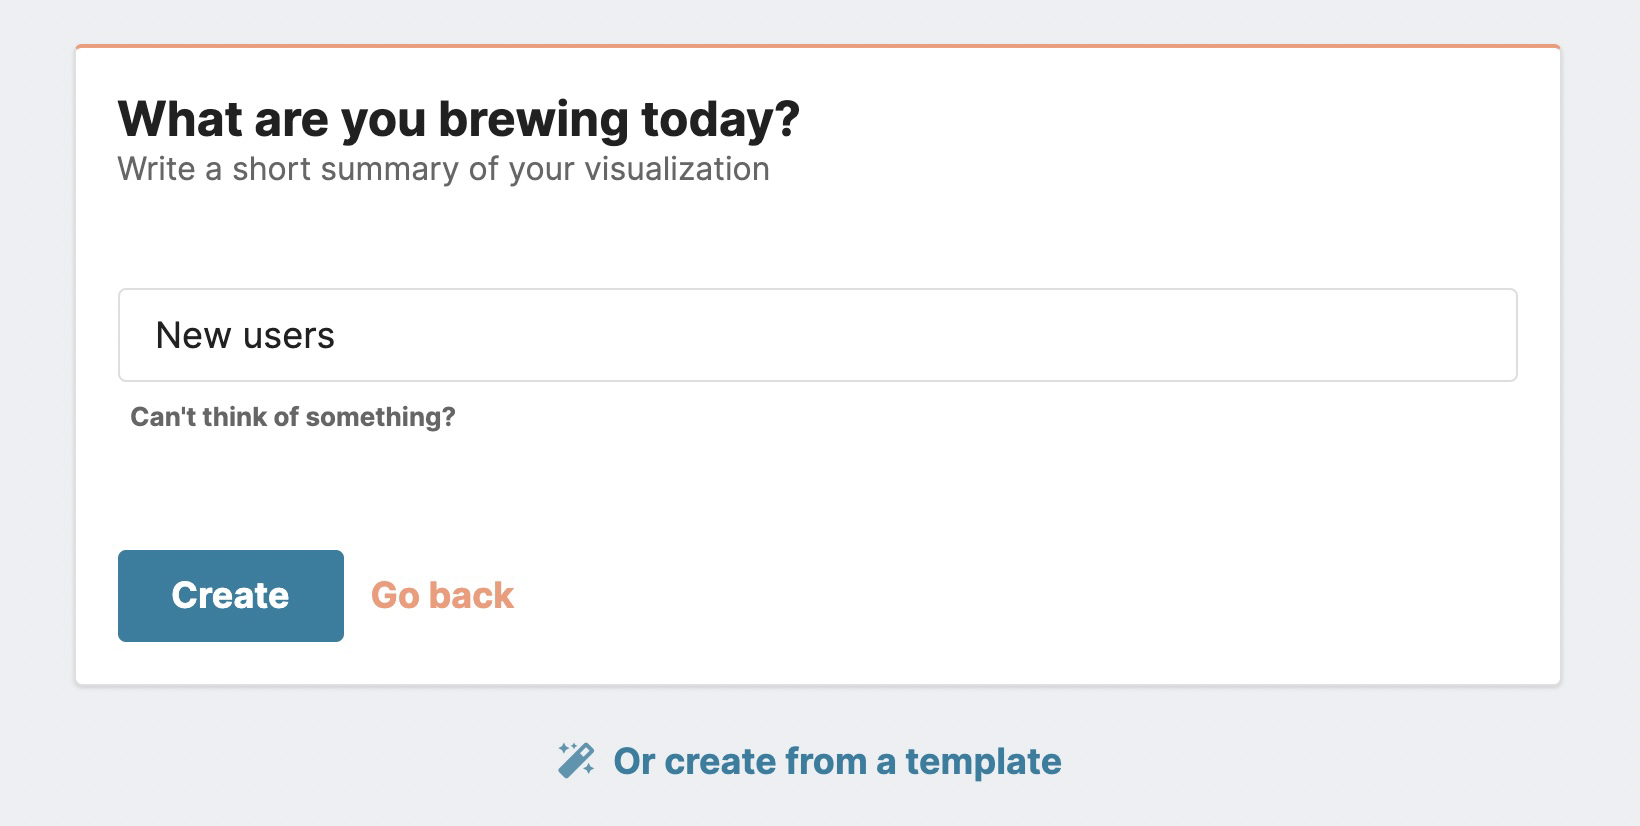
For this tutorial, let's create a chart showing the new users and bounces. Click on the "+" icon in the sidebar to create a new chart.
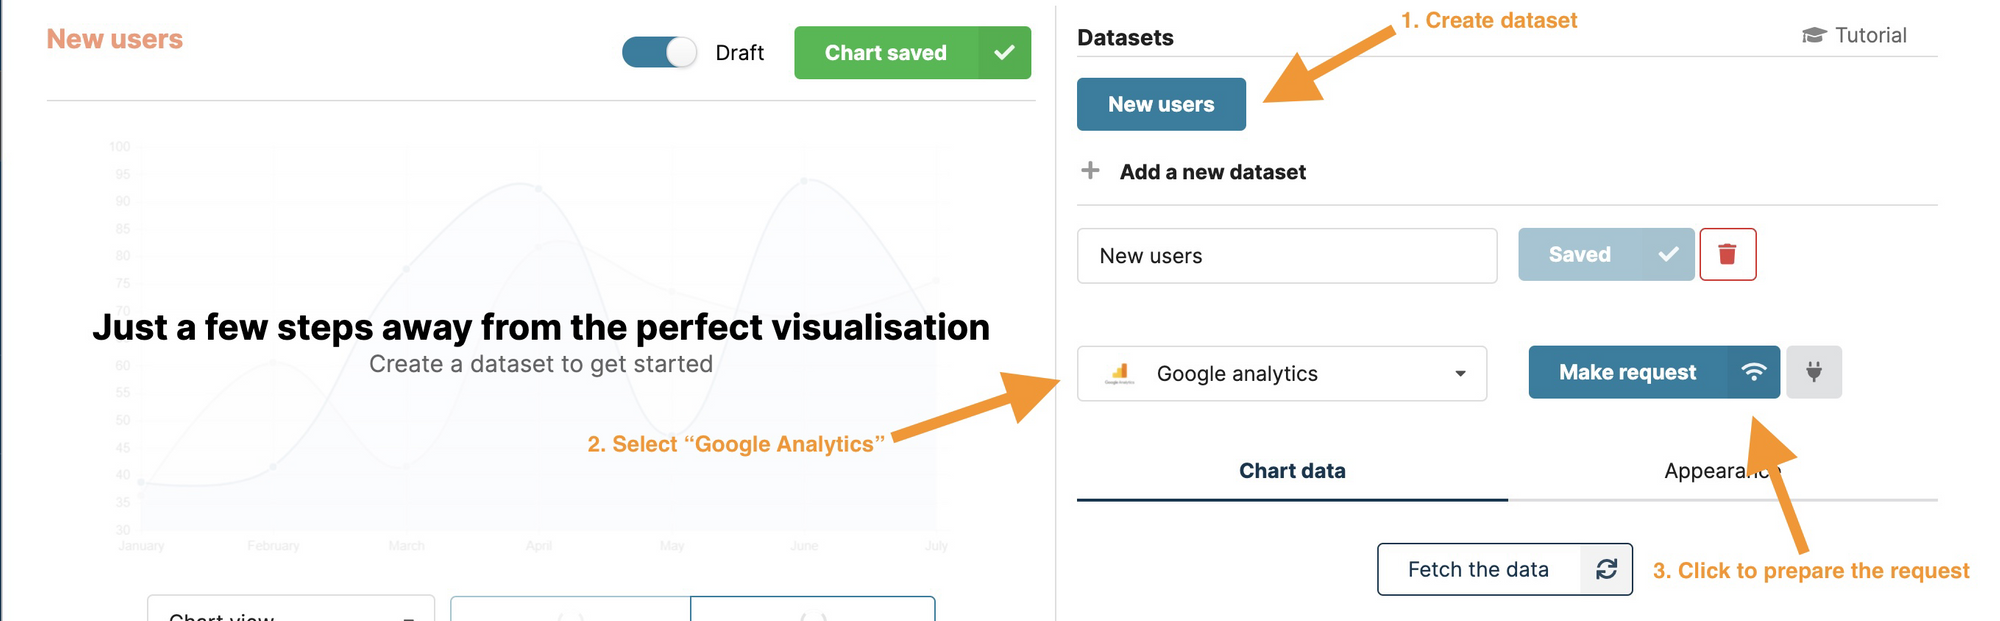
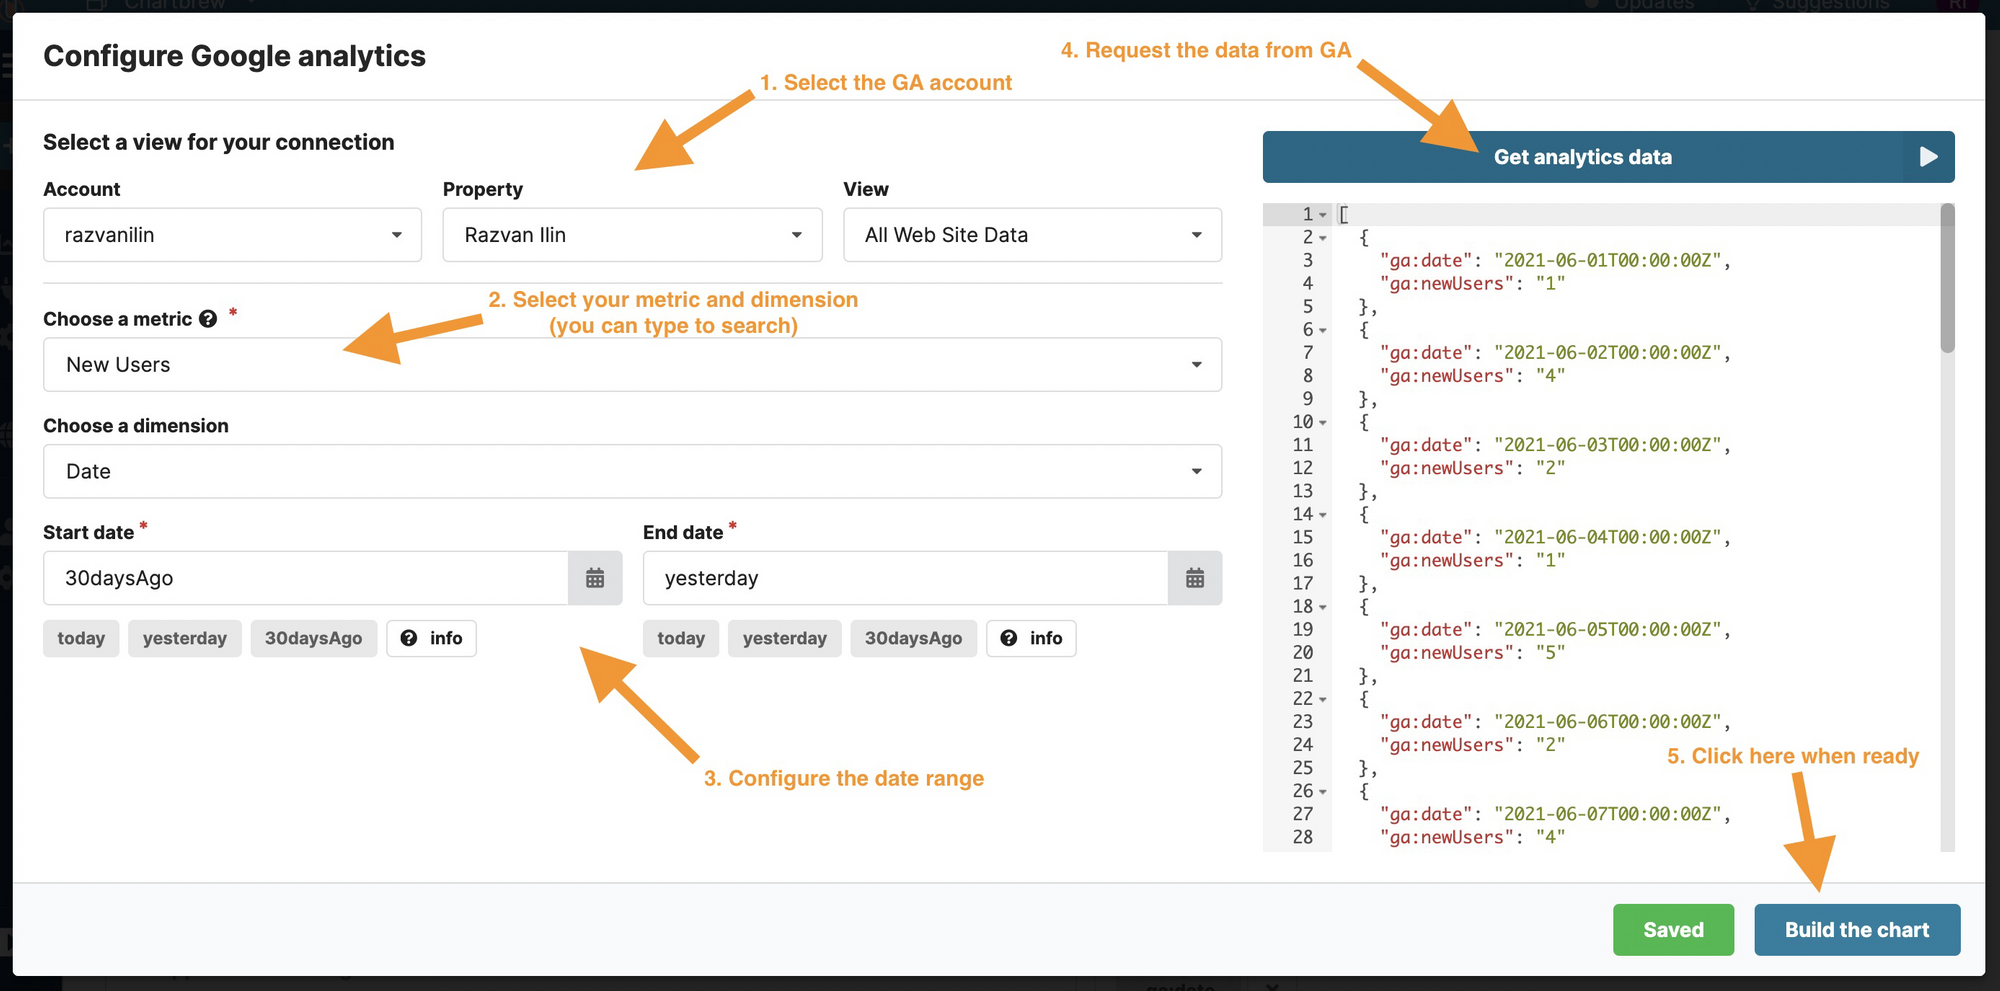
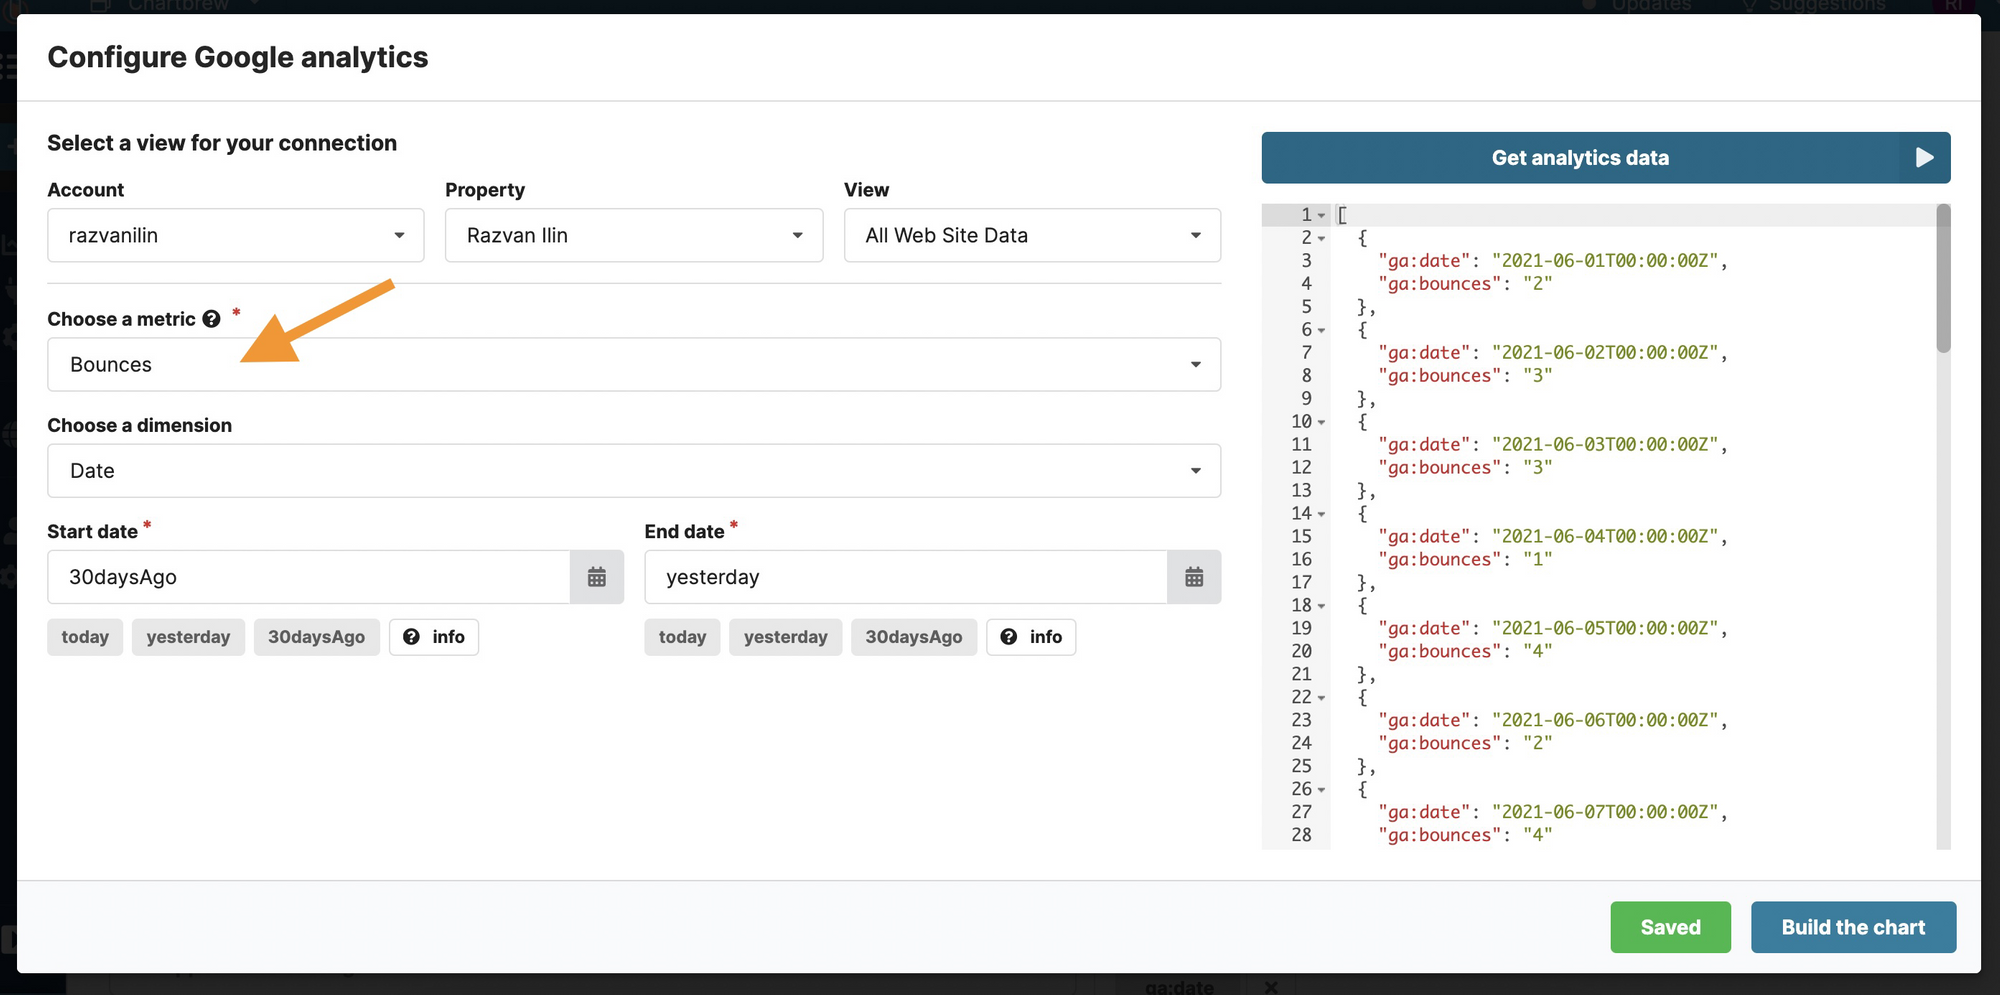
After clicking "Make request", Chartbrew will open the configuration window where we can select the Google Analytics account to fetch data. Afterward, we can request the metrics and dimensions on the given date range. Follow the instructions in the screenshot below to configure the request.
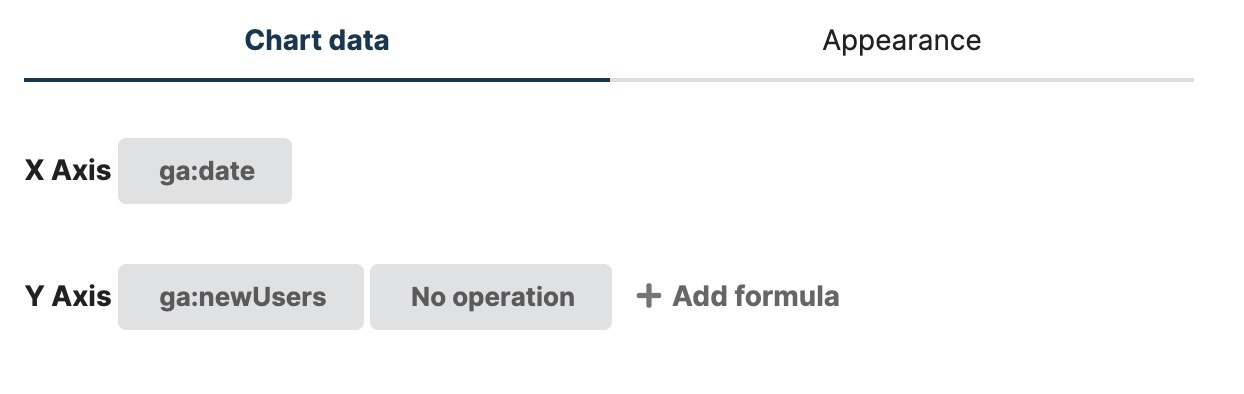
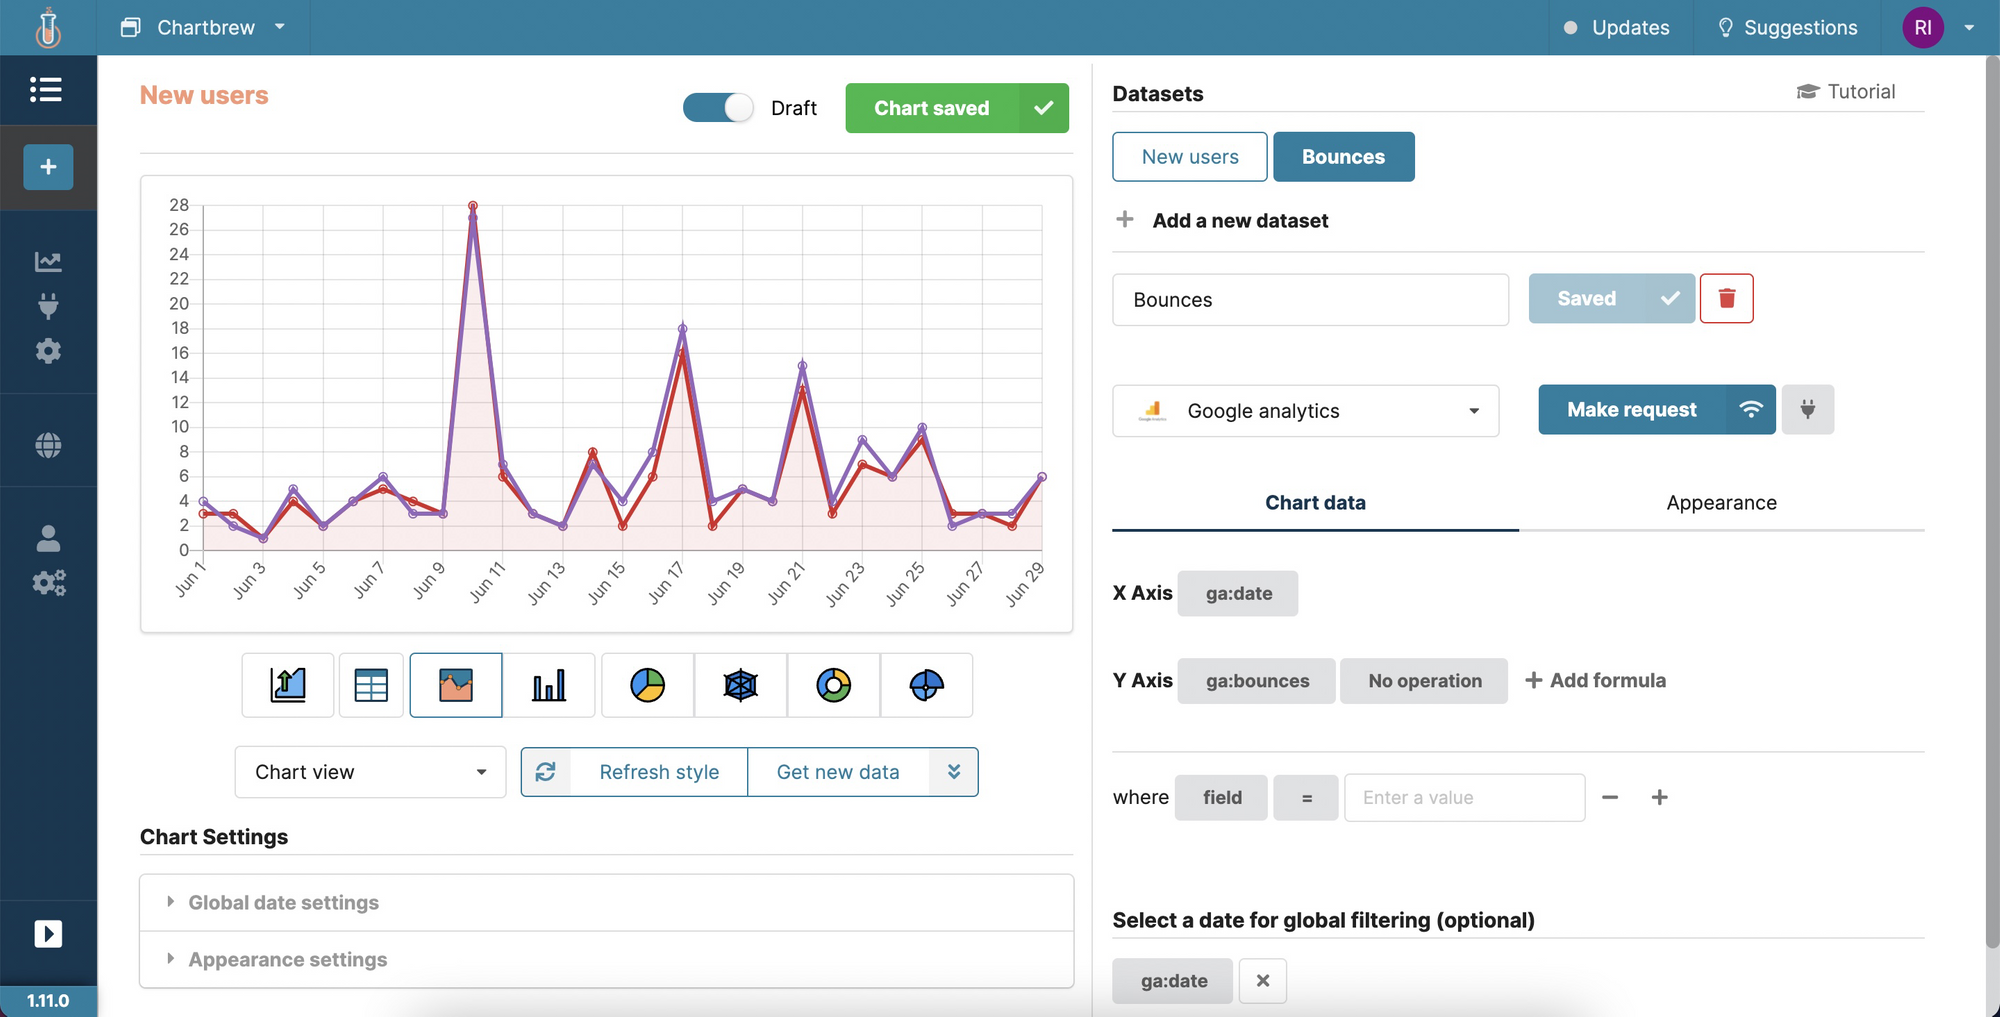
Next up, Chartbrew will try to select the right fields for you. In this case, we will need to change the Y-Axis operation from "count" to "No operation".
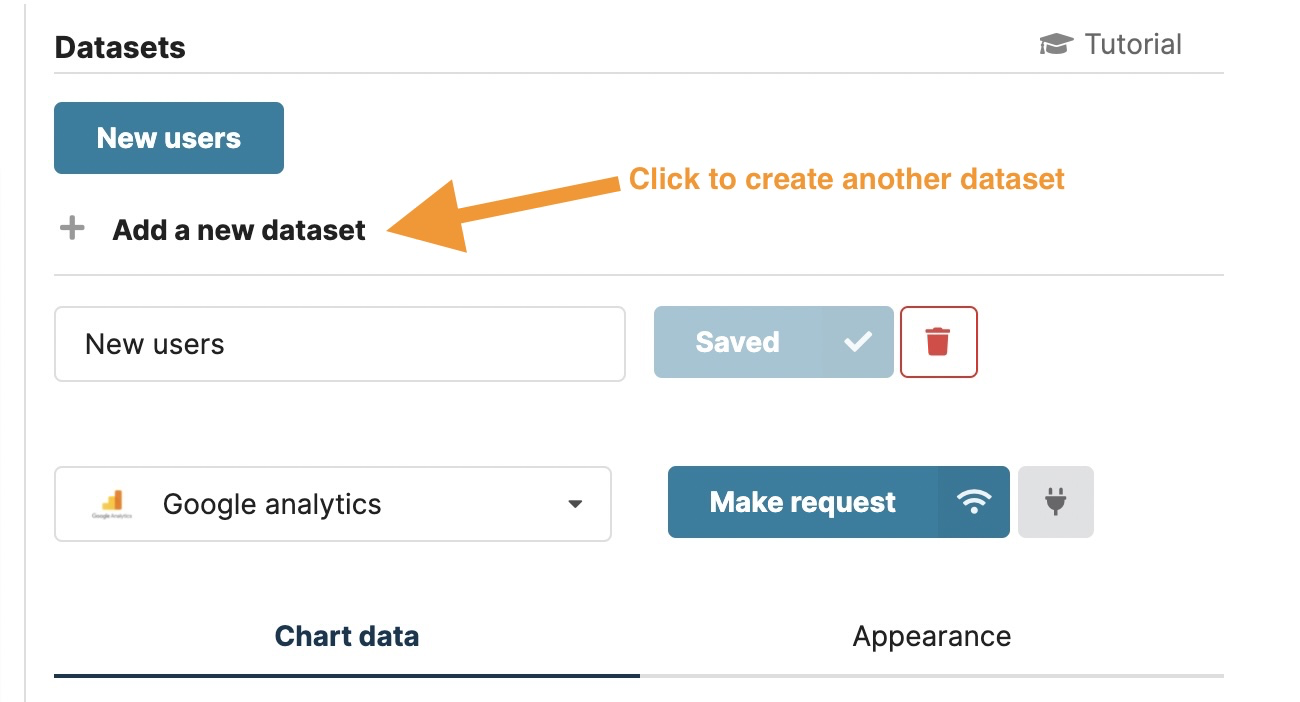
Now that we have the "new users" dataset, we will need to set another one up for "bounces". In Chartbrew you can create multiple datasets for the same chart, and even better, you can connect them to different data sources. In our case, let's create a new dataset and connect it to the same Google Analytics integration.
Repeat the same steps with this dataset, but instead of the "New Users" metric, select "Bounces".
Select the "No operation" option on the Y-Axis like before and now you will see a complete chart with two datasets.
With Chartbrew, you can also embed charts on external websites. For example, you can interact with the chart we just made here inside the blog:
Or check out the full dashboard here
Extra settings for your charts
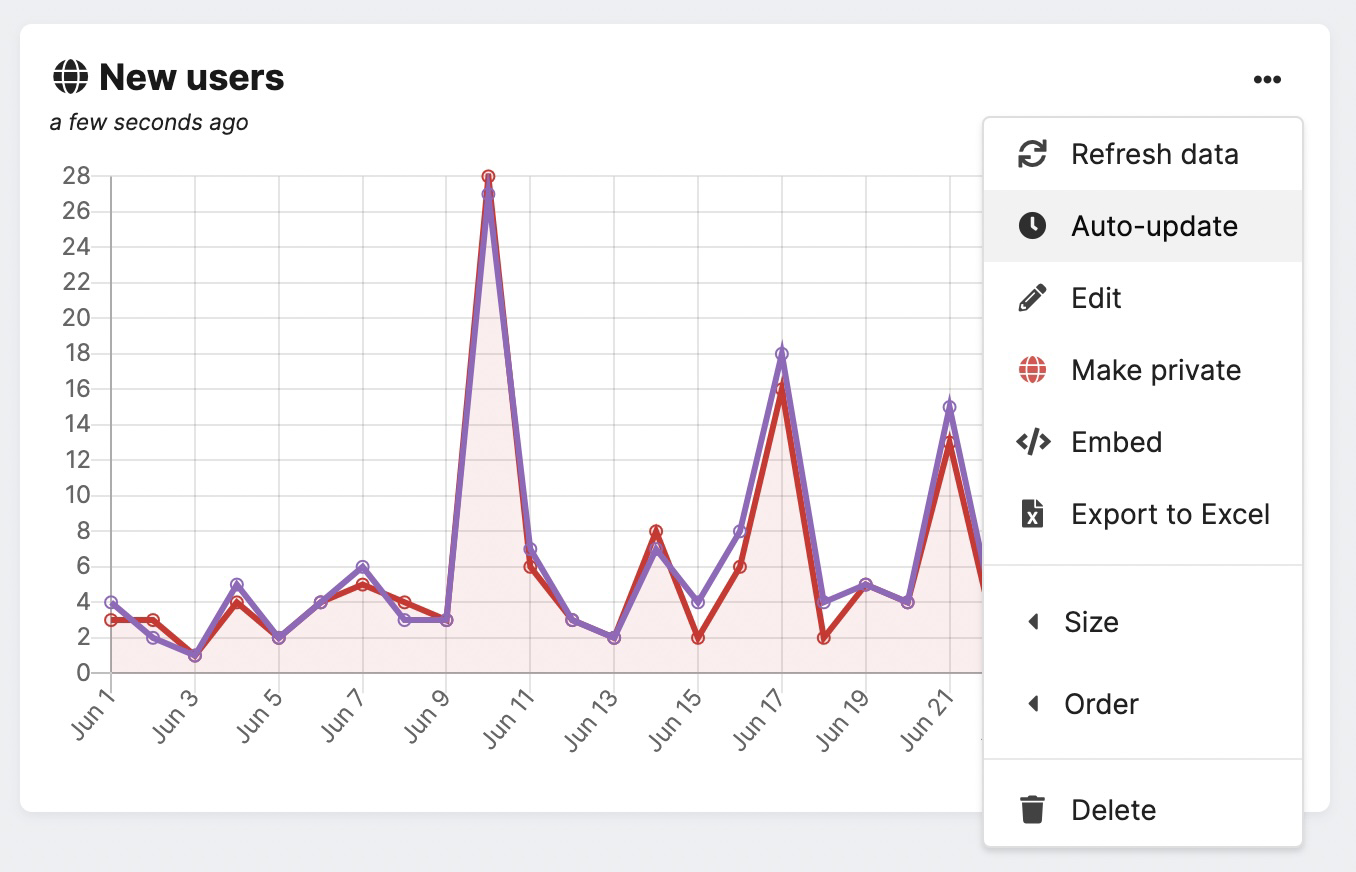
On top of embedding charts on external websites, Chartbrew can also do other things:
- Make charts public so others outside the platform can see them - perfect for sharing open stats
- Create an auto-update schedule so you can always keep your charts with up-to-date information
- Export the contents of the chart to an excel spreadsheet
- Resize and move the chart in the dashboard so you get the information in the order that makes sense to you
Next steps
- Set up your charts to auto-update so your dashboard stays fresh
- Business insights are more valuable when you can combine data. Try to add multiple data sources alongside Google Analytics
- Create a public dashboard that can be shared anywhere you'd like
