How to create, share, and customize client reports
Learn how to create, share, and customize client reports with Chartbrew. Enjoy features like unique public URLs, team-only access, password protection, and extensive customization options.

Chartbrew offers the option to create a report out of each of your dashboards. The reports are useful when presenting data to your team and/or clients. The main benefits of using reports to present the data:
- No dashboard editing features are being displayed
- Sharing settings (unique public URL, team-only access, password protection)
- Customizable (add your logo, colors, font, and custom CSS)
- Add/remove charts from the report with one click
- Custom title and description text area
Feel free to skip to any relevant sections you want to know more about. You can also follow this tutorial step-by-step. The tutorial uses public website visitor data from chartbrew.com.
Alternatively, you can follow this tutorial even without signing up for a Chartbrew account. Just click on the link below to generate a temporary dashboard:

Setting up
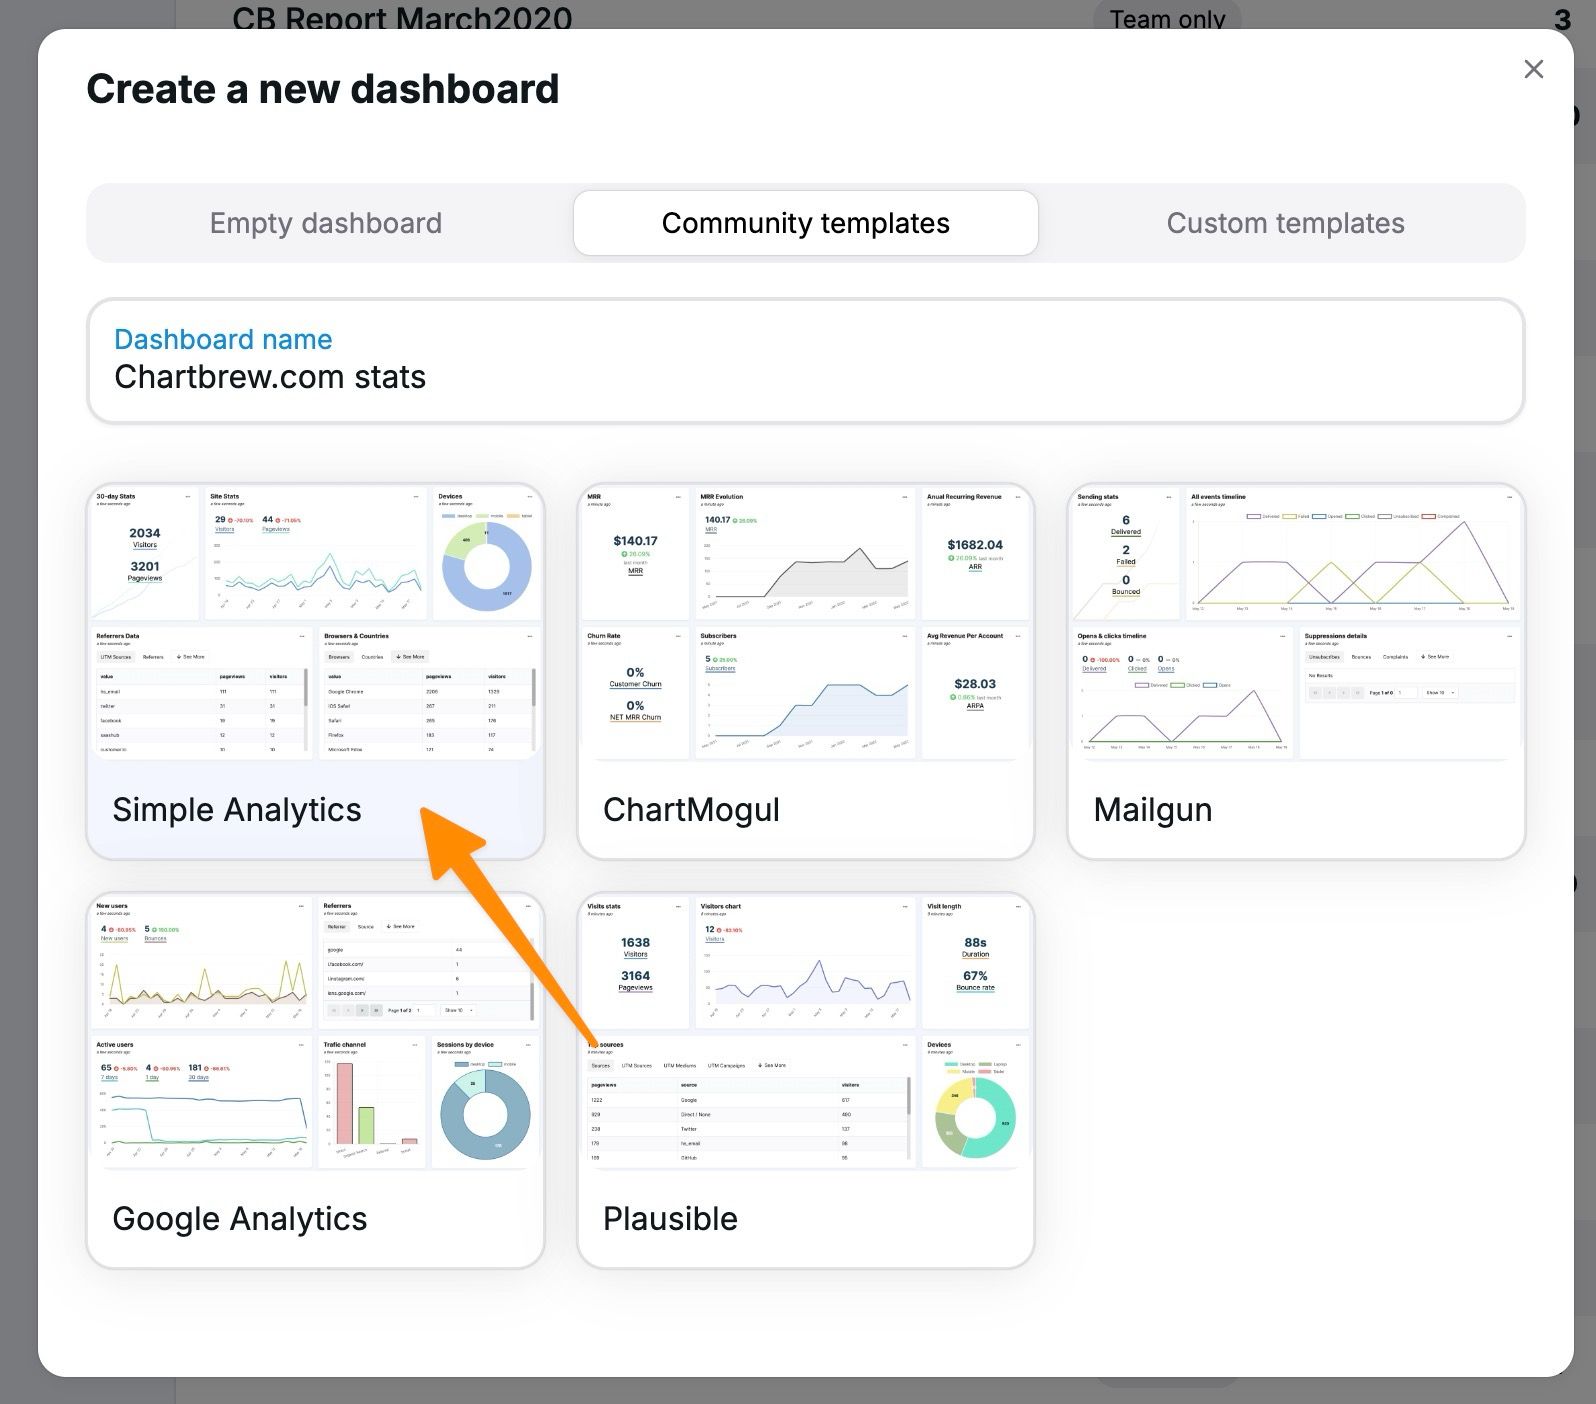
To get started, create a new dashboard from your home page. Give your dashboard a descriptive name and select the Simple Analytics template.
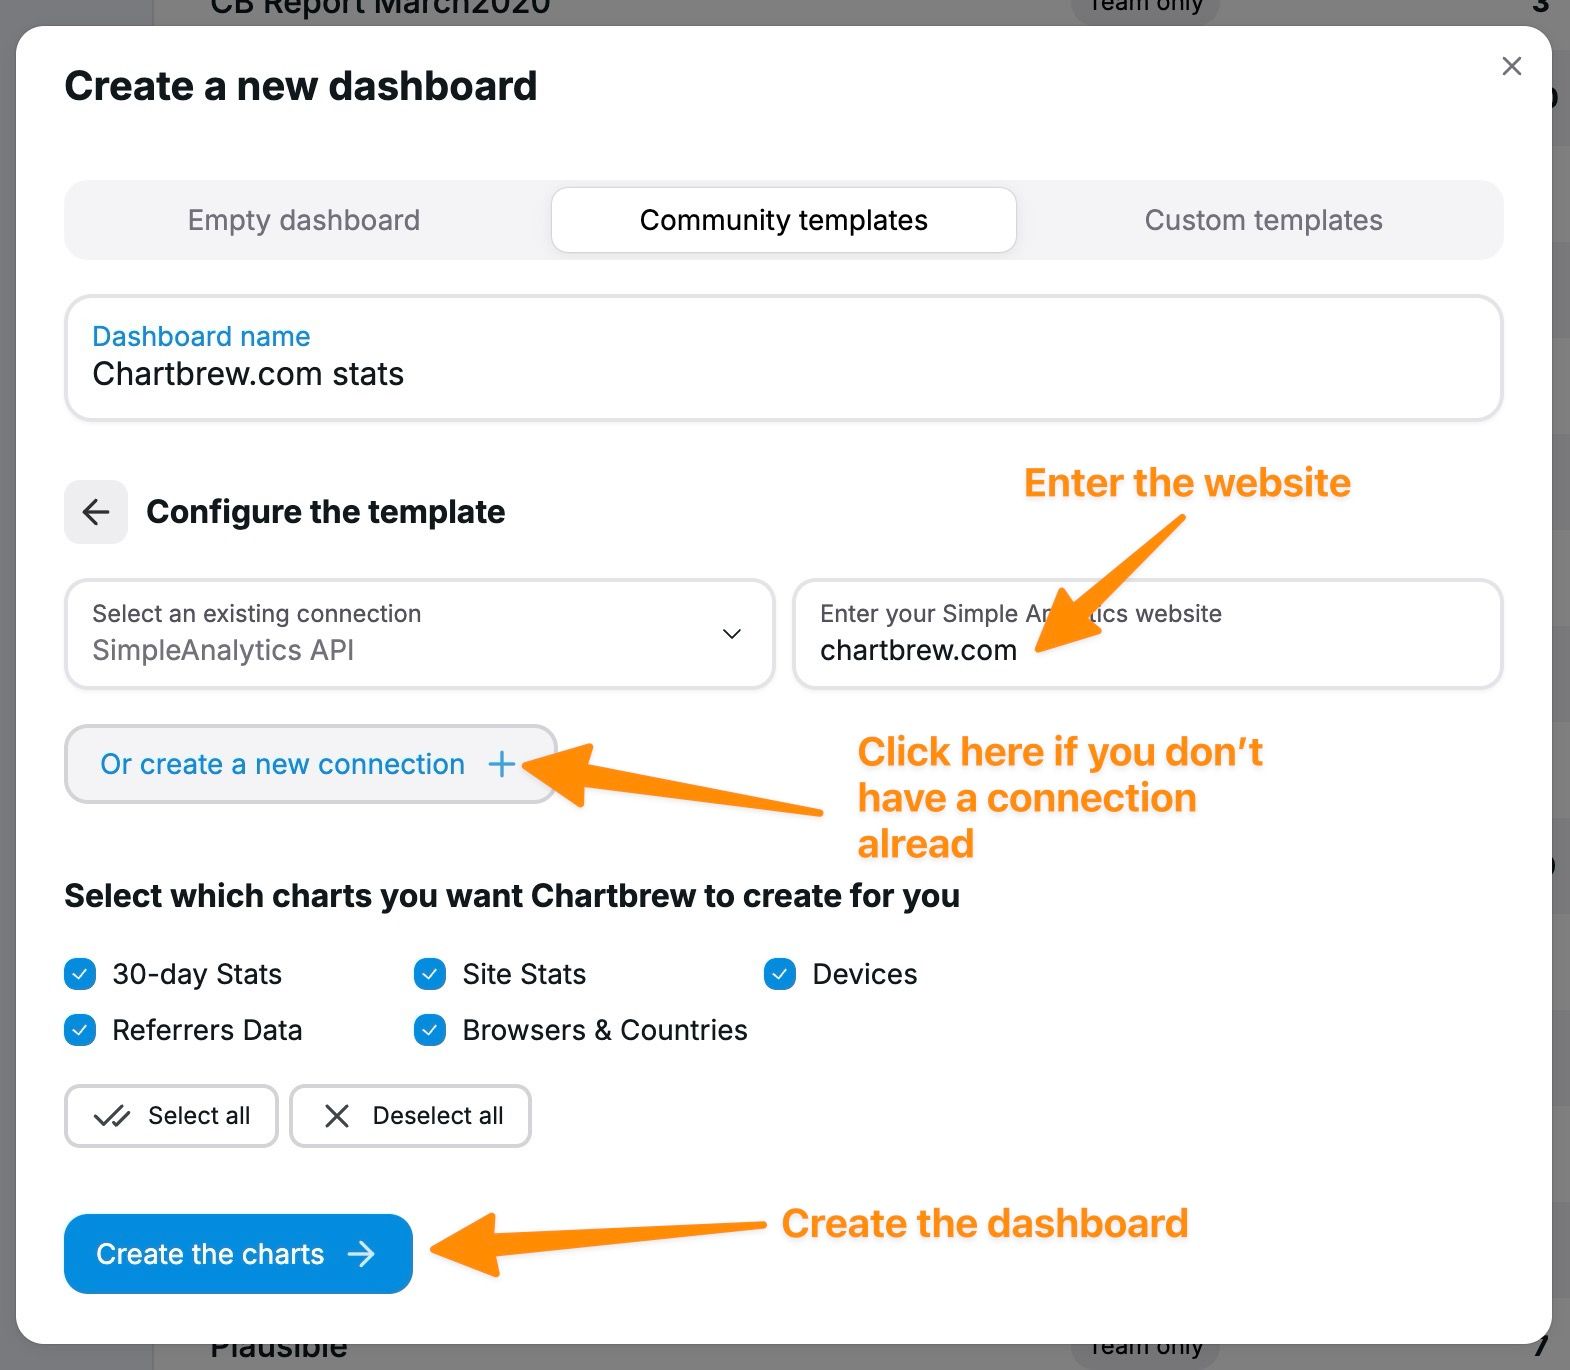
The template requires a bit of information about the website you want to get the stats from and the API key if needed. Since chartbrew.com has public Simple Analytics data, you can use it as a test without an API key.
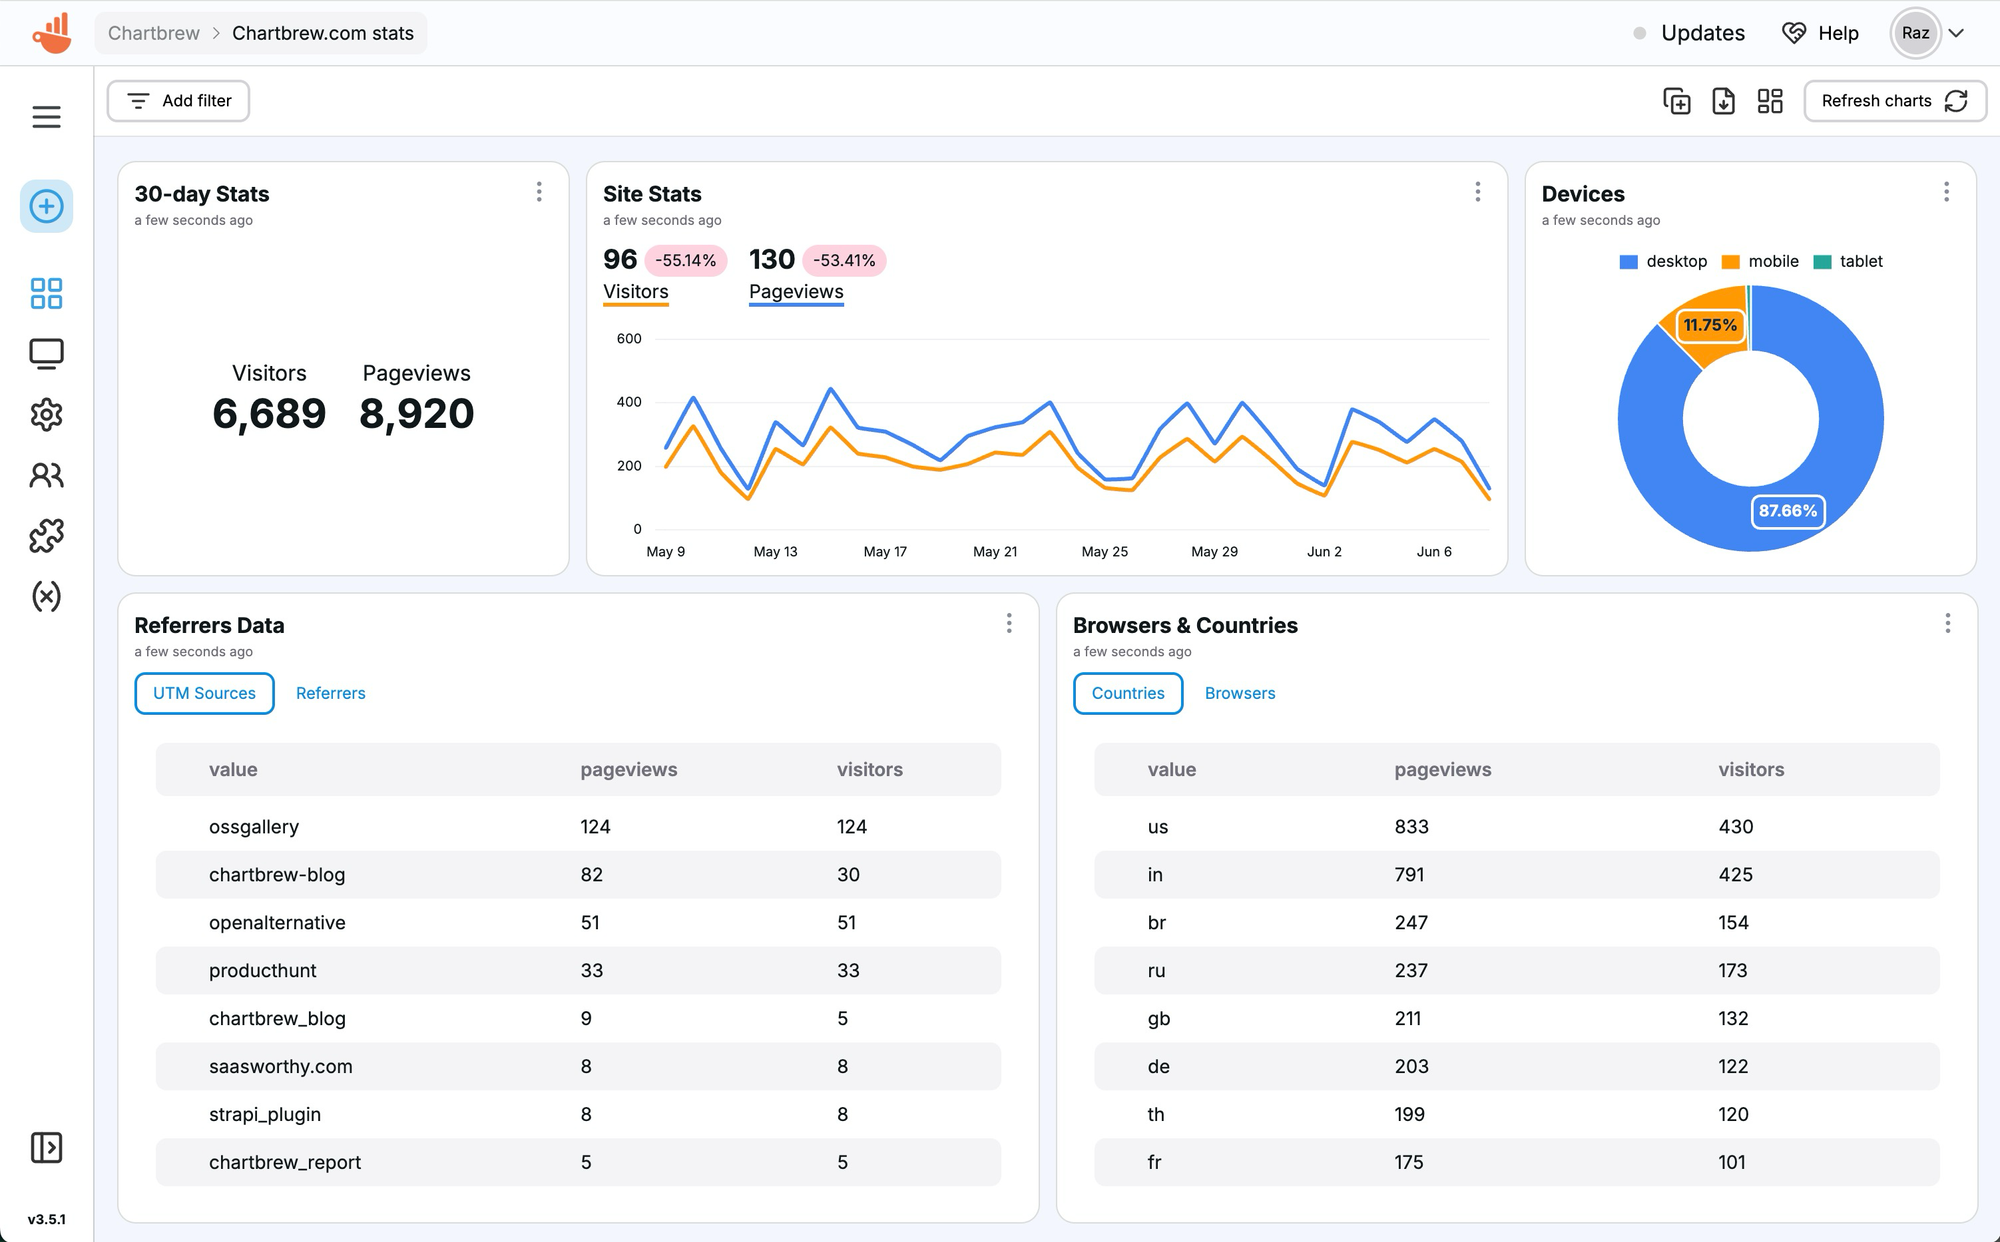
After a couple of seconds, you should have the new dashboard generated
automatically for you and it should look something like this:
Add charts to a report
Now that we have some charts to work with, it's time to create a report. Note that this dashboard cannot be shared with anyone outside your team yet. Only reports can be shared.
Let's add all these charts to the report and then start editing. To add a chart to the report, open the chart settings dropdown menu and click on "Add to report".
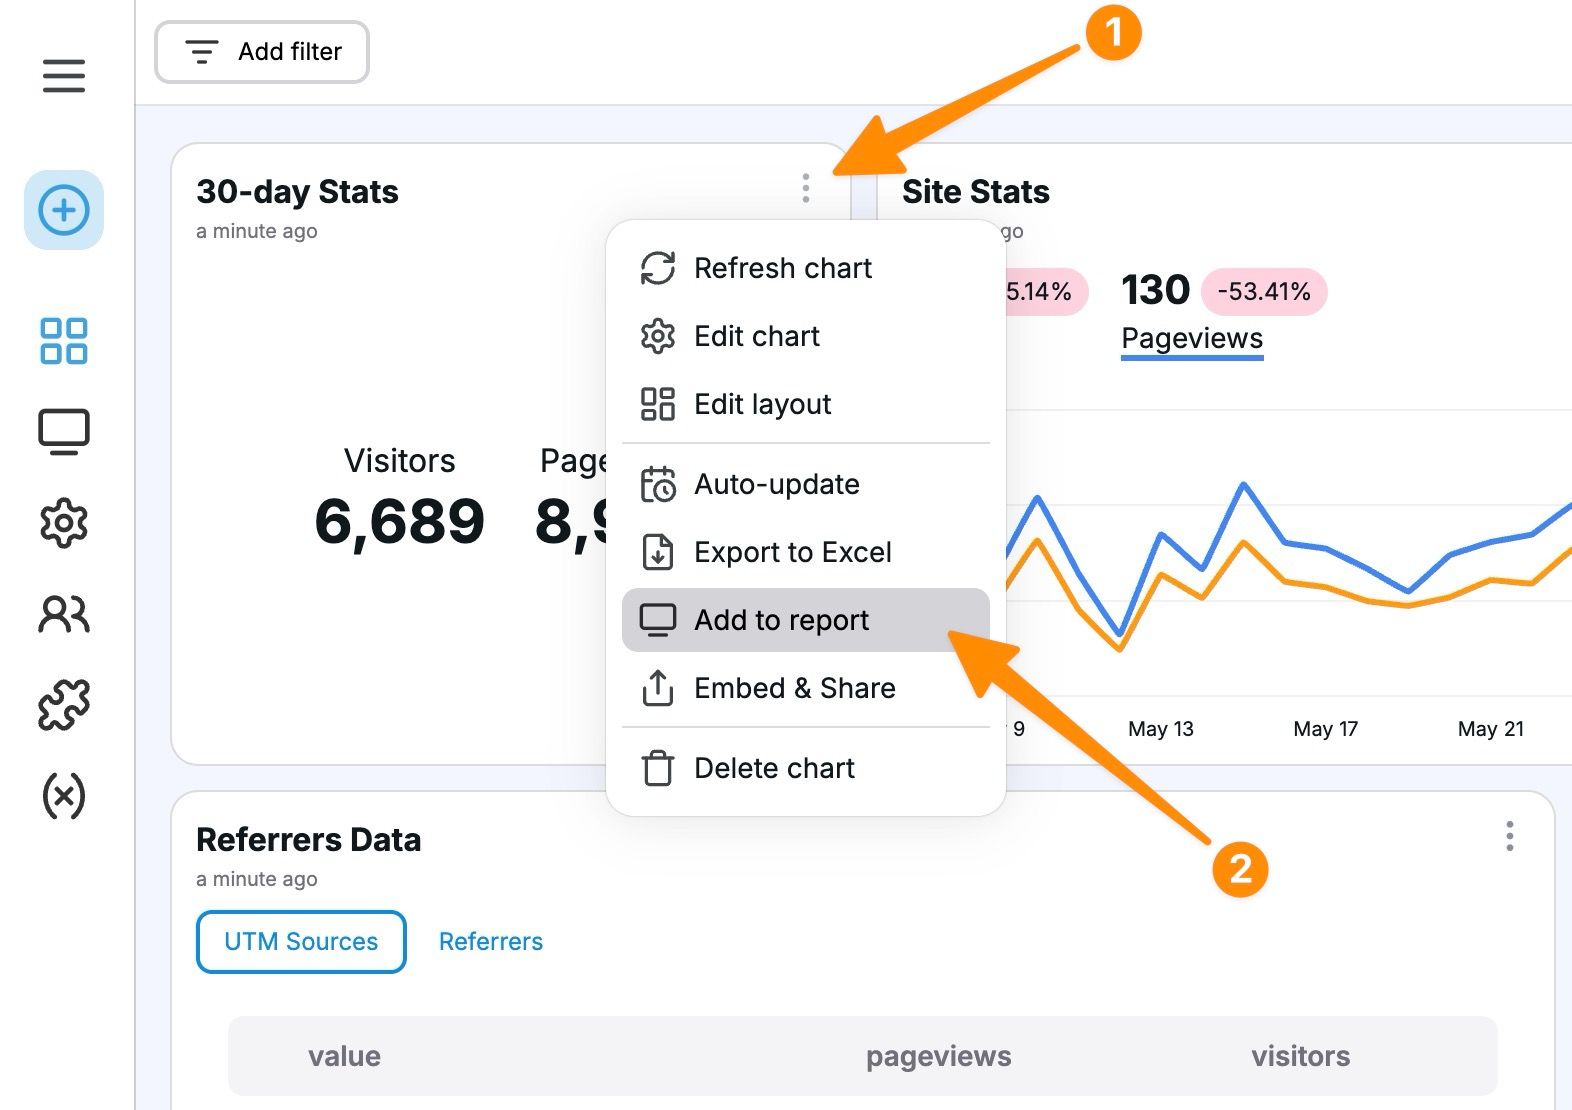
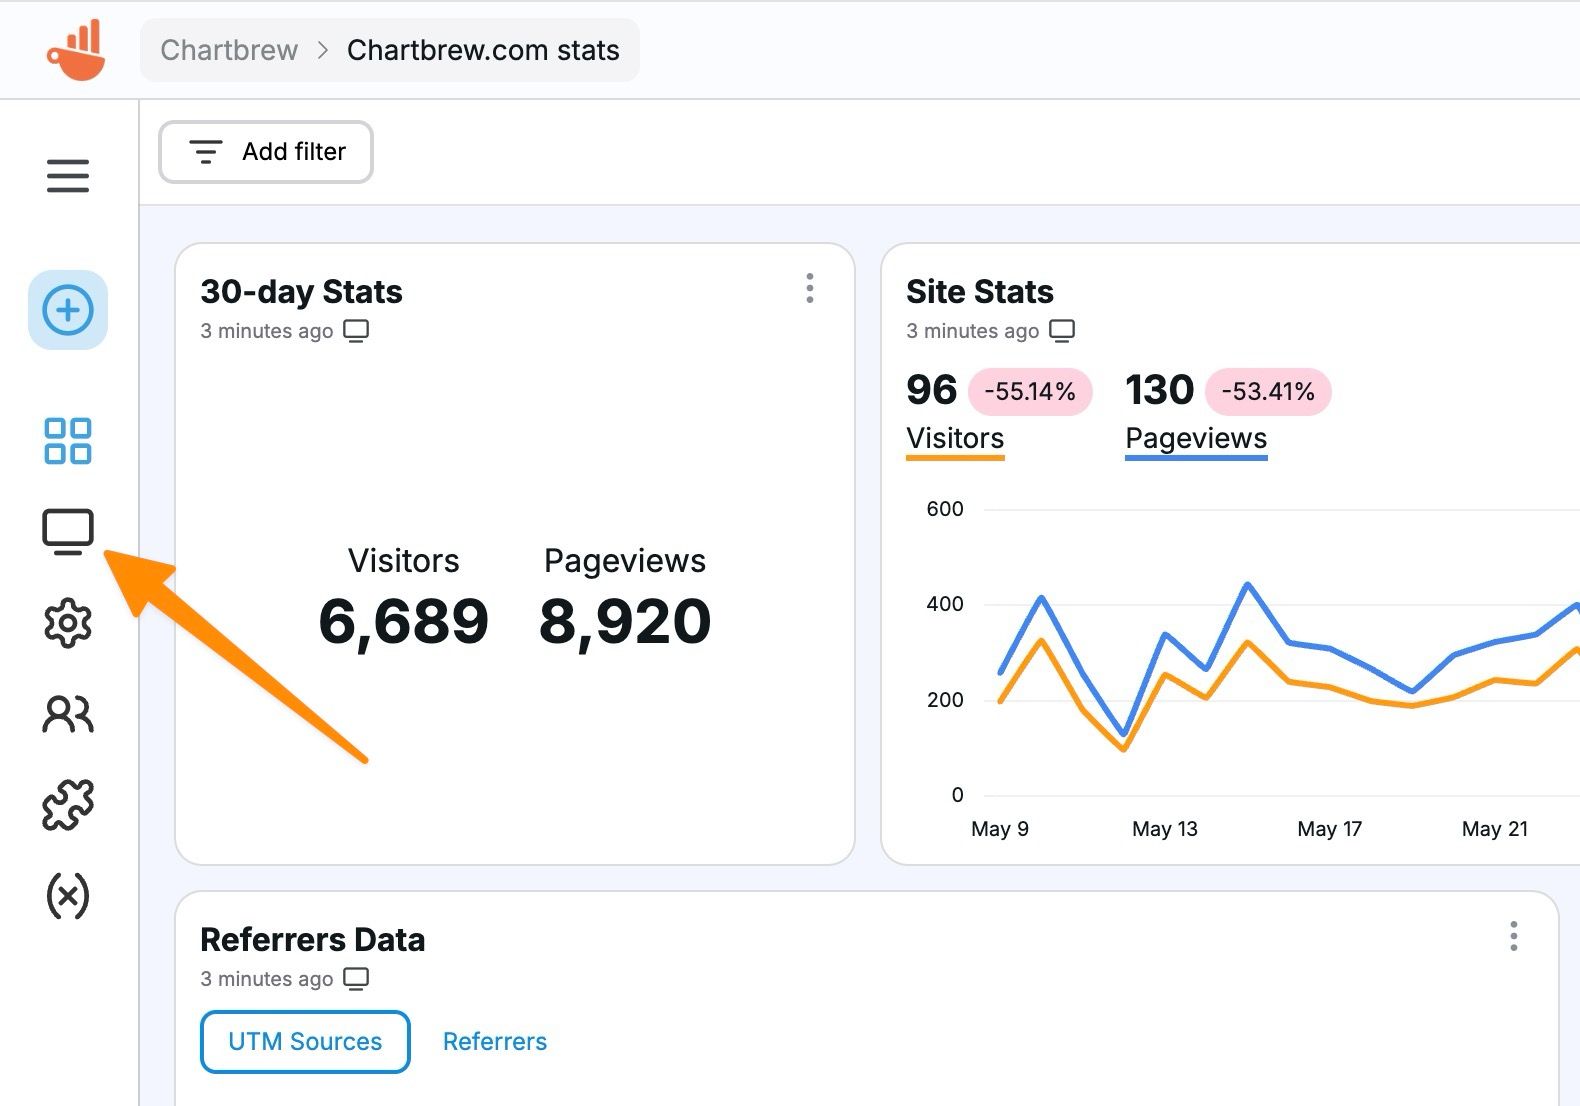
After you do this you will notice a "screen" icon appear under the chart title. This means the chart is visible on the report. Repeat this step with all the charts to add them all to the report. You can then access the report from the side menu as shown in the picture below.
Editing the report
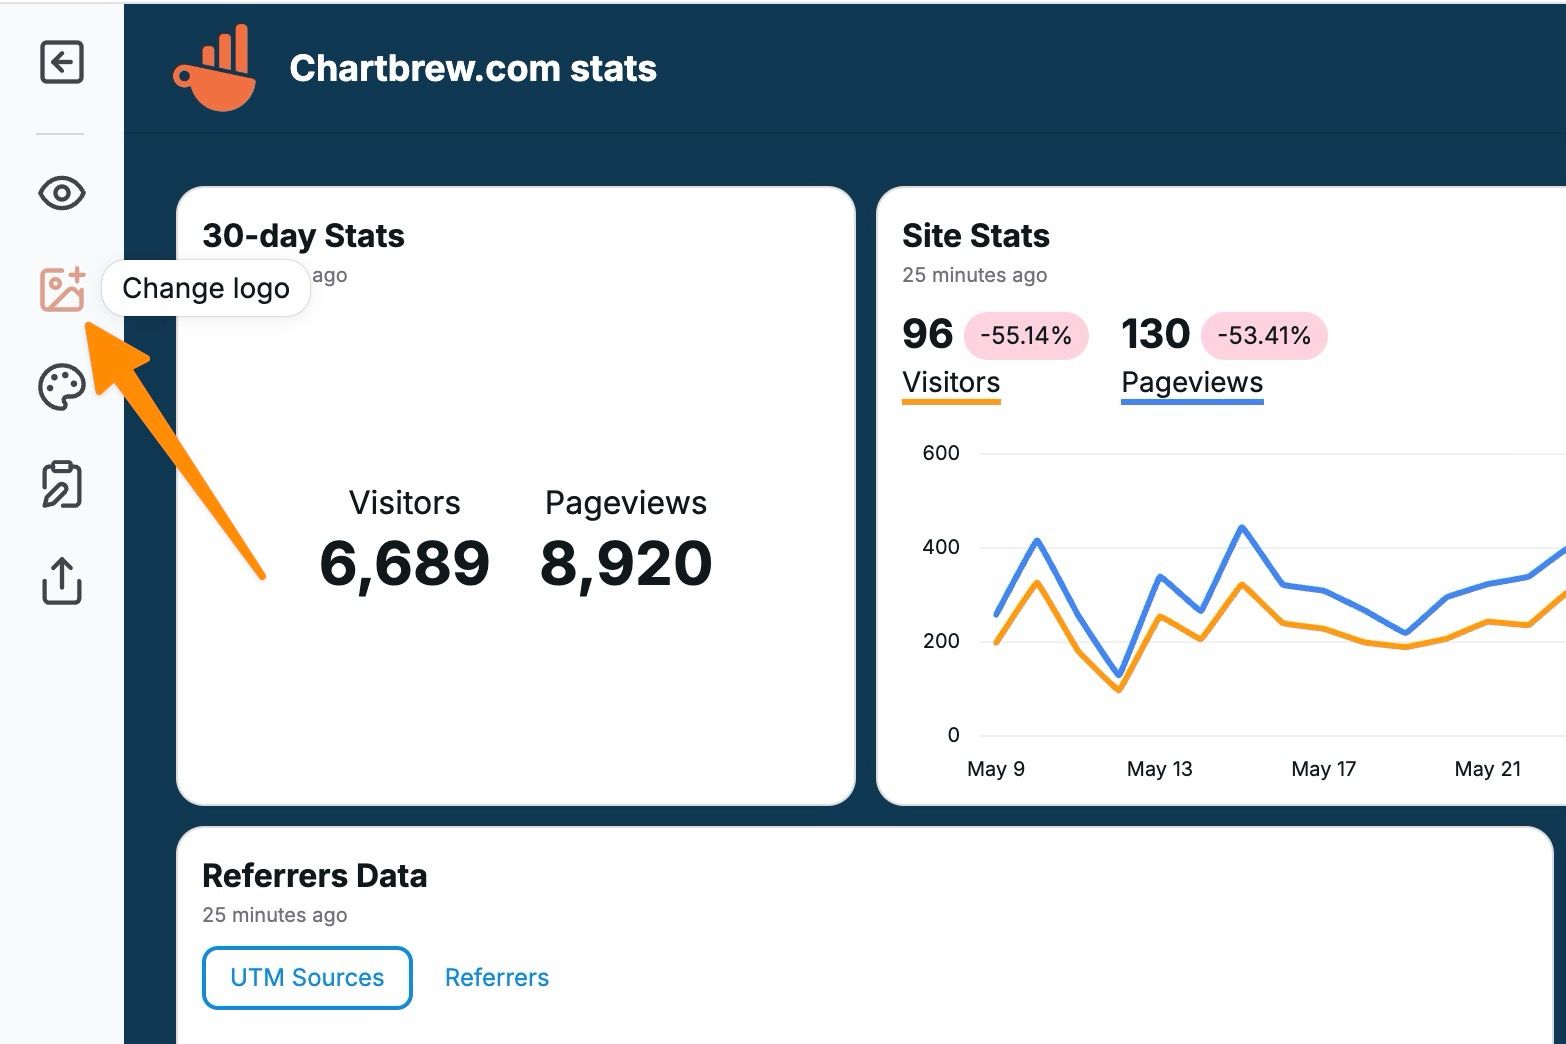
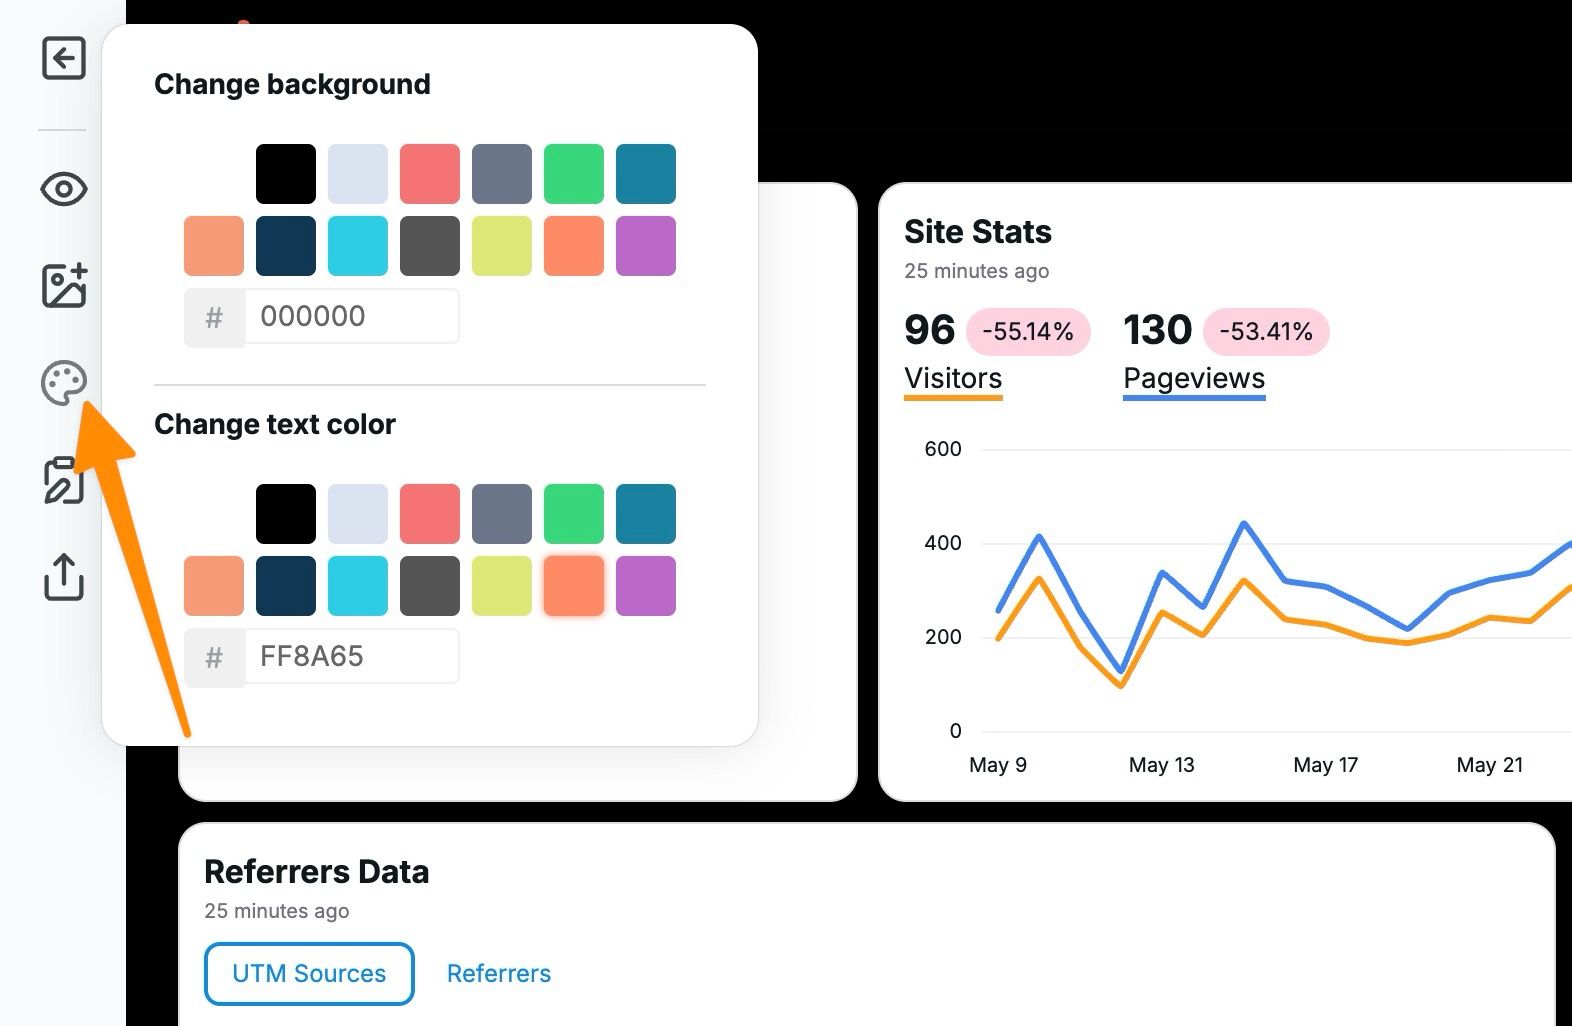
The team editors and admins can see a toolbar with multiple actions on the sidebar of the report. These actions will let you edit the report to match your brand. Let's go over all the available options, starting with changing the logo. You can change this by clicking on the image icon in the sidebar.
Next, let's change the background and text color to match the look and feel of chartbrew.com.
The title and description of the report can be changed as well. On top of this, you can add your custom CSS to the page.
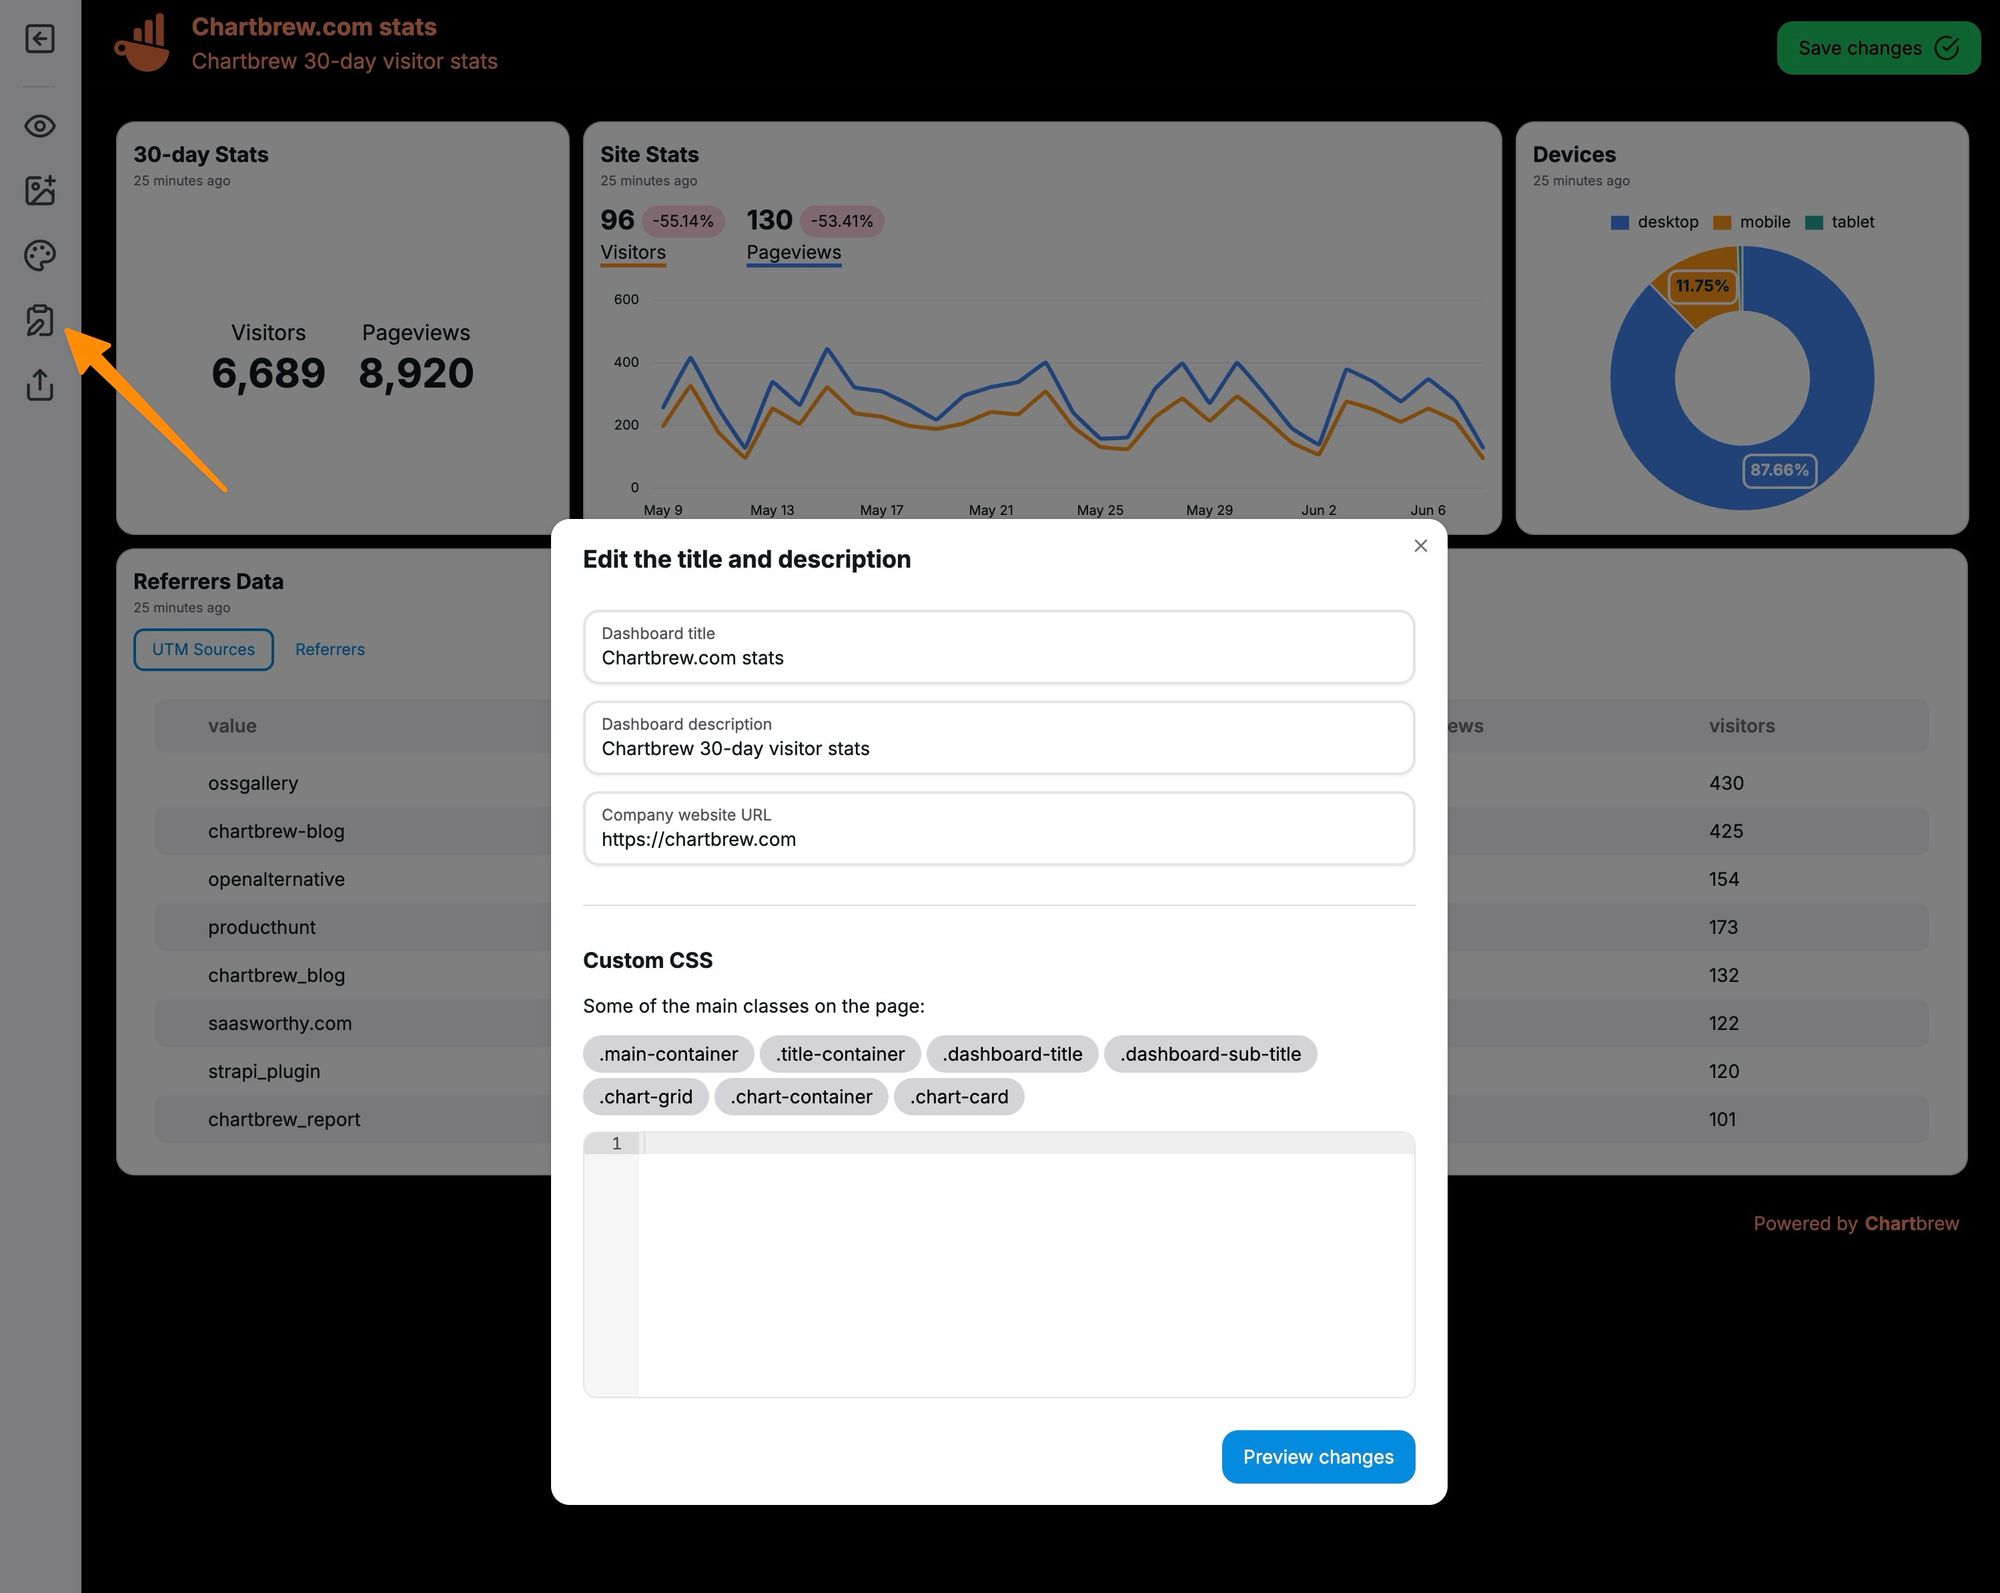
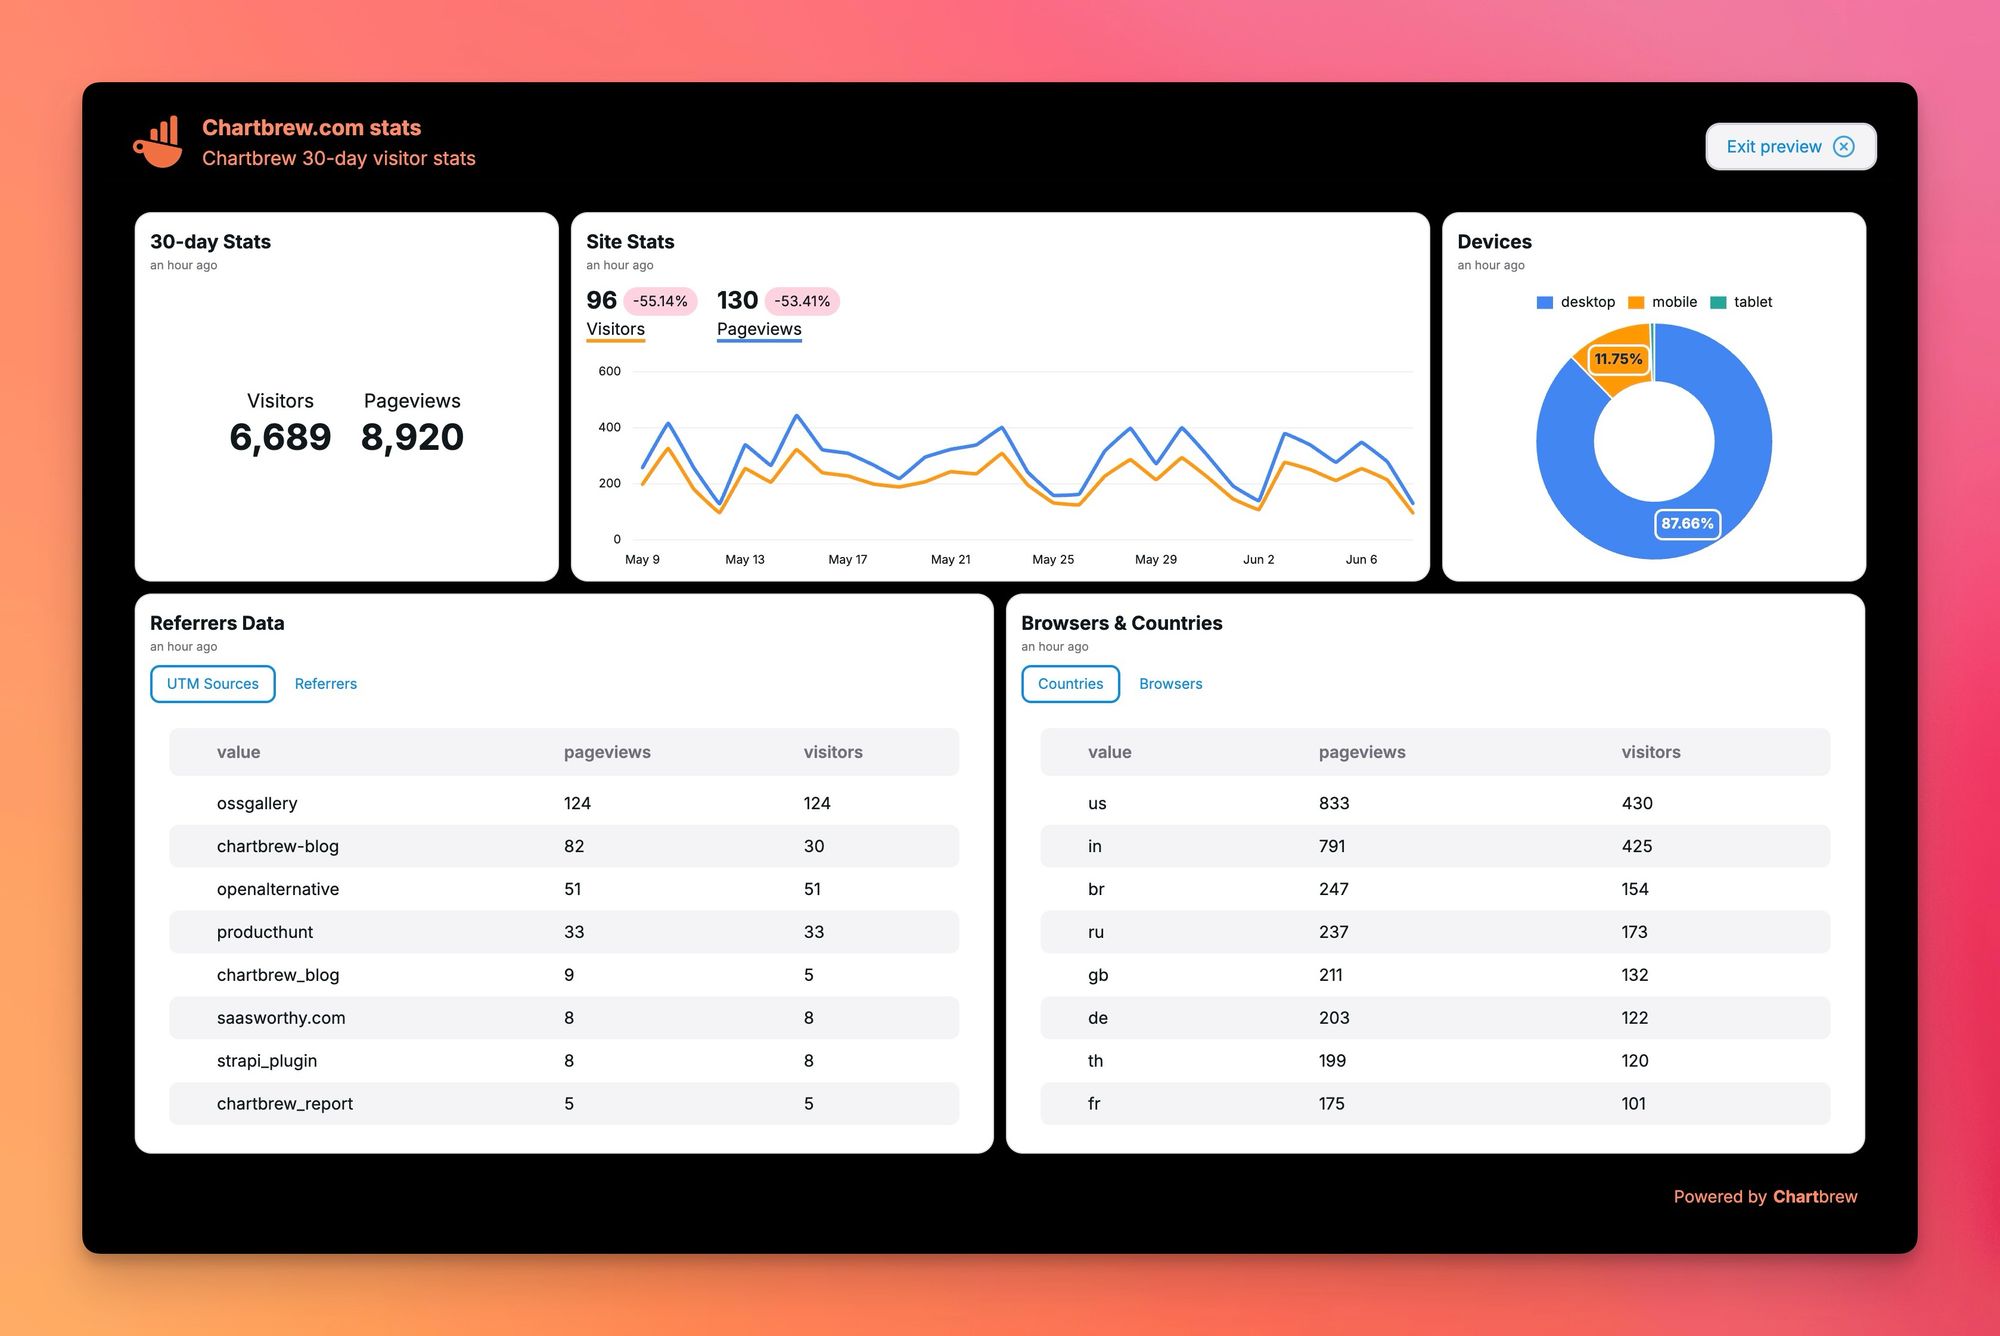
And with this, we now have a branded report that can be shared with others. Next, we'll go over different ways a report can be shared.
Sharing a report
By default, a Chartbrew report is private, so only team members can access it. There are 3 main ways that reports can be shared:
- Private - Share the private report with team members only
- Public - Mark a report as public and anyone with the link can see it
- Password protected - A public report that can only be accessed with a password
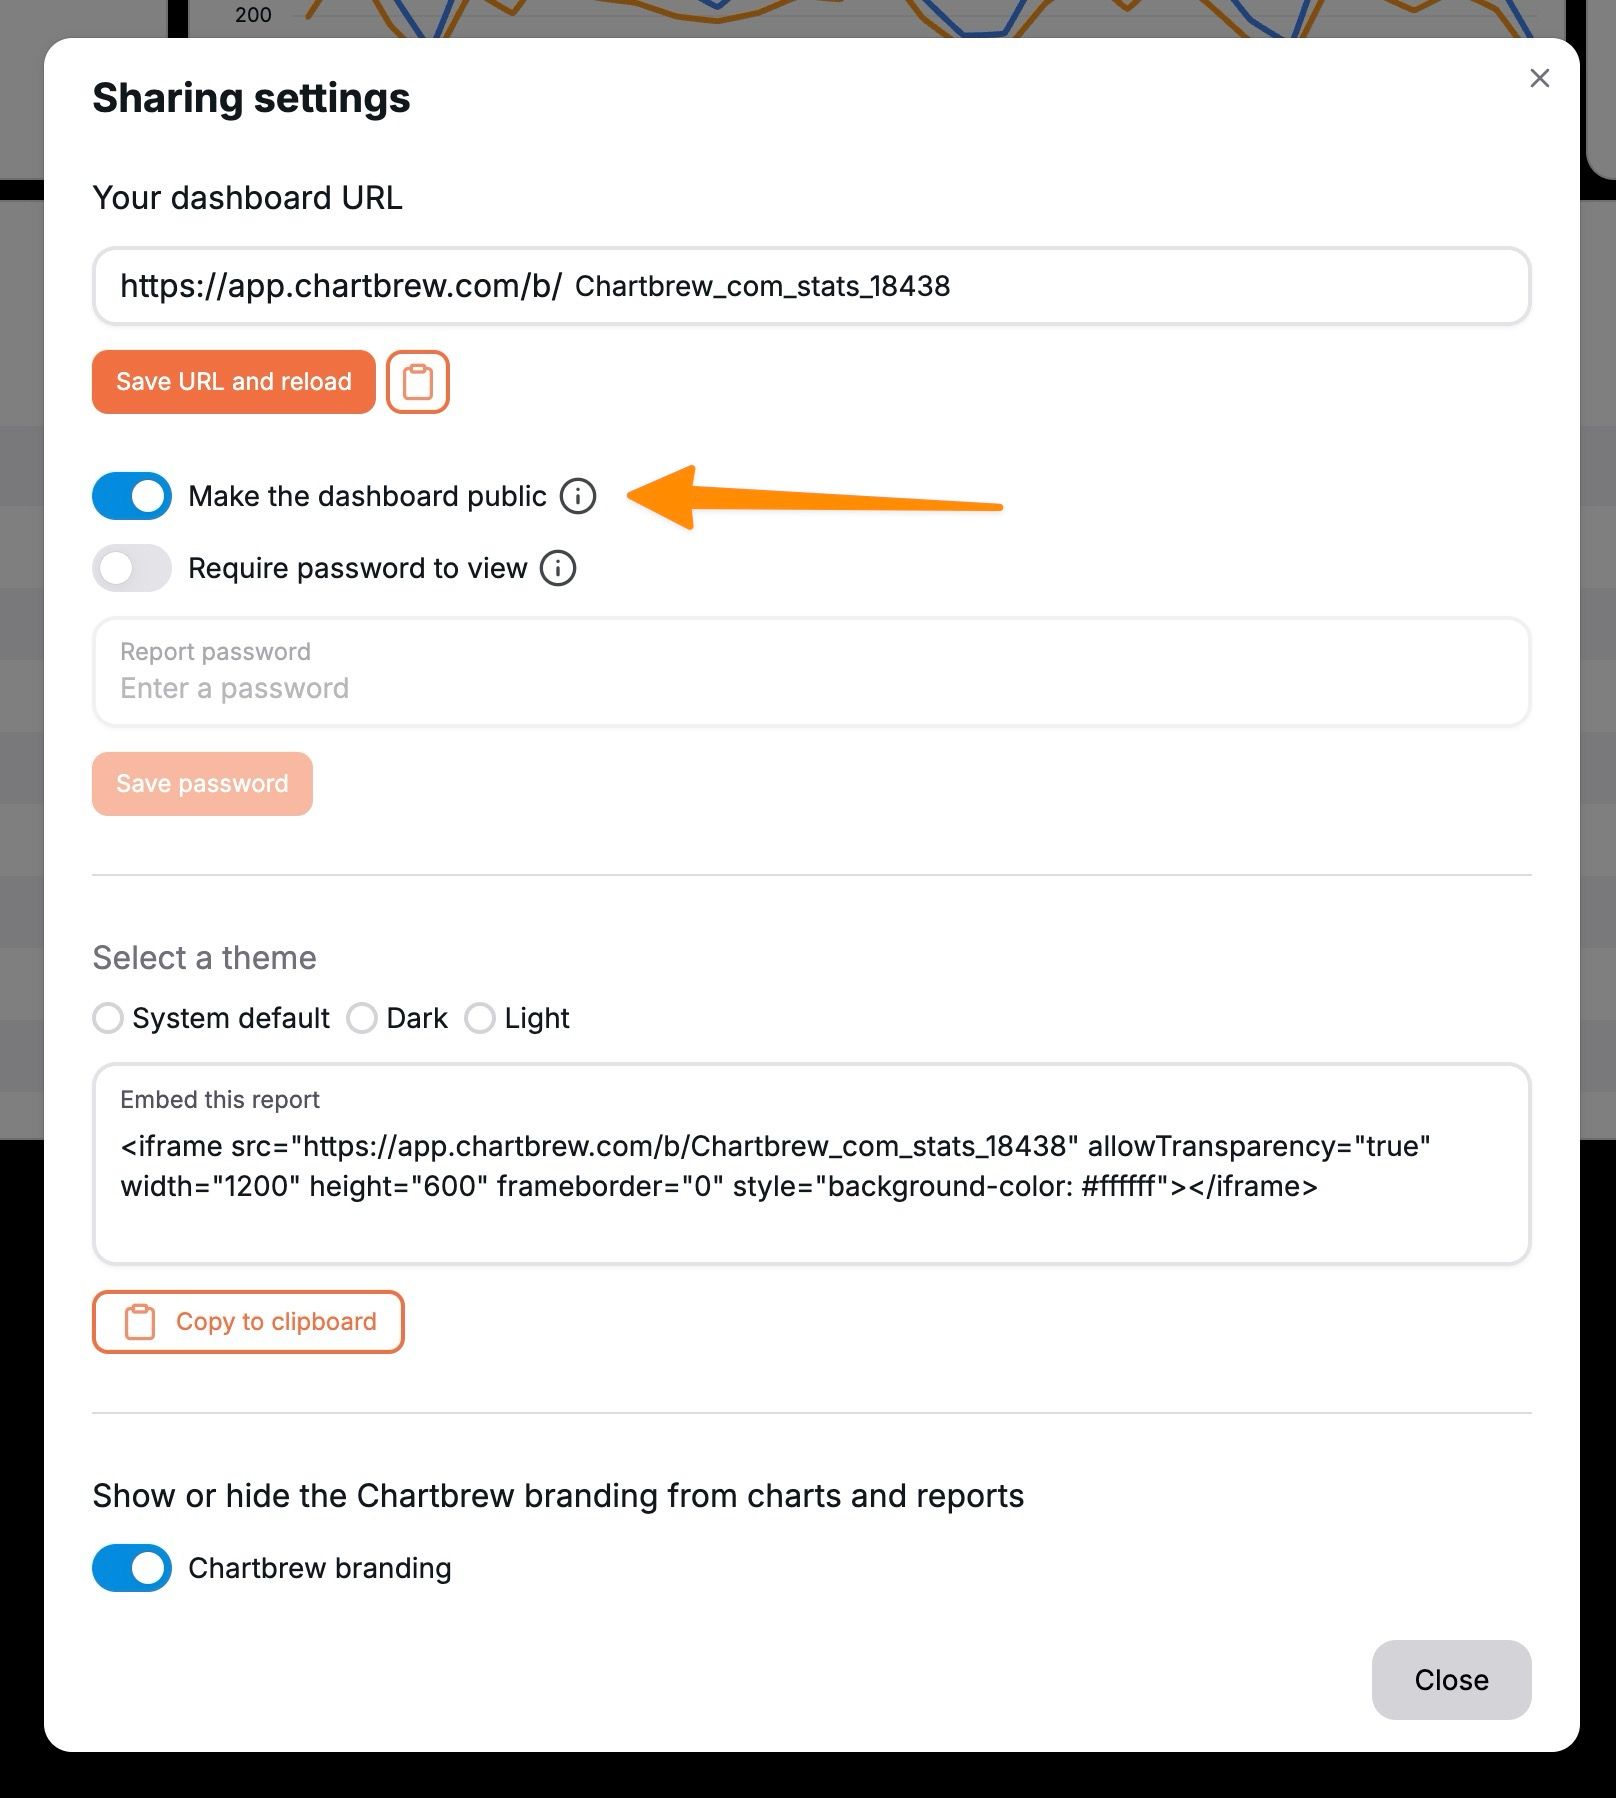
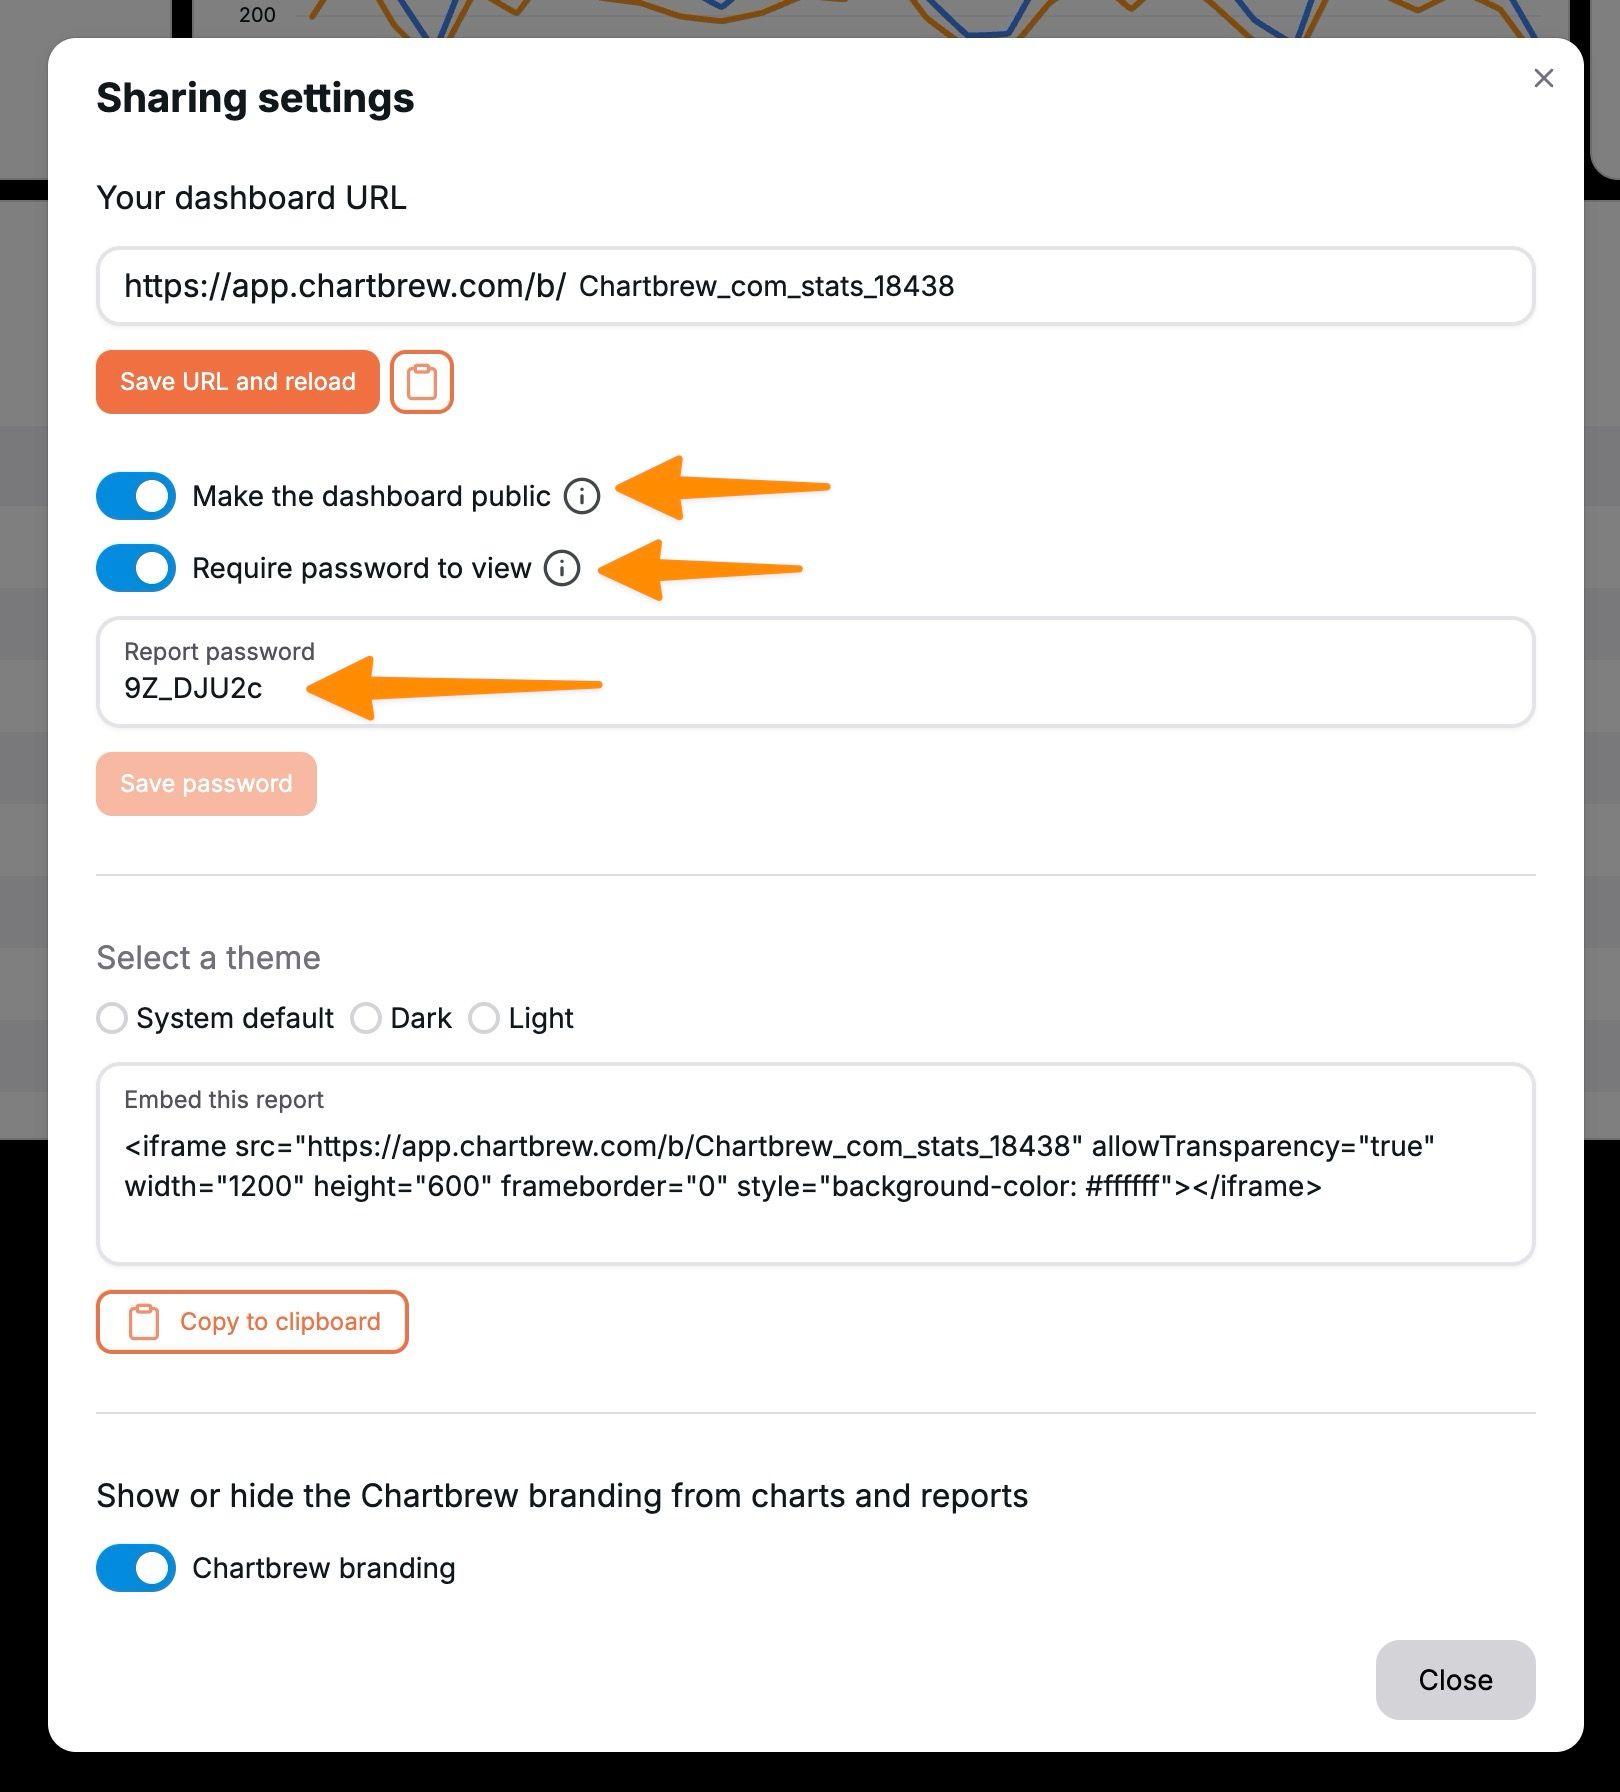
You can access the sharing settings from the top menu. This will open a window where you can change the URL of the report, change privacy settings, get the embedded code so that you can place the report on your website, and show/hide Chartbrew's branding.
To make a report public so that everyone can see it, it's enough to just toggle ON the "Make public" option.
You can add a password to your public report as well. This will ensure that only people who know the password can see the charts.
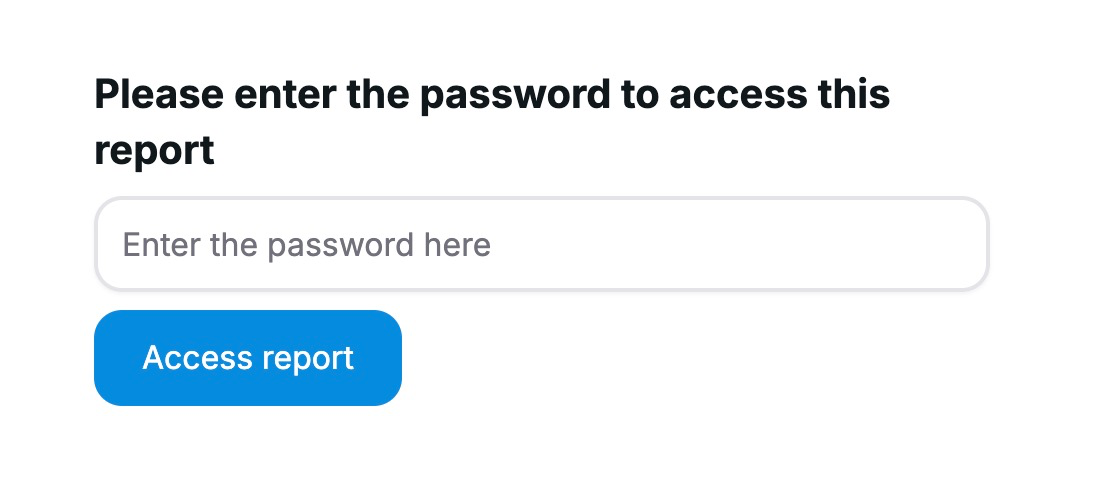
Visitors outside of your team who go to the report URL will now see a window where they have to enter the password.
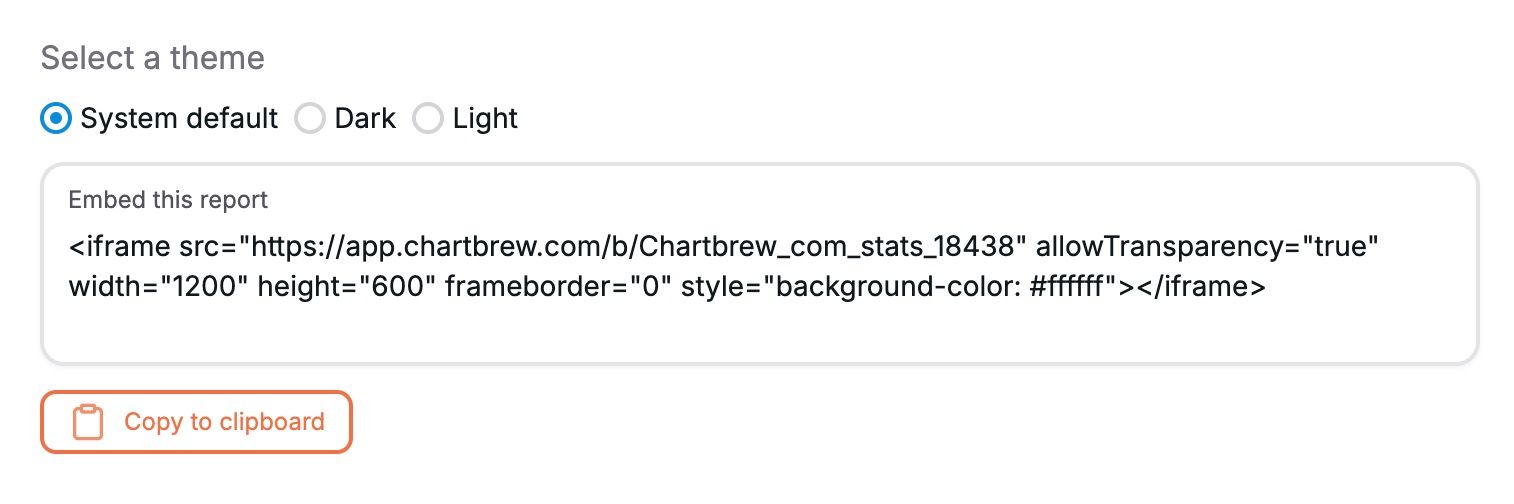
Embed reports on external websites
Last but not least, these reports can be embedded on other websites. You can get the code from the sharing settings window. Copy and edit this code as you see fit and then add it to any website. You can then have an always-up-to-date report without leaving your website. You can also choose what theme the report should use.
To get an idea of how this could look, click on the link below to see this report on a Notion page.
Conclusion
The editor was built to get a custom-looking report up and running quickly. In Chartbrew you can create dashboards with just a few clicks using the templates feature, so it's important to make it as easy as possible to edit and brand the reports. Do you have any suggestions on what to add to the editor next? Feel free to send an email to [email protected] ✌️
Also, if you're feeling adventurous, try adding some animations using the custom CSS feature. Send over your crazy reports on Twitter @chartbrew.
