Export dashboards to Excel sheets
This post will show you how you can connect to multiple data sources and export the data to excel sheets. Supports APIs, databases, Firestore, and more.

Excel workbooks can be a good format to analyze offline or use for reporting over a set period. Chartbrew has built-in functionality that can export your dashboard data from all charts and tables to excel. In this blog post we are going over how to export the data and at different use-cases for this feature.
How to export a chart or table to Excel
You can export individual charts and tables from the Dashboard Editor. Any type of chart can be exported because Chartbrew uses the response data from your data sources to build the excel export.
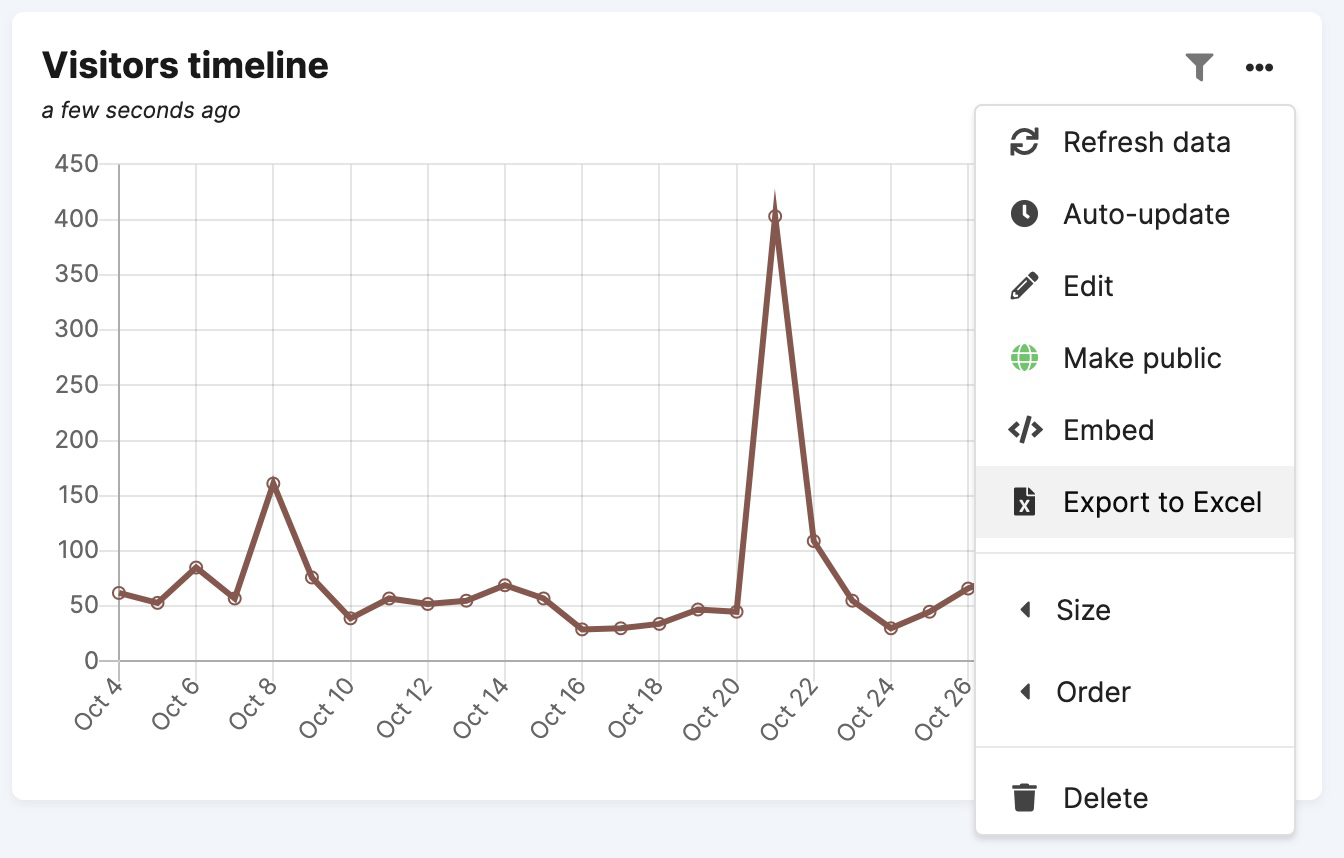
To start the export, you can head over to any of your dashboards, open the chart settings and select "Export to Excel" from the list.
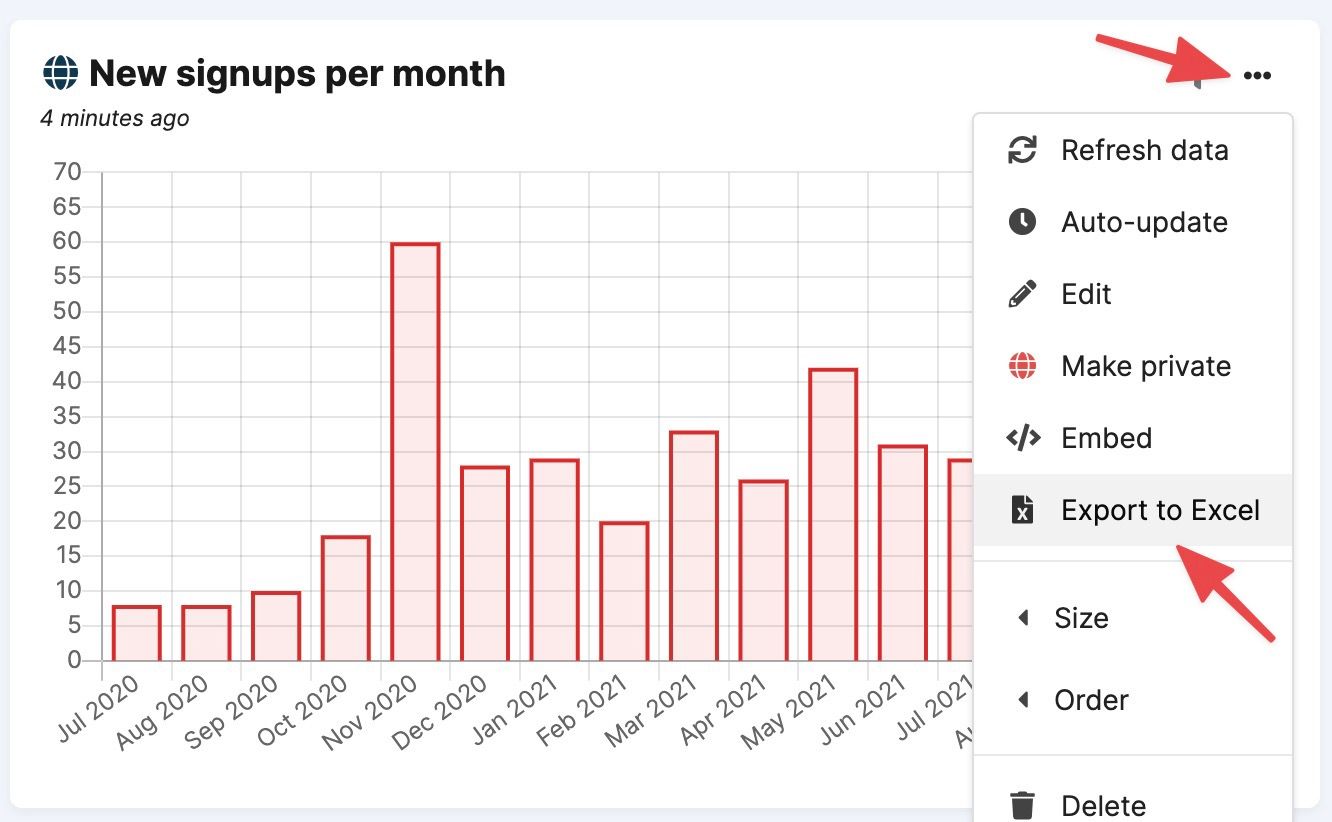
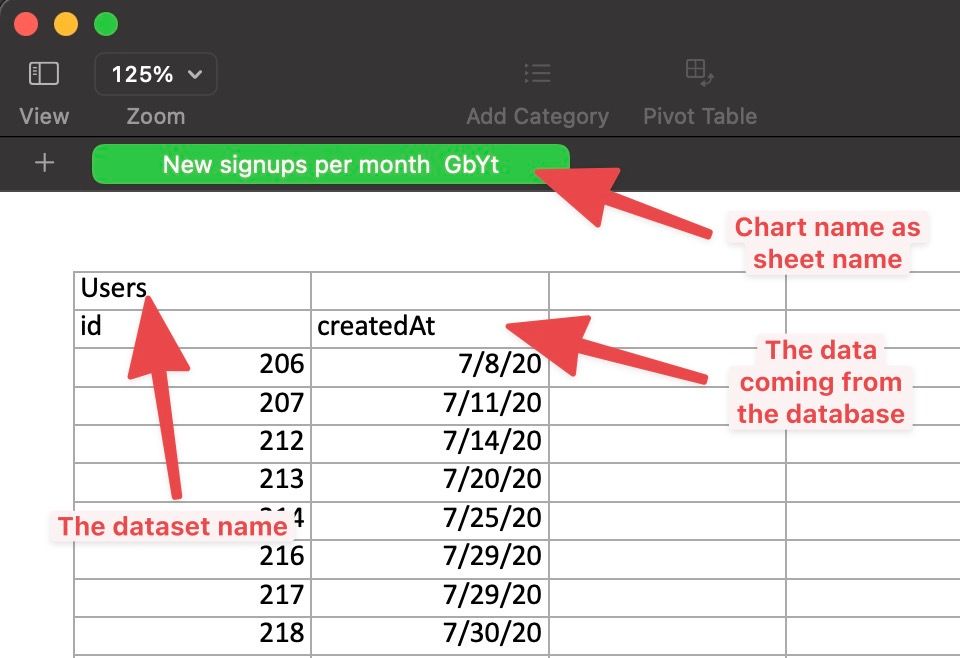
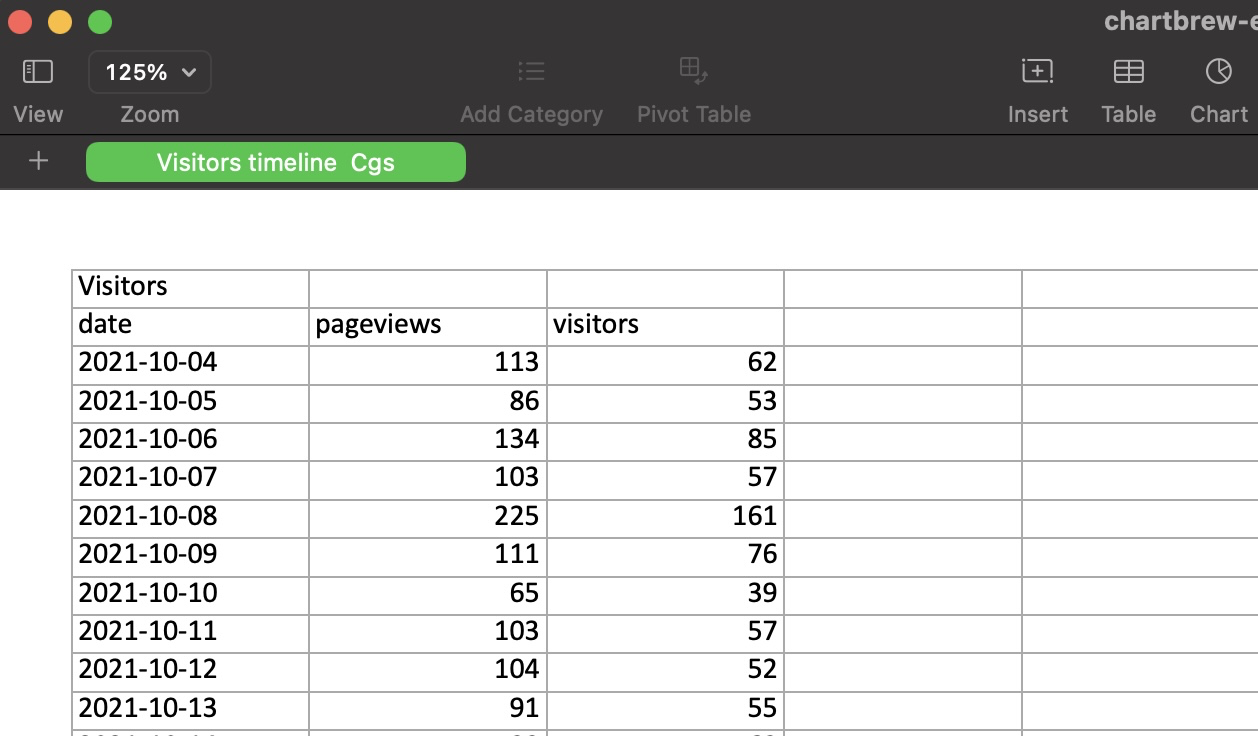
This operation will download a .xlsx file that contains a sheet with the name of the chart, the dataset name, and the data coming from the data source. Check the example below:
How to export a dashboard to Excel
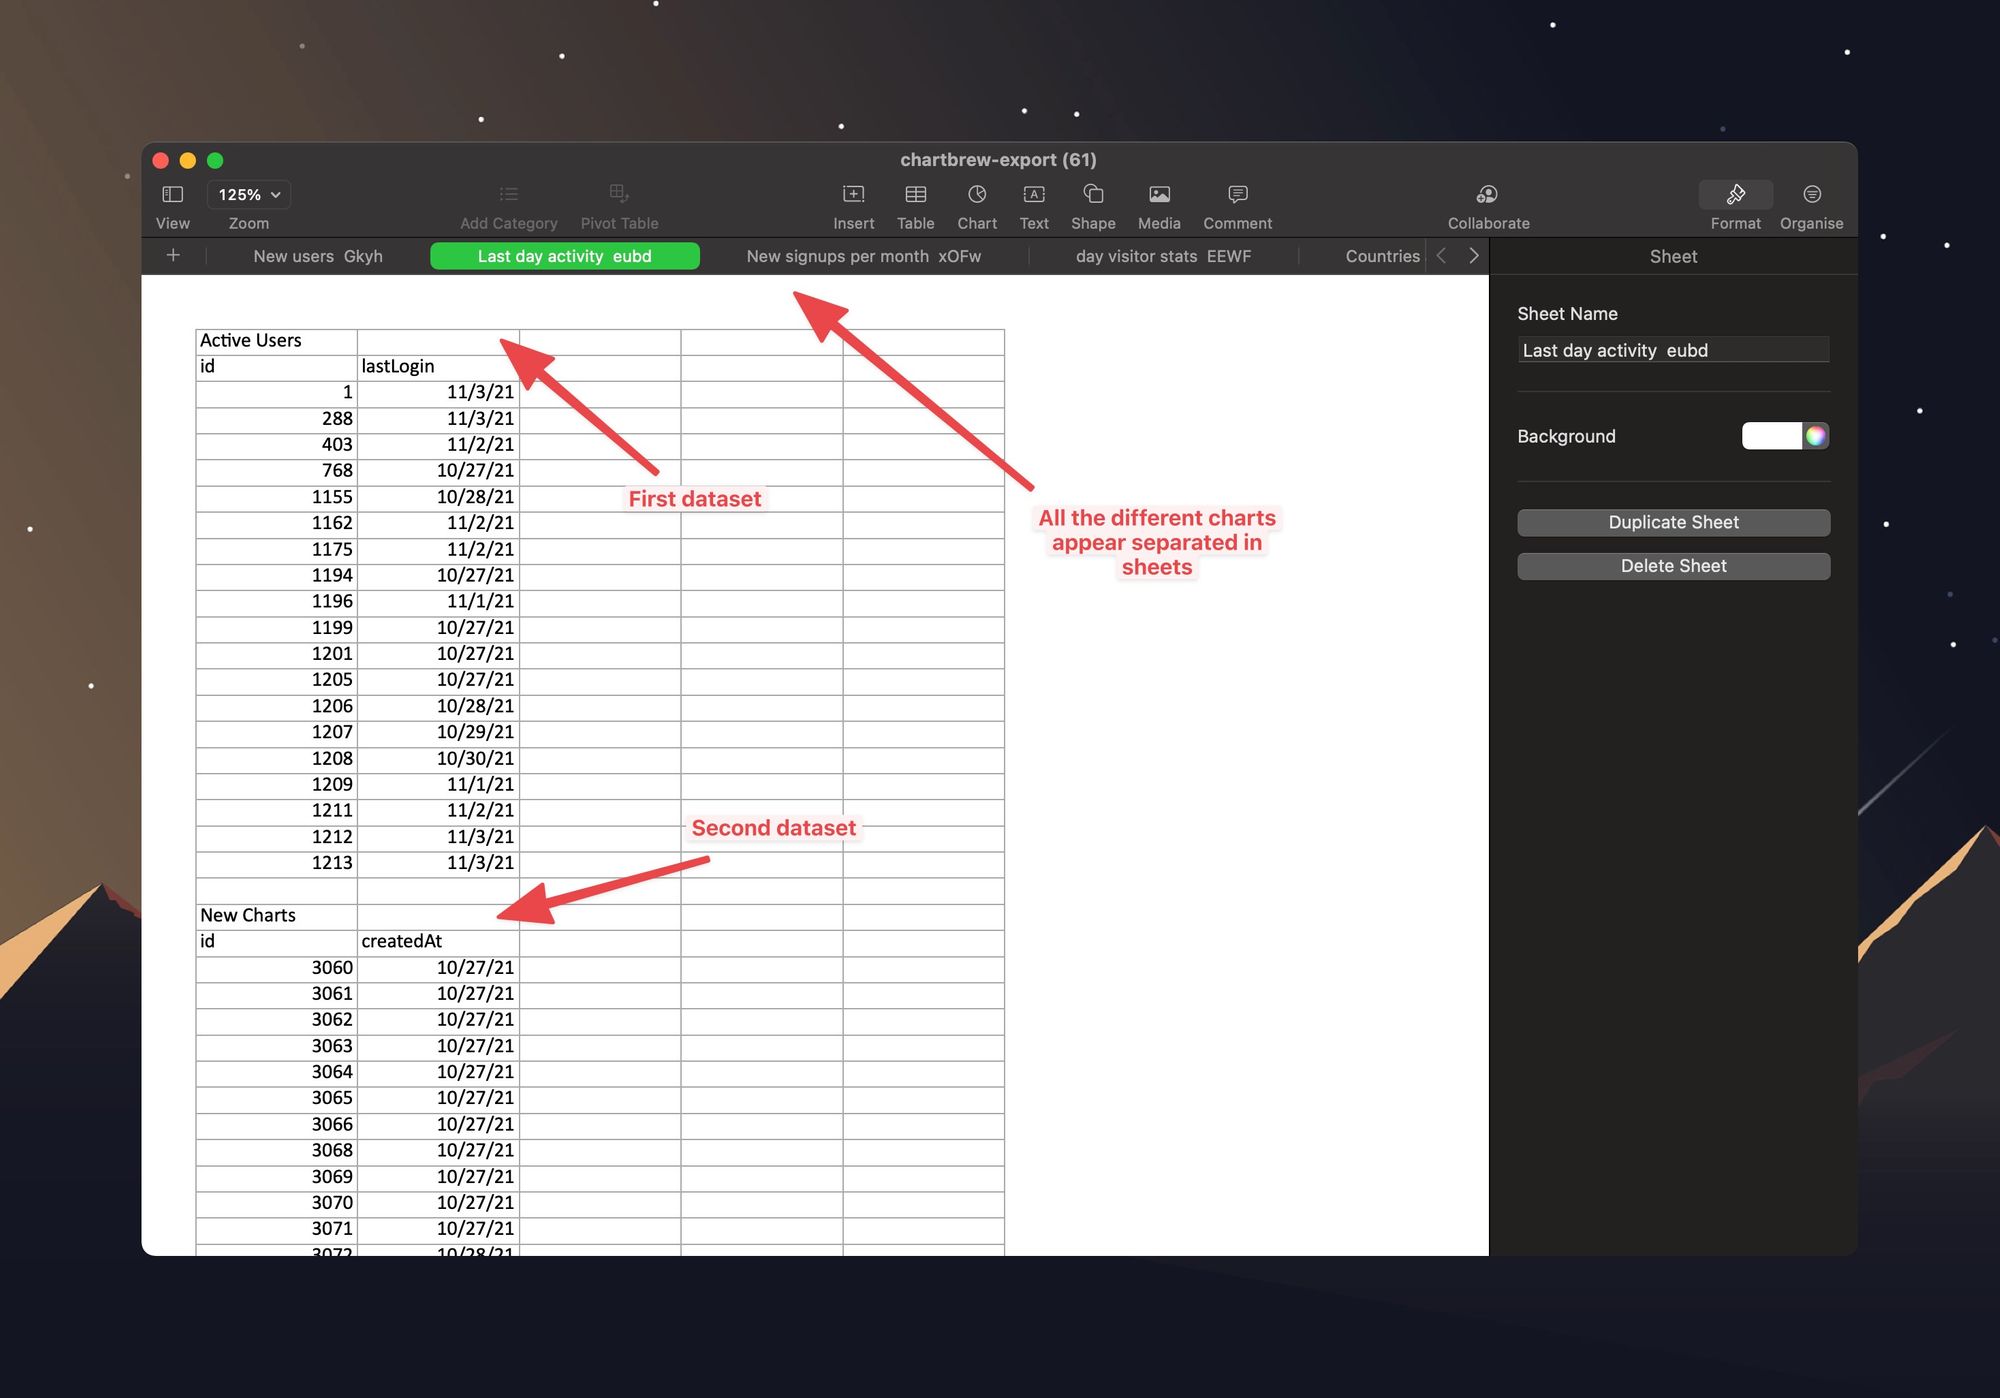
What makes Chartbrew even better is that it can export an entire dashboard to a single Excel workbook. This means that the workbook will have a separate sheet for each chart and table on the dashboard, and each sheet will contain the datasets and data tables from each chart.
You can start the export from your dashboard, but in this case, click on the export button in the top toolbar.
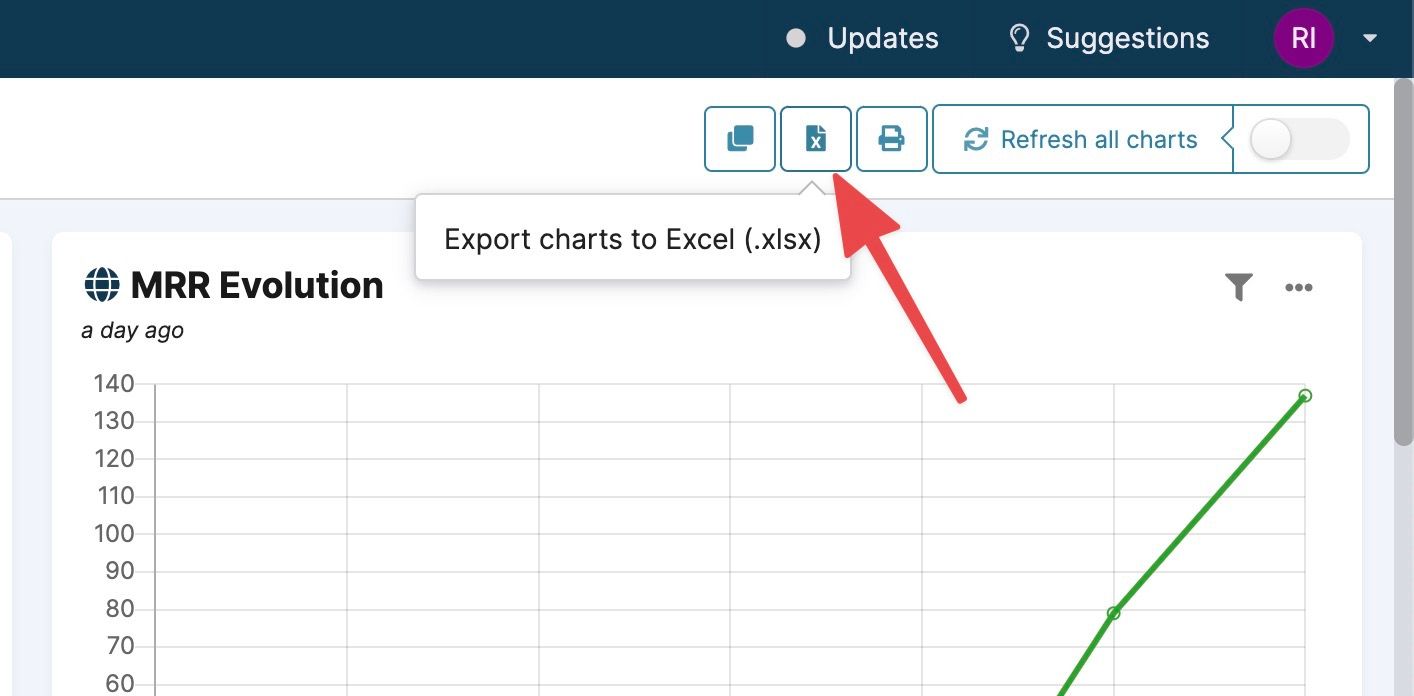
This button will display a modal that lets you choose which charts you want to include in the export.
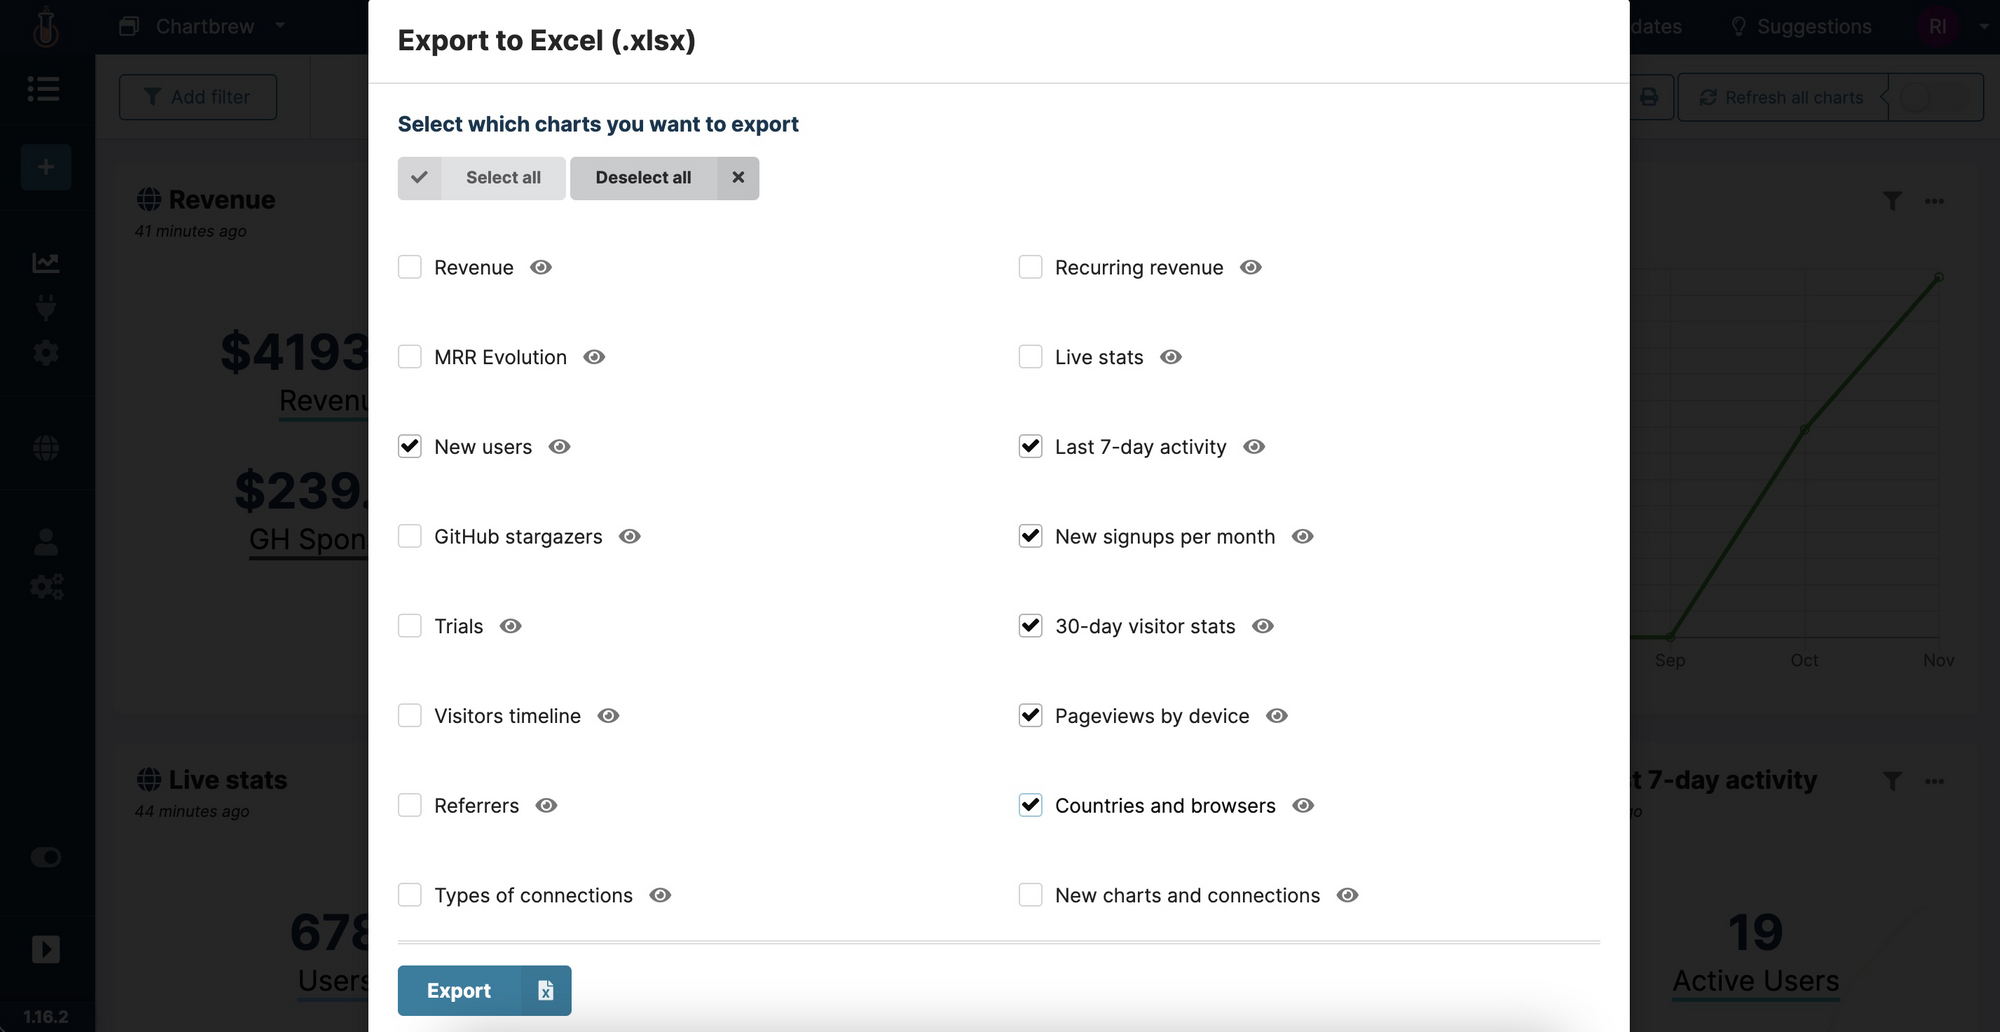
The exported file will have all the chart data you selected in the modal. Take a look below at how the export looks like and how it's structured:
Next, we are going to look at some use-cases for the export feature. On top of exporting regular reports from dashboards, the export can be used just to get a data source response in Excel-readable format.
Export any API response to Excel
Since Chartbrew can connect to most REST APIs out there, it's also possible to use Chartbrew to export this data to Excel. You can connect to the API, make the request, and then Chartbrew will transform the JSON response to .xlsx.
Let's try an example with visitor data from Simple Analytics. You can follow the steps to connect to the API and try out the export feature as well.
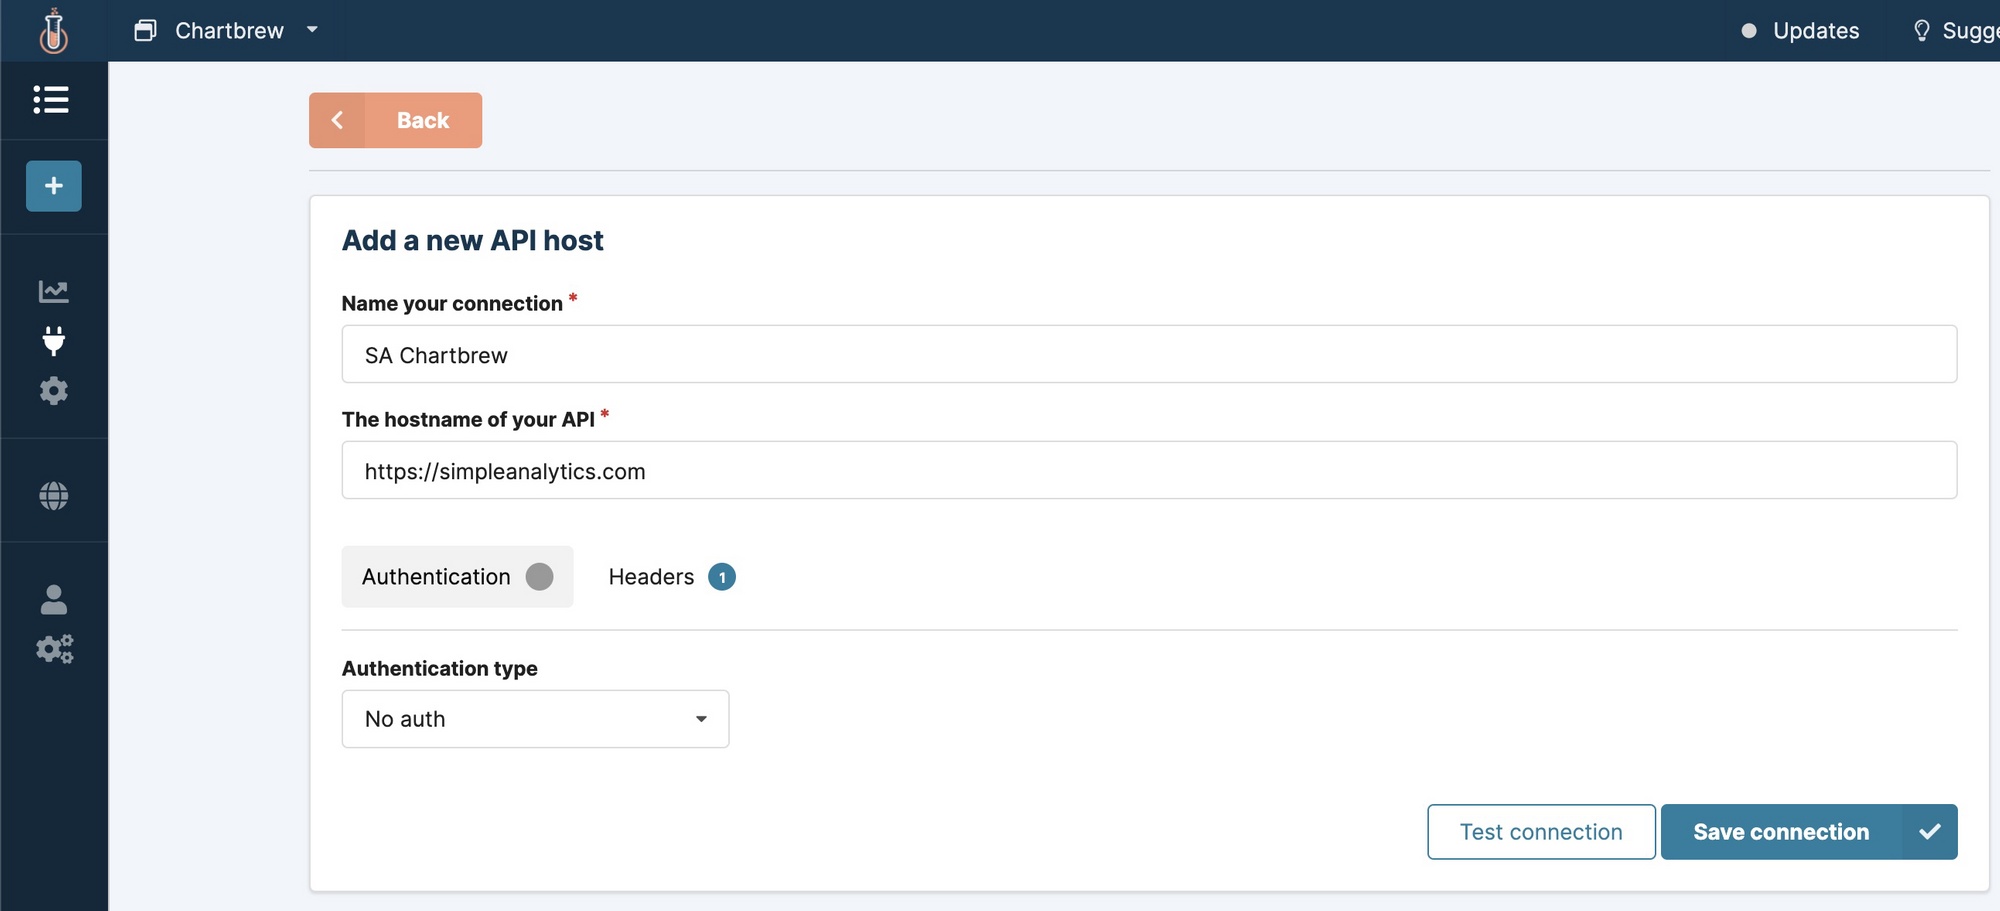
First, create a new API connection with https://simpleanalytics.com as the hostname.
Then, click to create a new chart to connect it to this API and get some data.
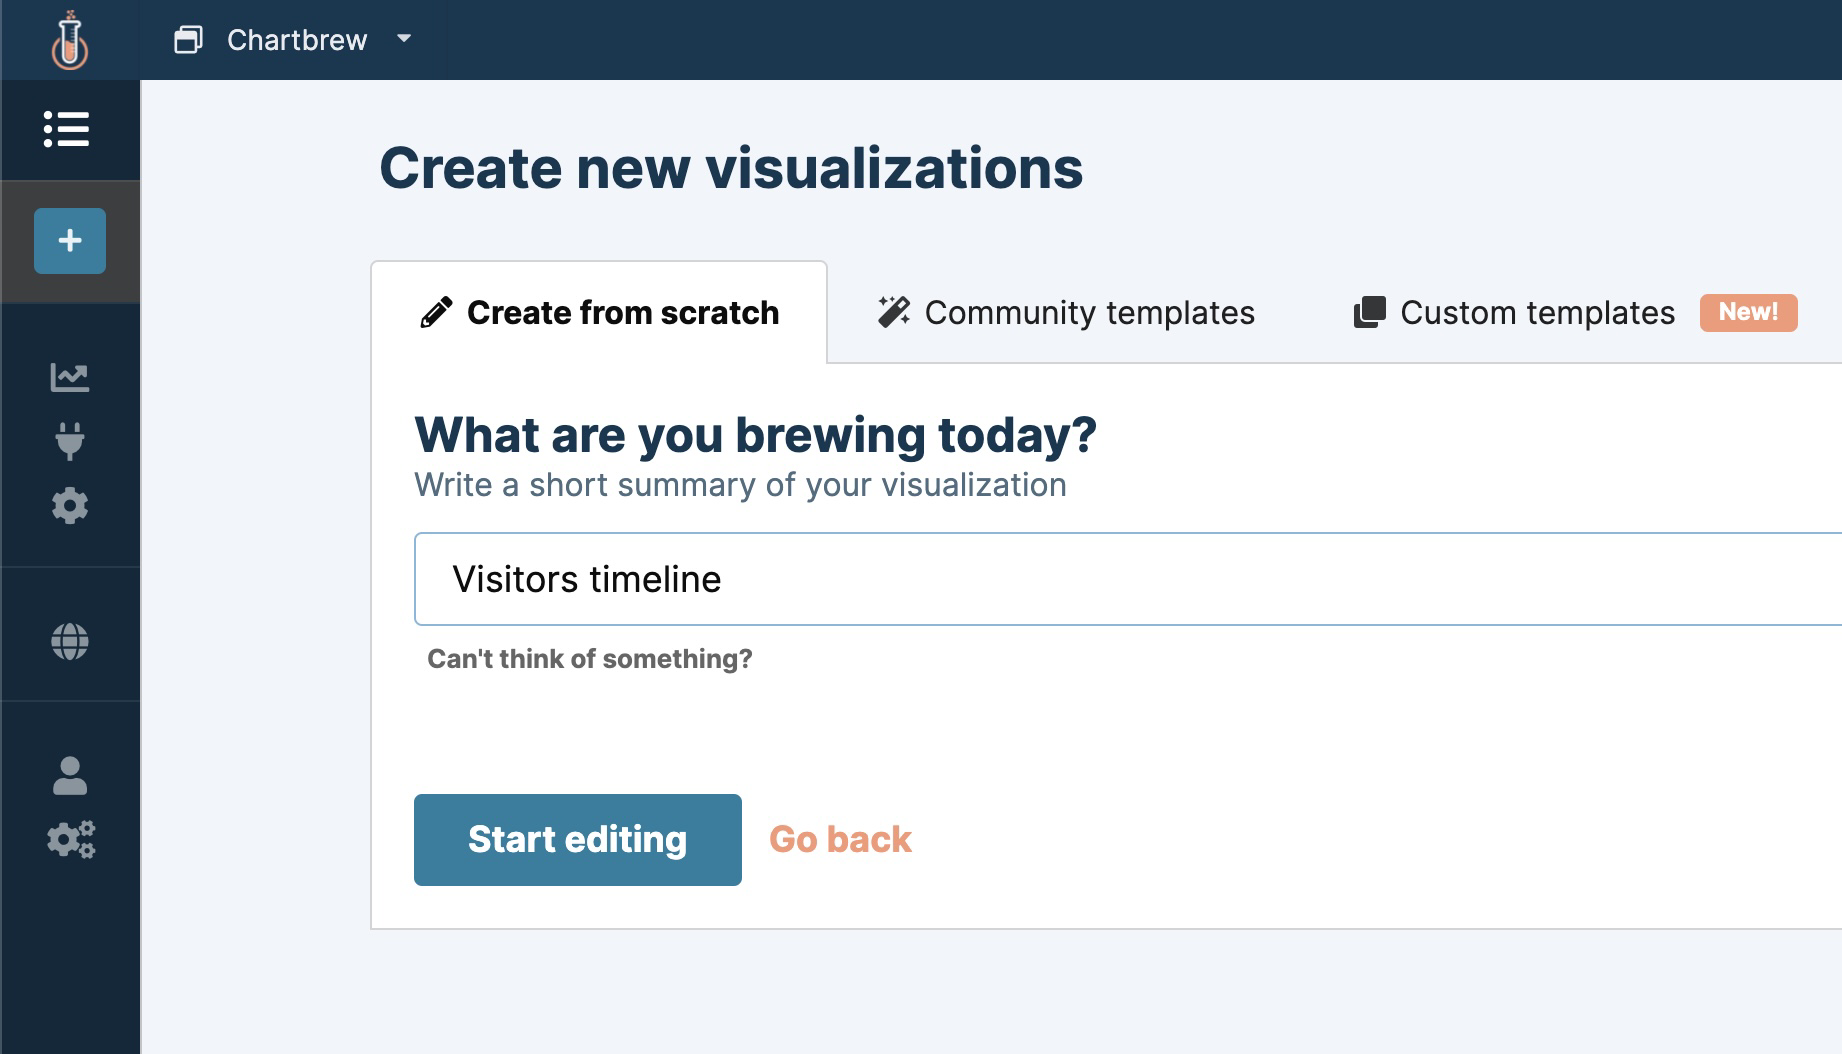
When you get to the editor page, create a new dataset and name it "Visitors". Then you can select the "SA Chartbrew" connection we just created. Next, we proceed to build the API call to fetch the data.
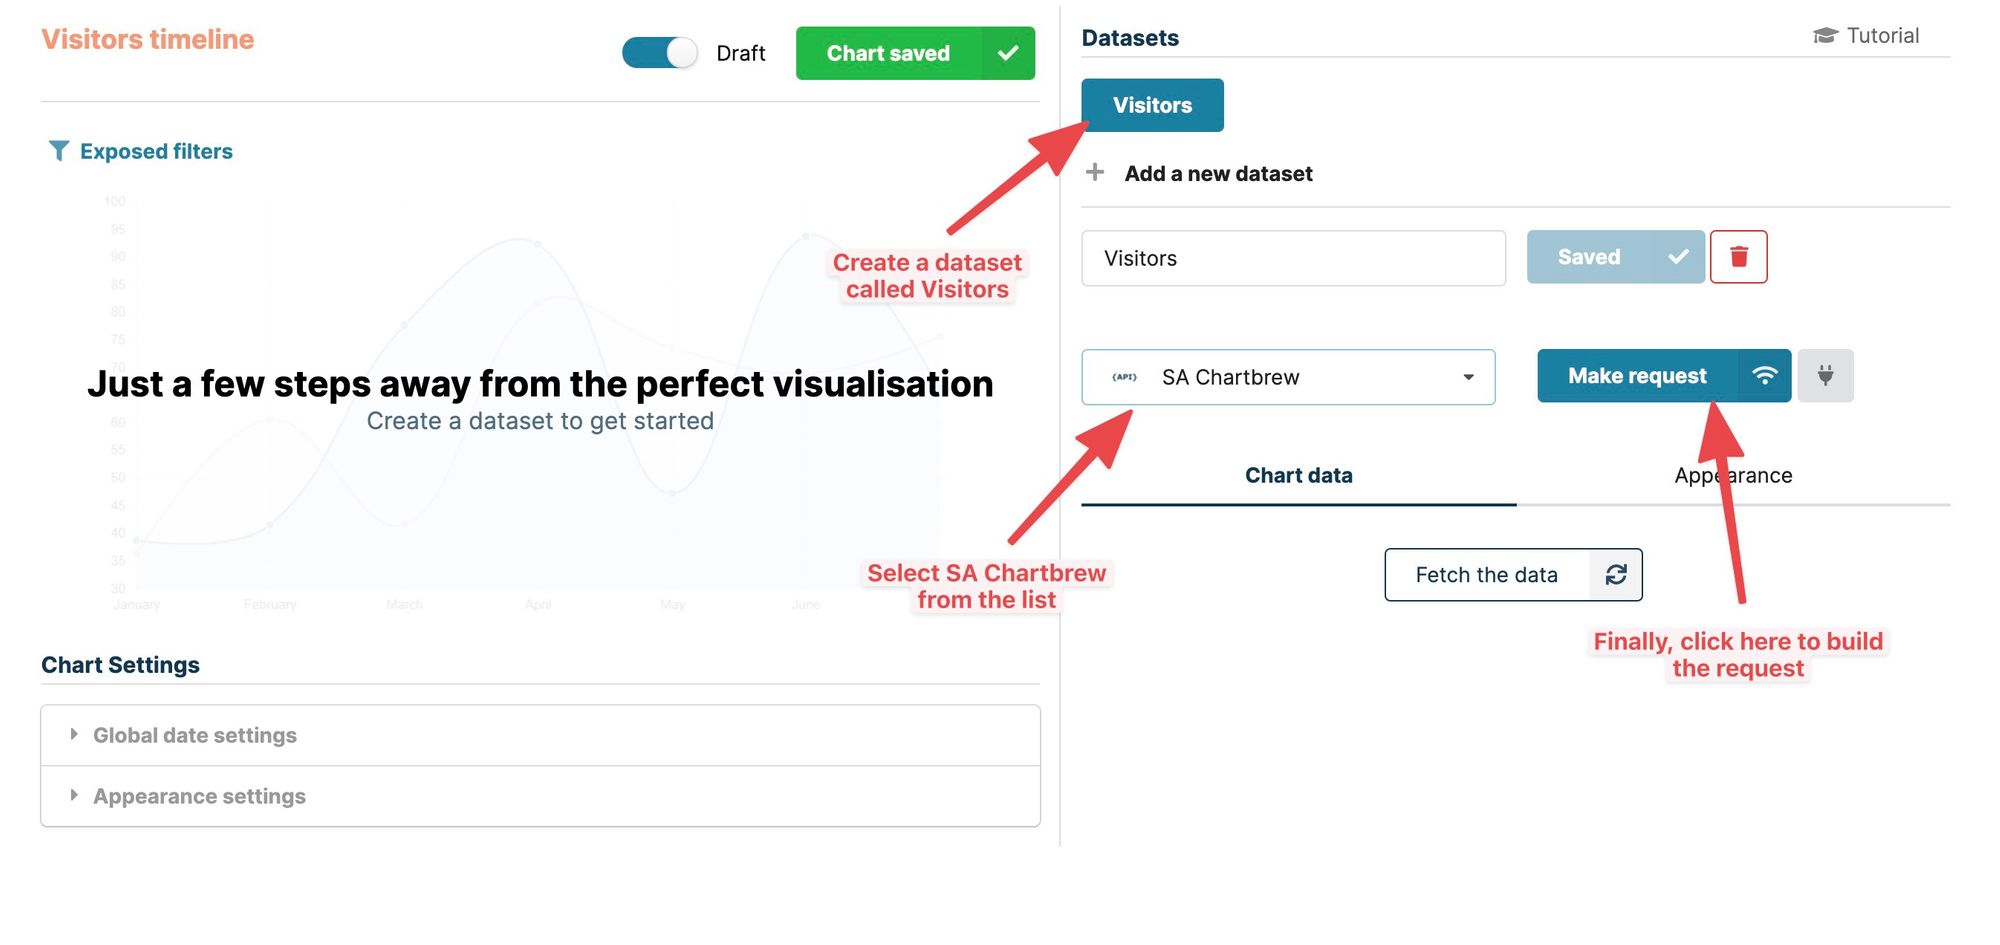
When you click the "Make request" button, you will see a modal with the API query builder. Enter the following route in the top field and run the request.
/chartbrew.com.json?version=5&fields=histogram
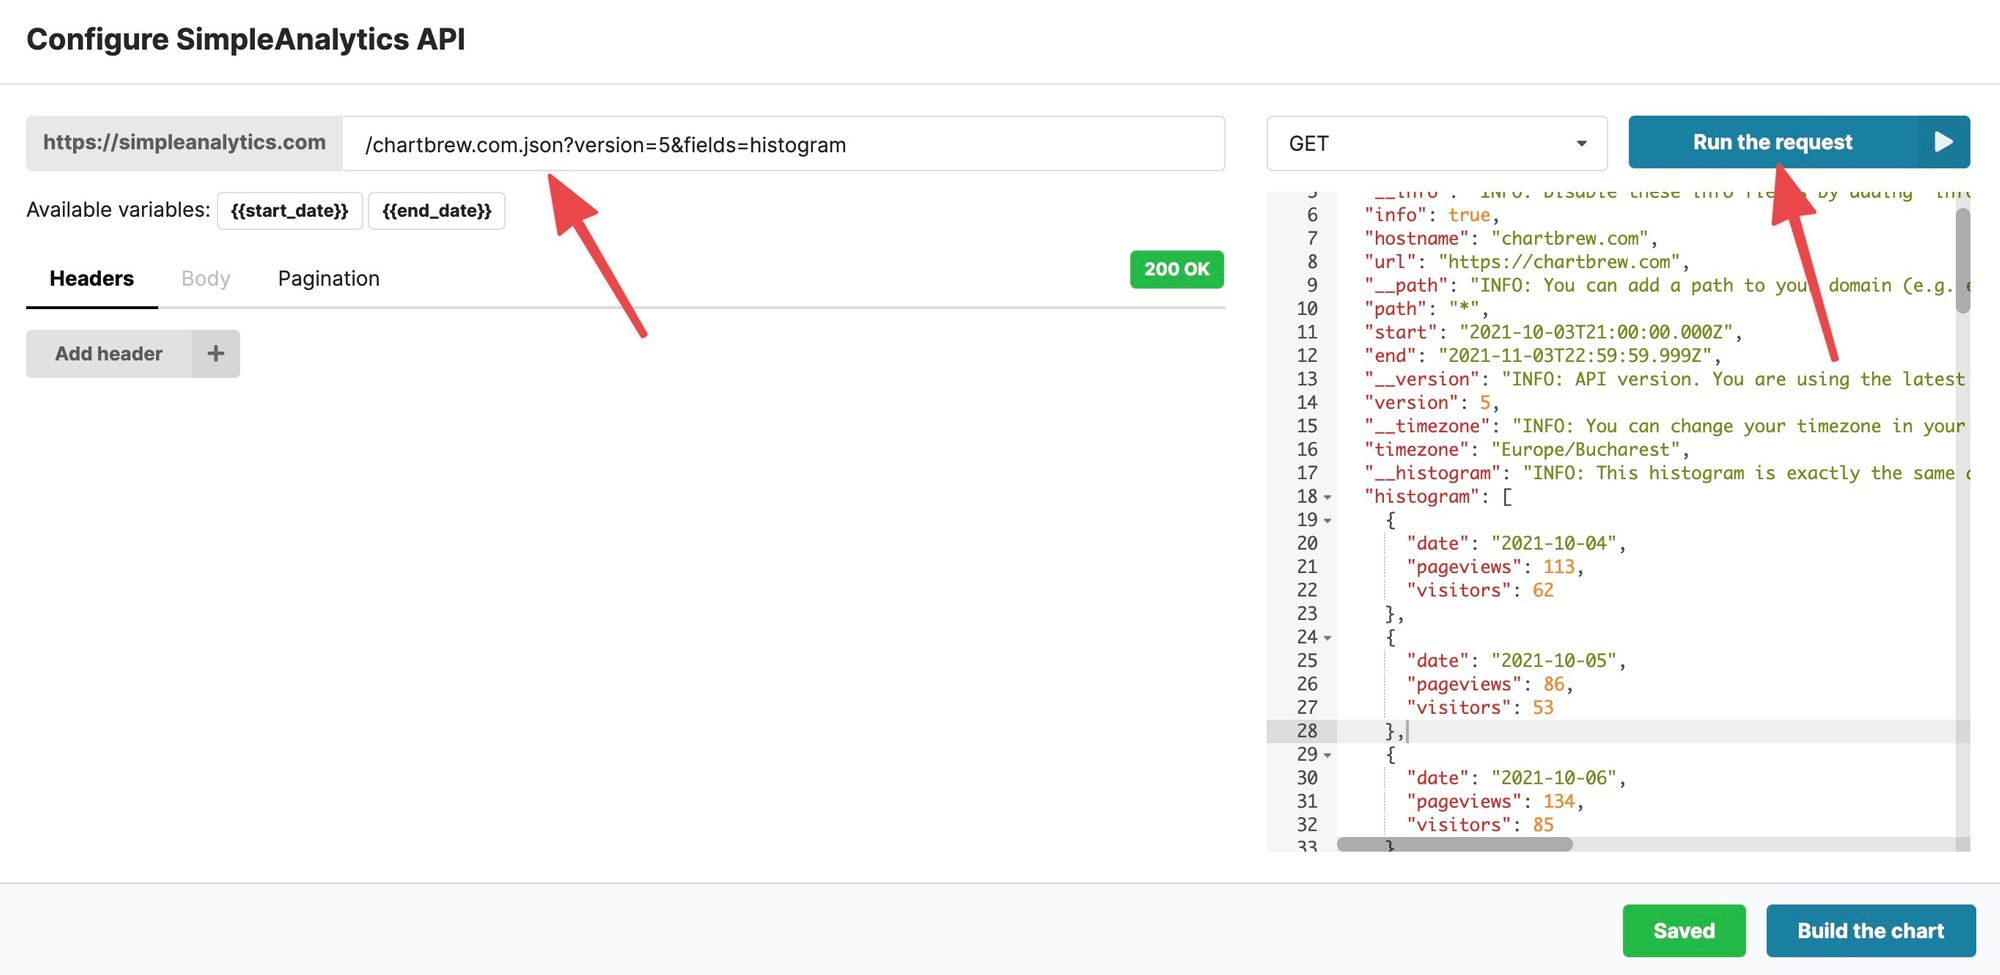
This API response we get here will be used to build a time series chart, but it can also be exported to an Excel sheet. Click on the "Build the chart" button and then configure the chart like in the screenshot below:
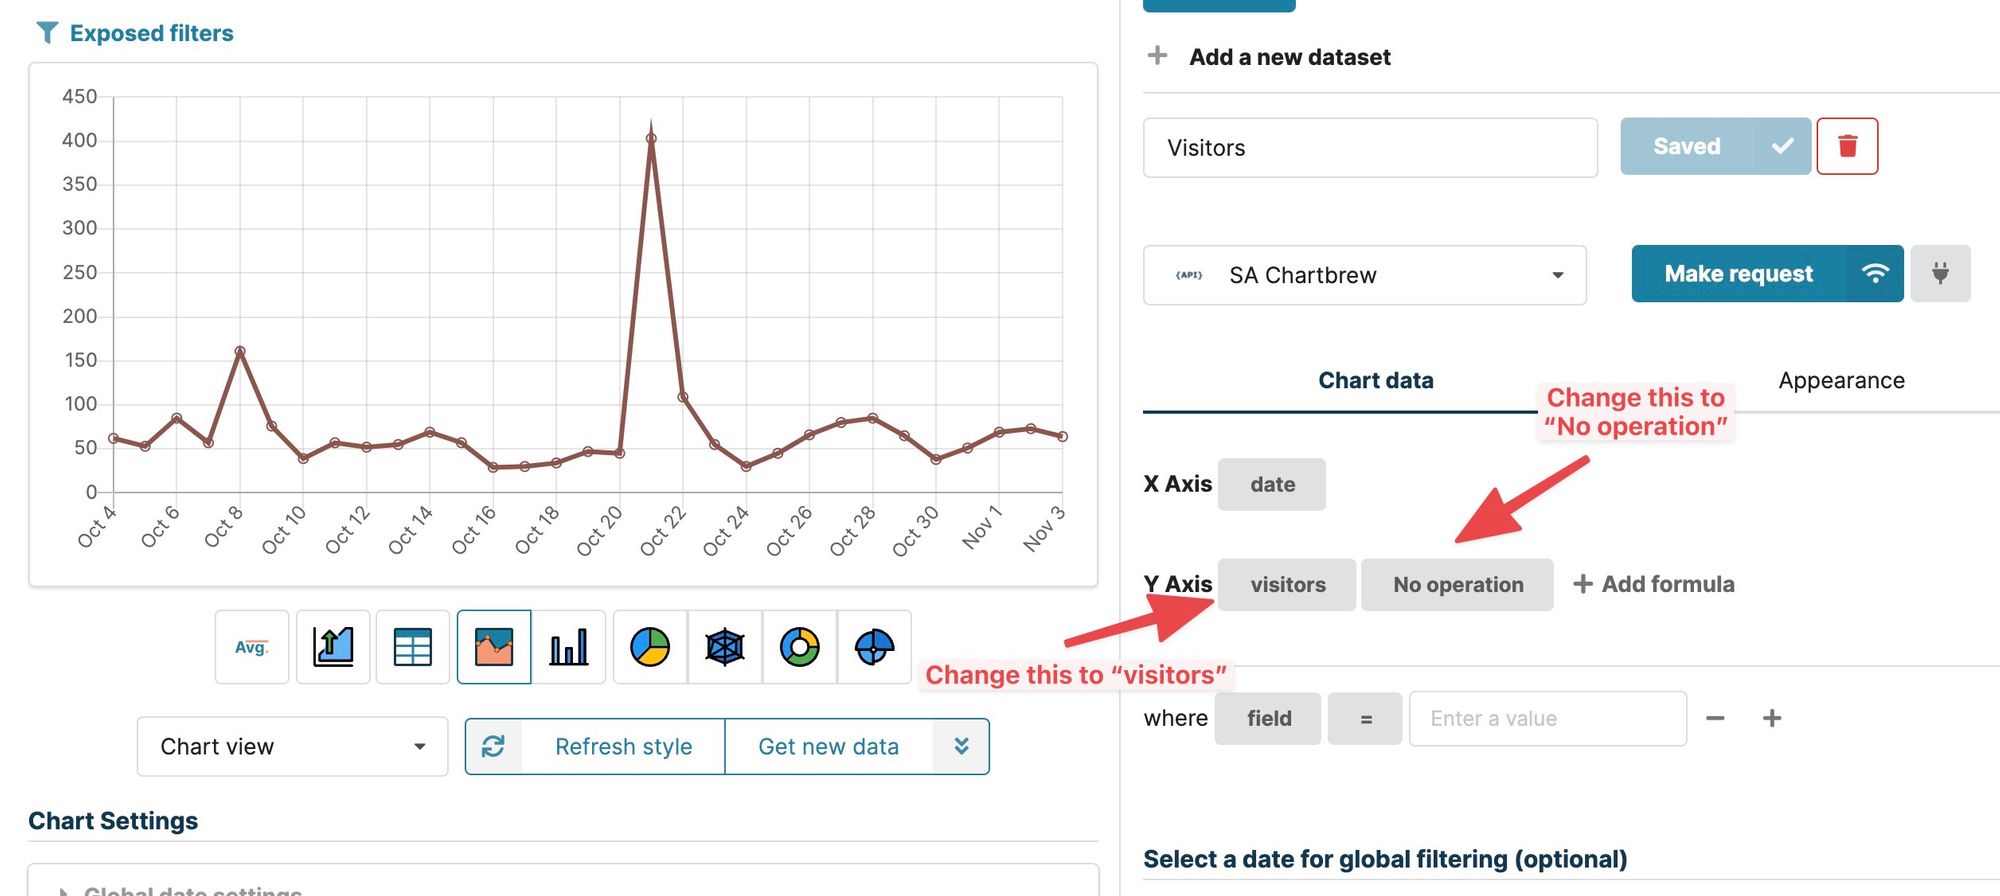
Now if you go back to the dashboard you will see your newly created chart. You can now export the data as shown above. Click on the chart settings and then select "Export to Excel" from the list.
Export SQL queries to Excel
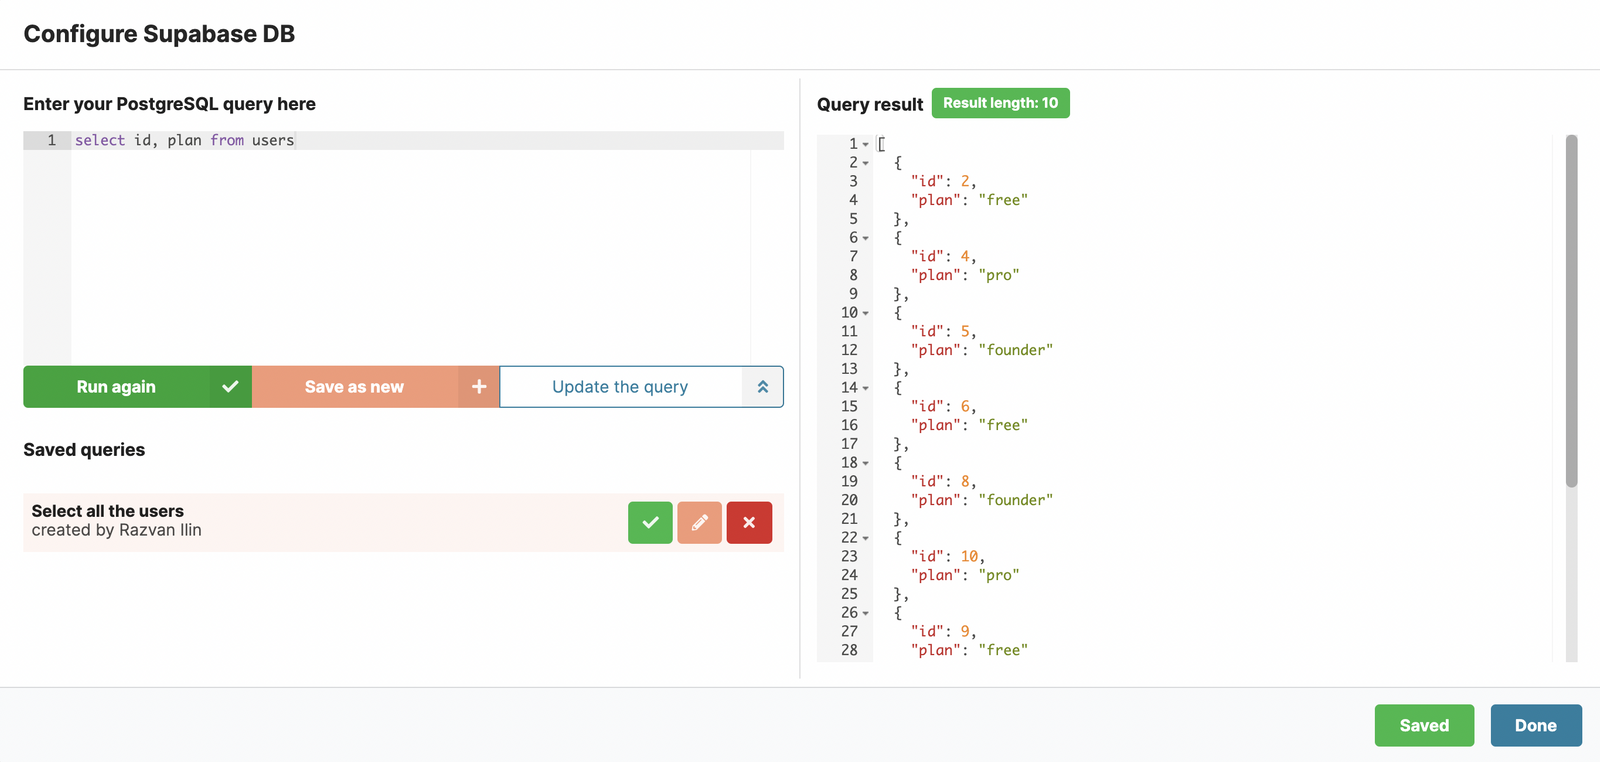
Another use-case for this feature is to export SQL queries to Excel. Similarly, with how the API connection works, you can connect to a MySQL or PostgreSQL database and then export data at any time from your dashboard.
This post will not go through the connection process, but you can see how to connect to a PostgreSQL database here.
Once you are connected, you can create a new chart and instead of building an API request, you can write SQL queries directly in the interface.
You can then export the data from the dashboard as shown before.
Export MongoDB documents to Excel
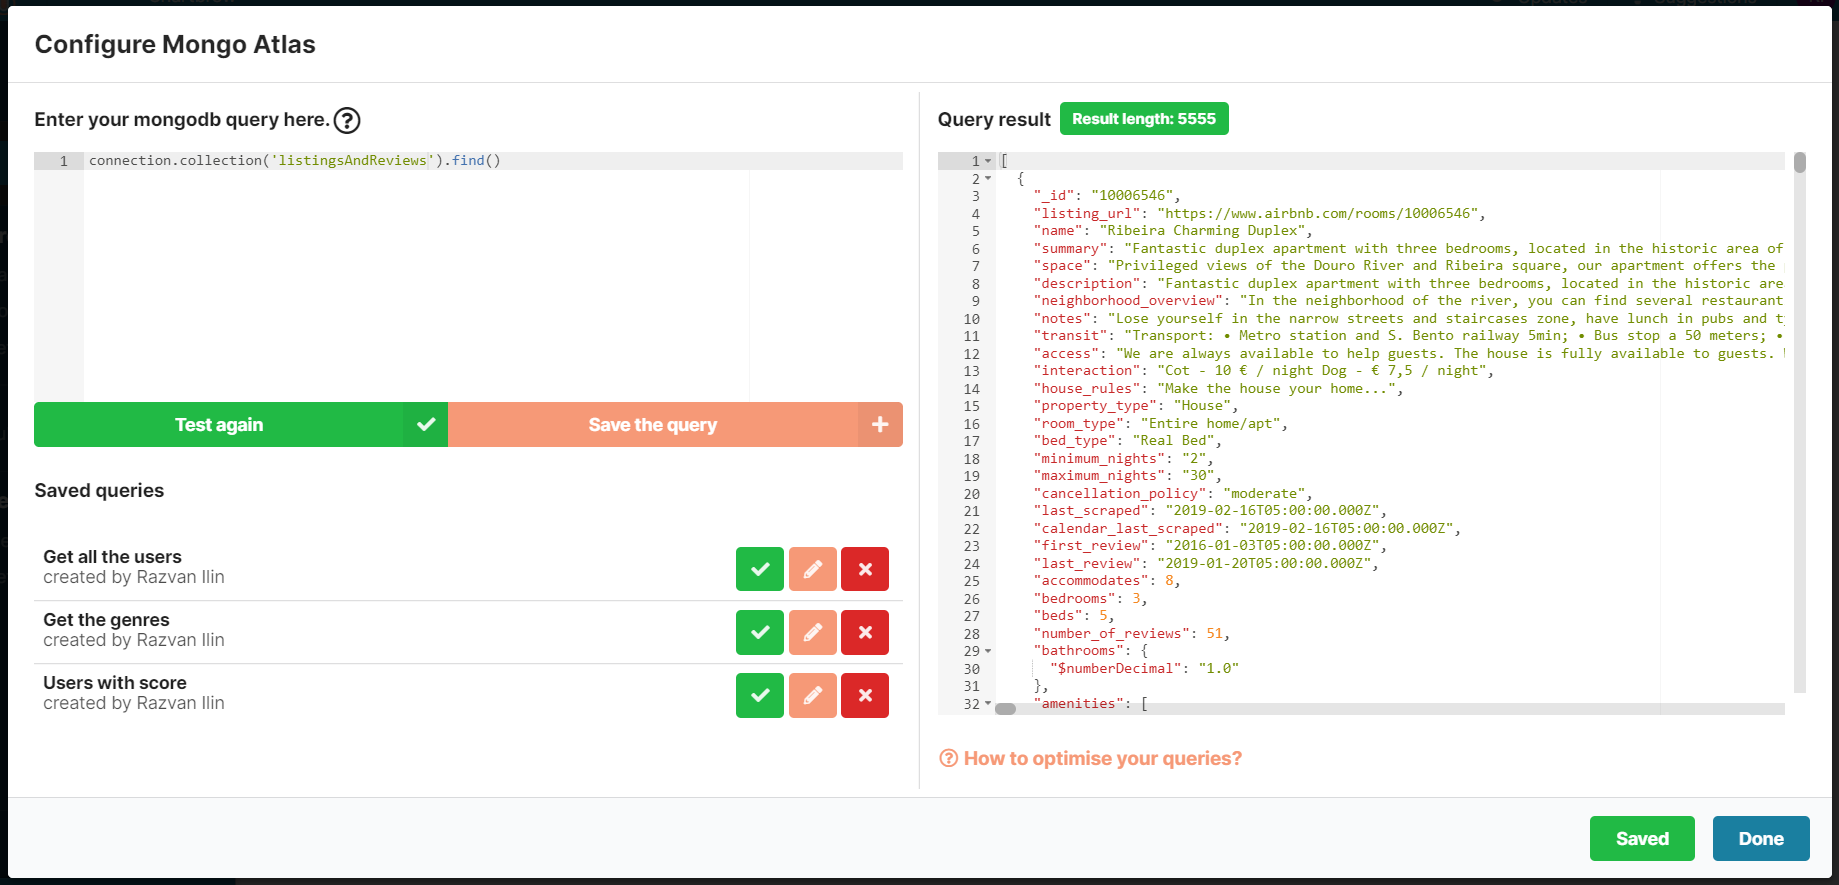
There is no straightforward way to export MongoDB data to excel for reporting. In Chartbrew, you can export your data in just a few clicks. Click here to see how to connect and create charts from a MongoDB database.
Similar to MySQL and PostgreSQL, Chartbrew allows you to write queries to fetch the data and then export the data from your dashboard.
Export Firestore collection data to Excel
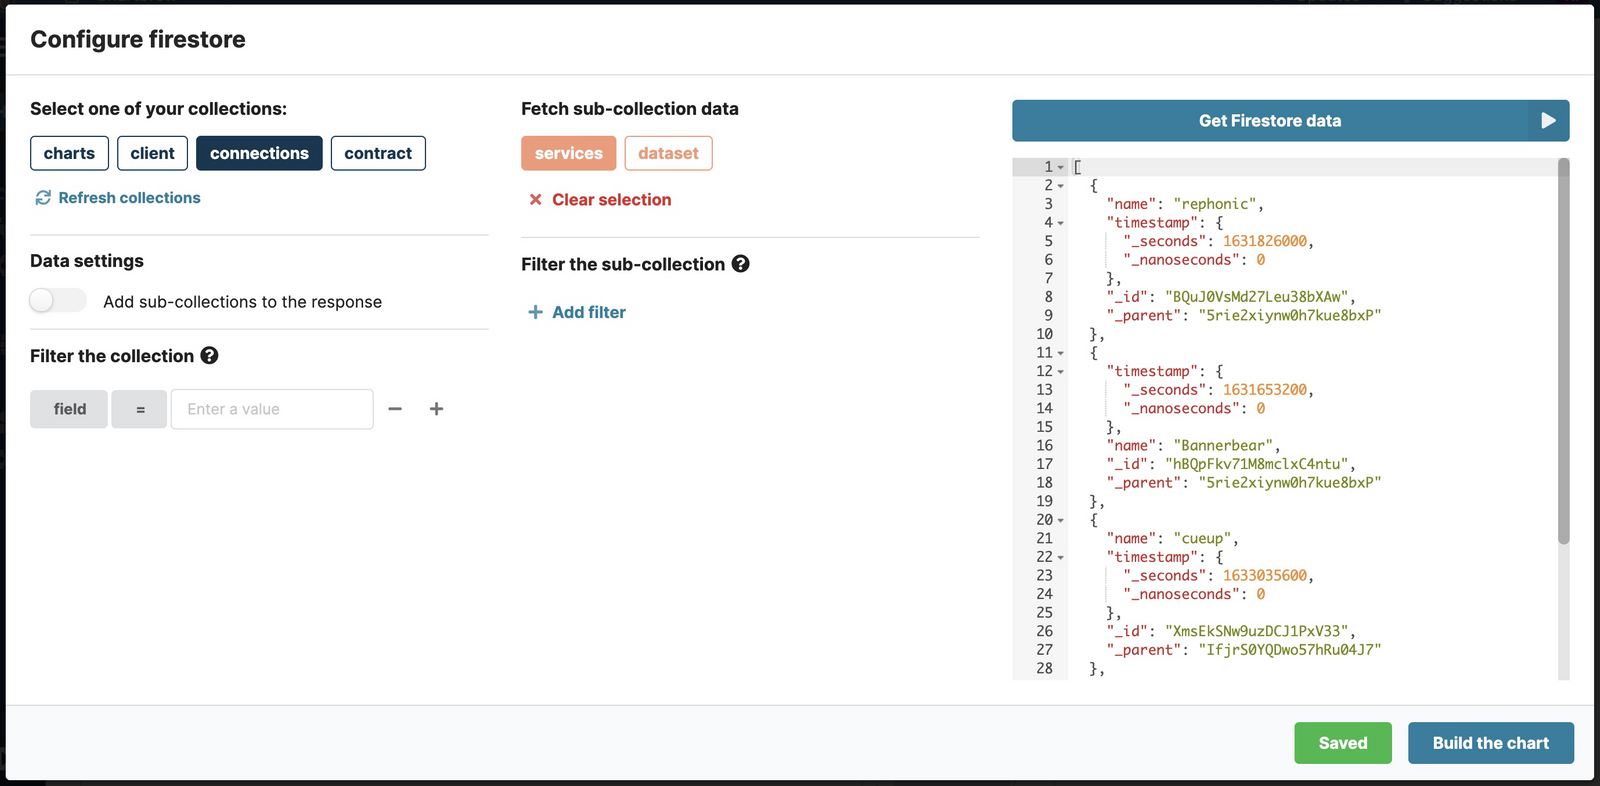
Chartbrew supports Firestore connections and this means you can also export Firestore collections to Excel. To see an in-depth tutorial on how to connect and create charts from Firestore, click over here.
Chartbrew features a no-code UI for fetching the data. You can browse your collections and sub-collection, as well as filter the data. Using this data, you can then create a chart and export the data to Excel as in the other examples.
Restrict/Allow team members to export charts
Some of these exports can include data that is not visible on the charts. For example, a time series uses two different fields: one for the X-Axis and one for the Y-Axis. The data coming from one of your connections can have multiple fields and the export includes these as well.
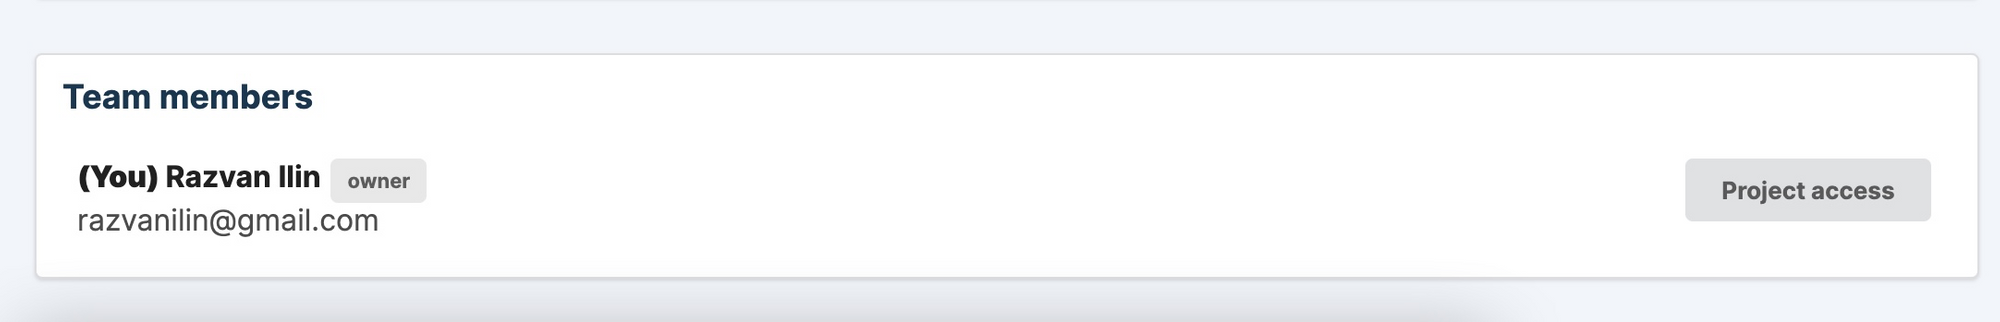
Sometimes, this data is sensitive and you might not want all your team members or clients to see this. From the team settings menu, you can configure if new users can export data or not. If the user is already part of the team you can also toggle the export by configuring the project access.
Configure which charts show for bulk exports
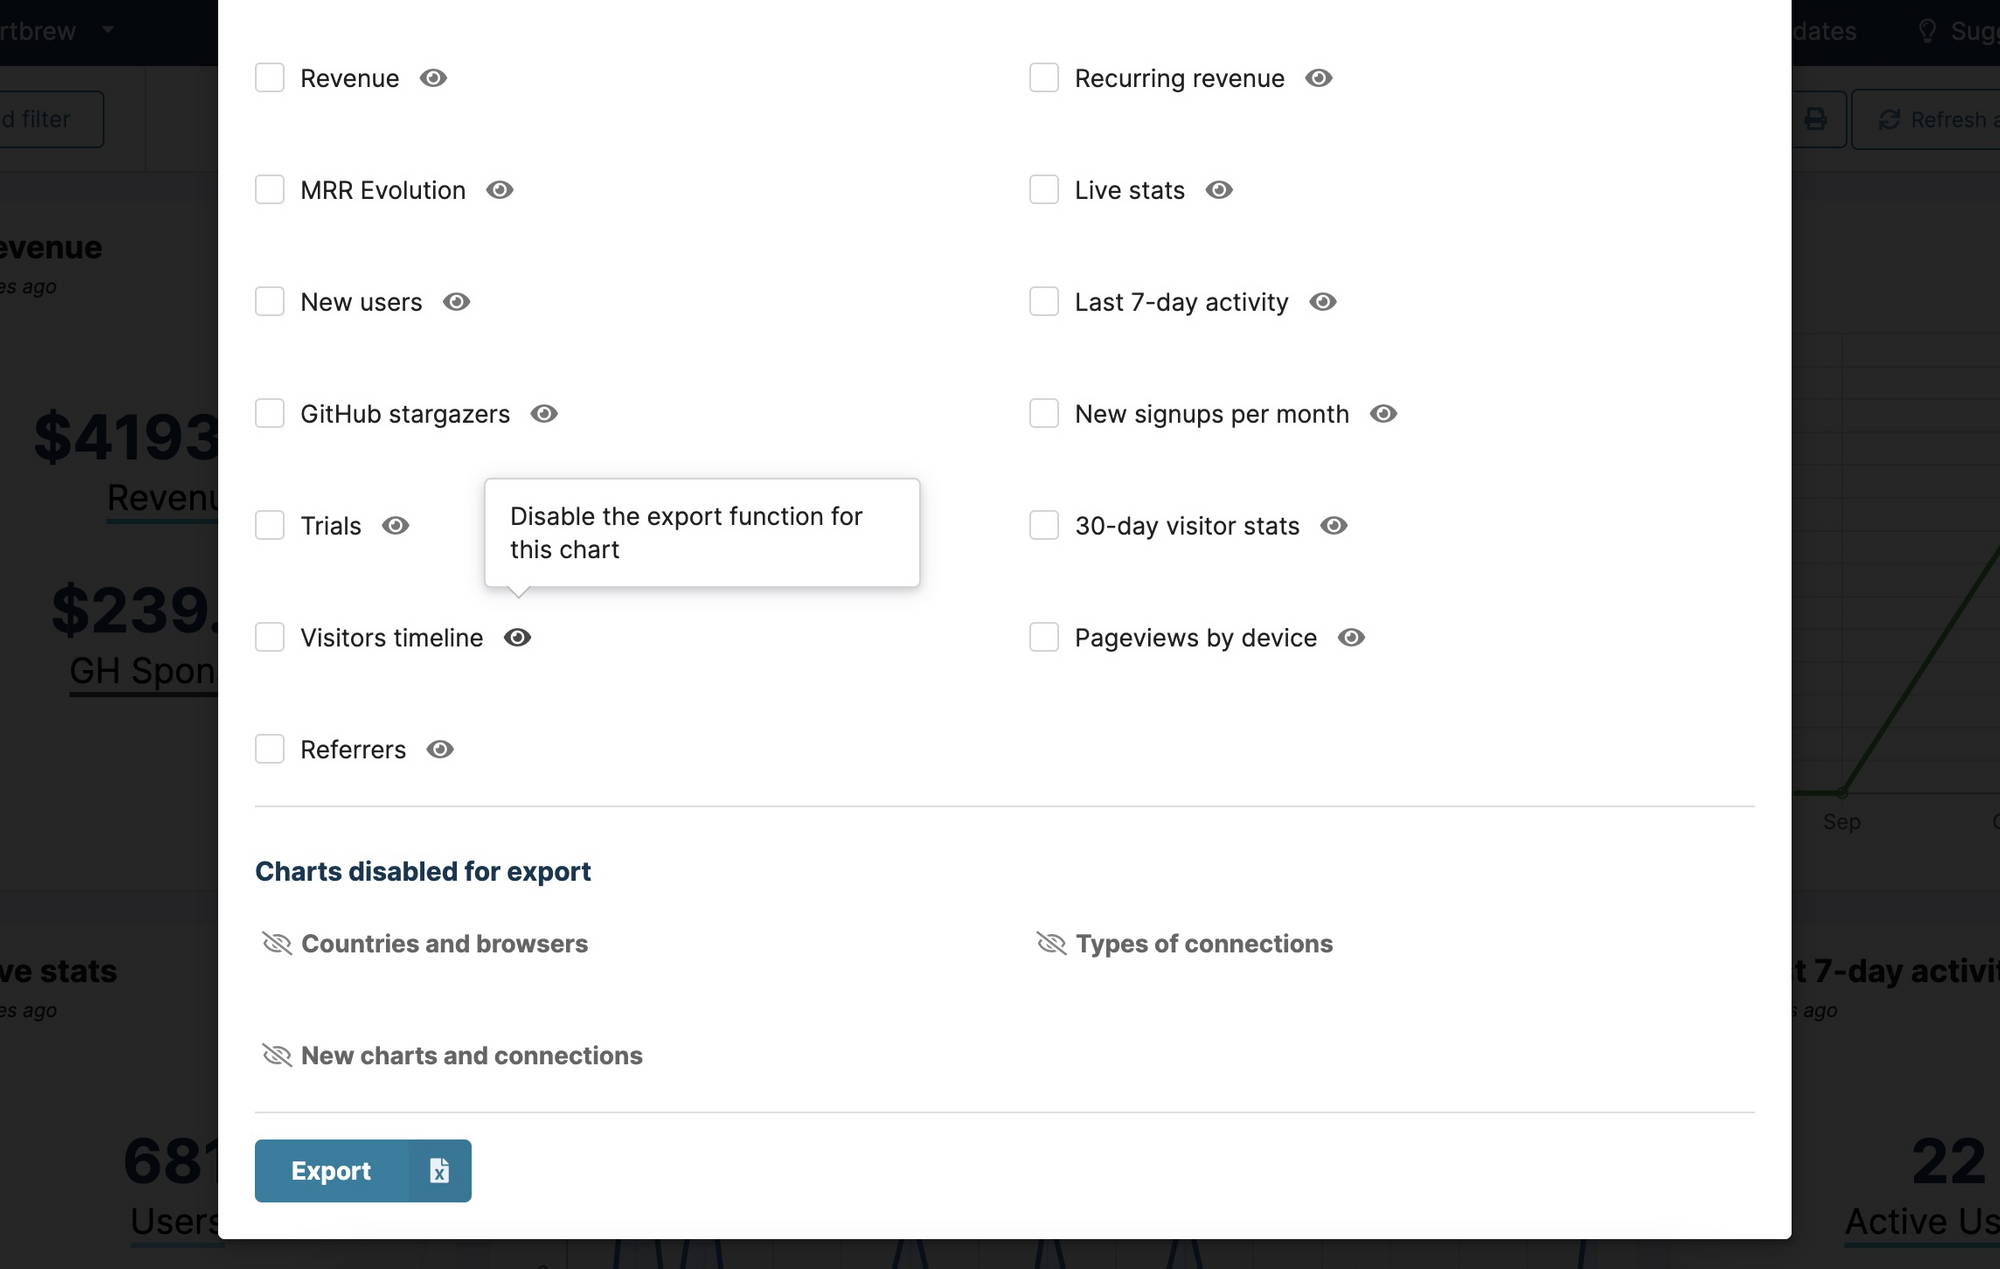
Another extra feature available in Chartbrew is to hide charts from the dashboard export. It is useful when you export dashboards often, but don't want to export some of the charts. The dashboards admins can hide these dashboards from the export screen by clicking on the "eye" icon like shown in the screenshot below:
Closing thoughts
I hope this post gave you some ideas on how you can take advantage of the export feature in Chartbrew. This feature was built with creating dashboard reports in mind, but the functionality can be used for much more than that. Like described in the use-cases section, the export feature gives you the ability to convert responses from almost any APIs, and other data sources to excel sheets.
Don't have a Chartbrew account? Try it now for free and create your perfect dashboard: chartbrew.com
