How to visualize your Firestore data with Chartbrew
Connect, query, and visualize your Firestore data with Chartbrew. A step-by-step tutorial on how you can start creating your insightful dashboard.

This post will quickly walk you through how to connect your Firestore database to Chartbrew and use the data to create a simple visualization. To start, you can create a free account on Chartbrew or self-host the project on your machine.
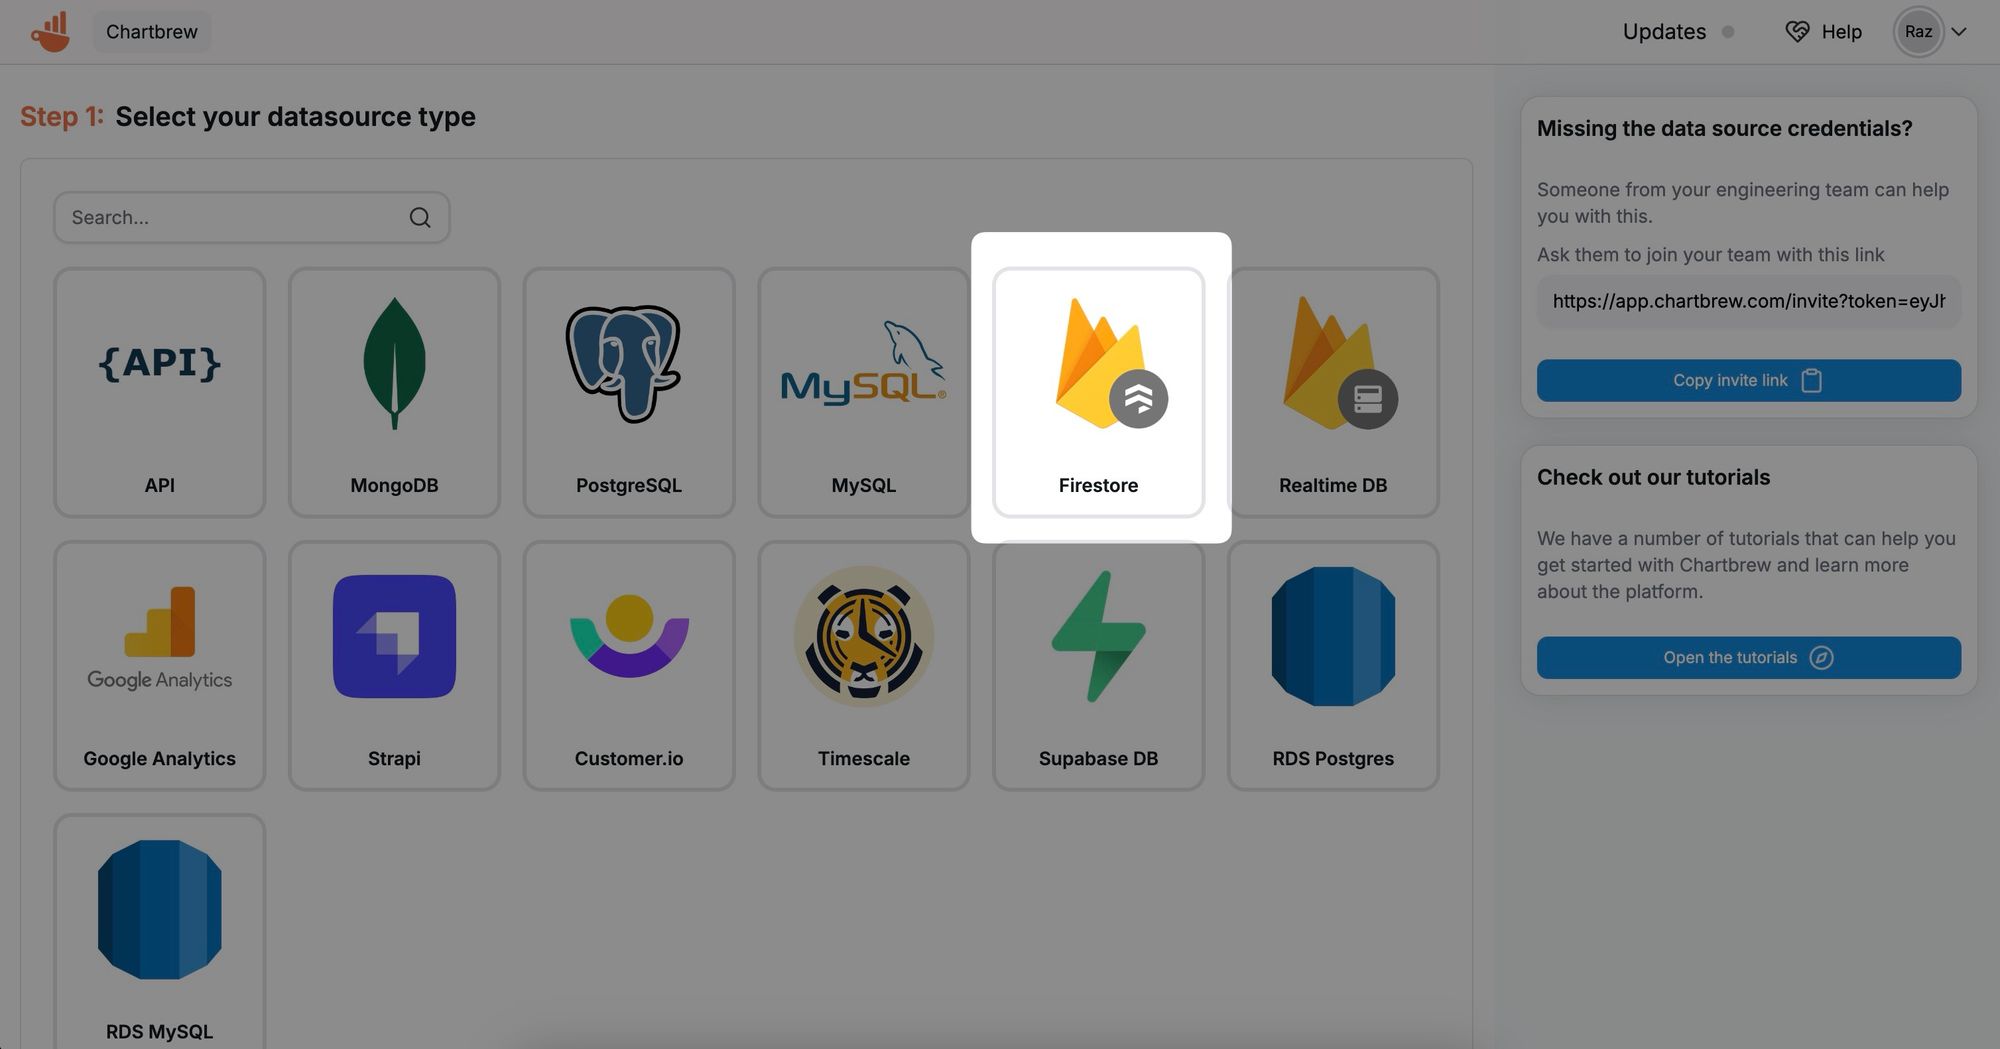
Create a Firestore connection
To connect to Firestore, we will need a JSON authentication file which we can download from the Firebase project settings. First, head over to the connections page in Chartbrew and create a new Firestore connection.
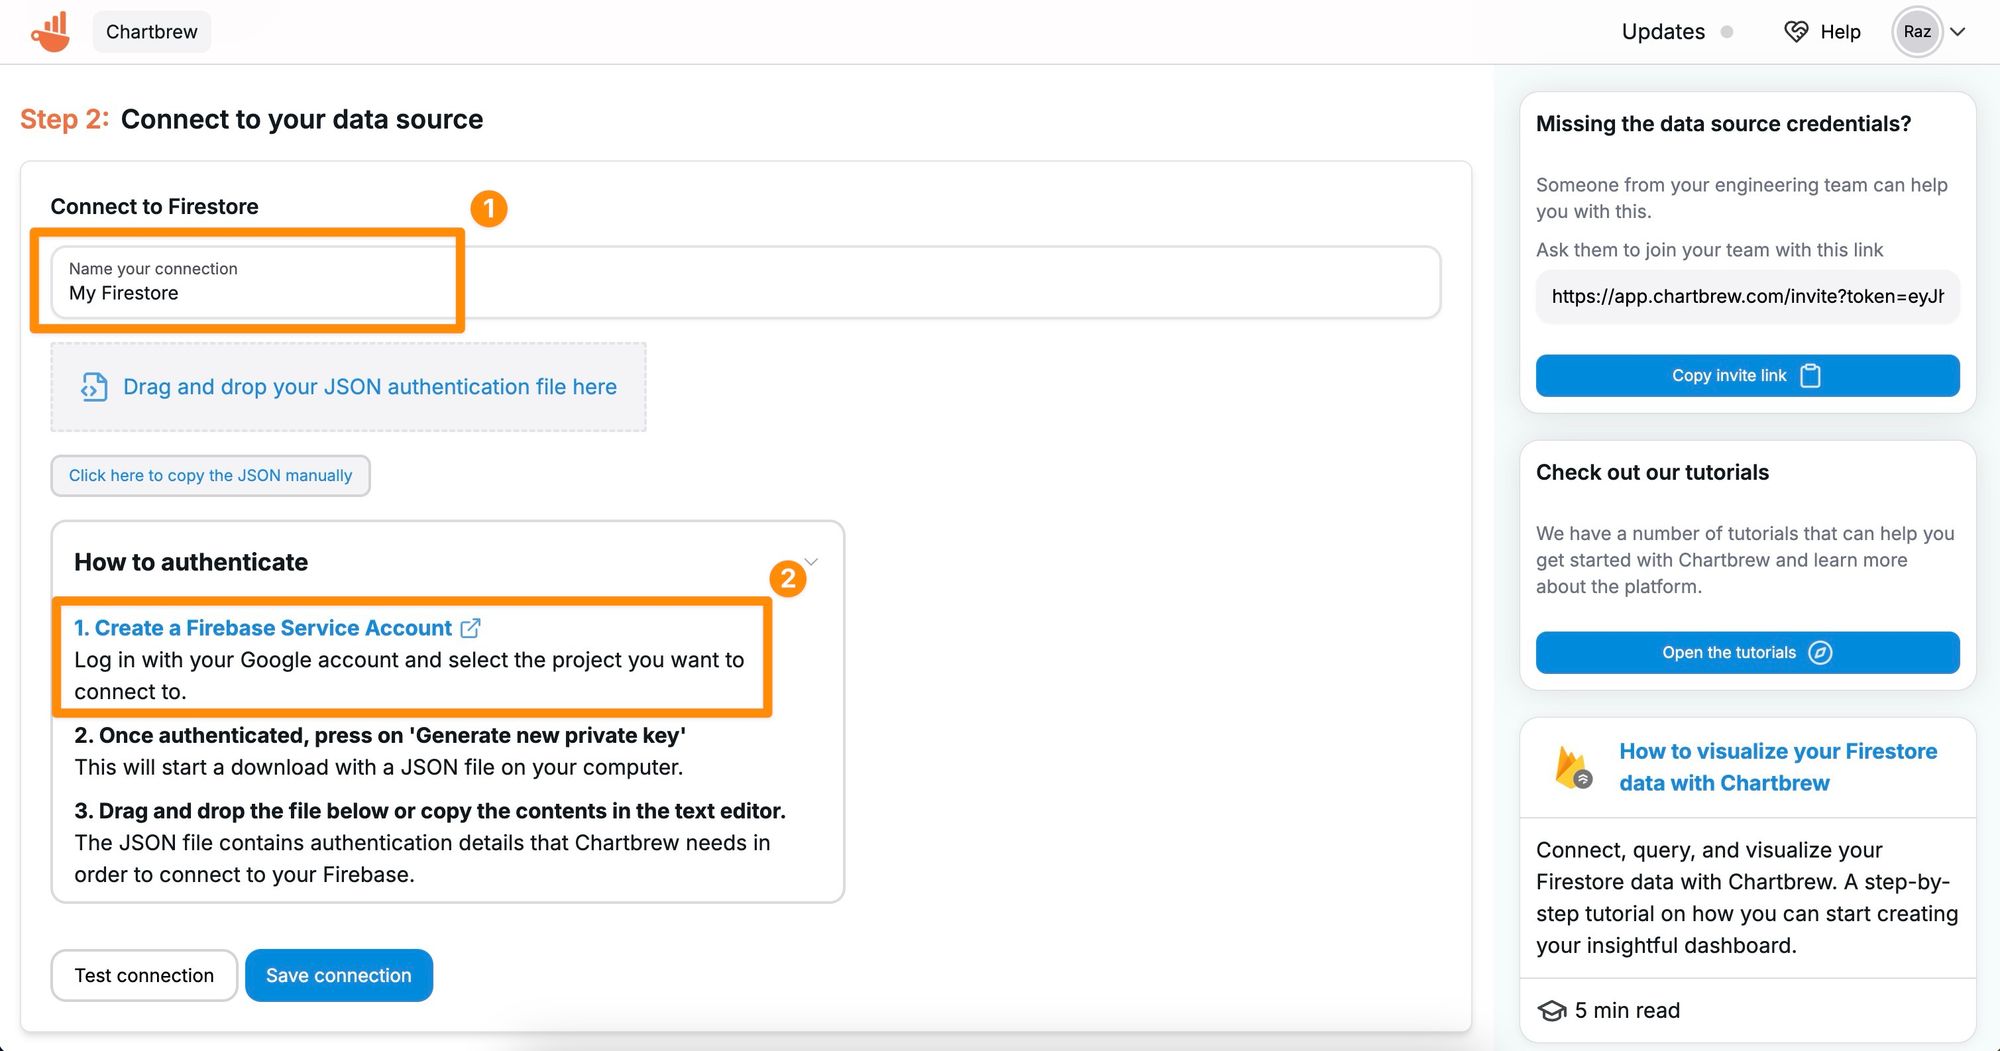
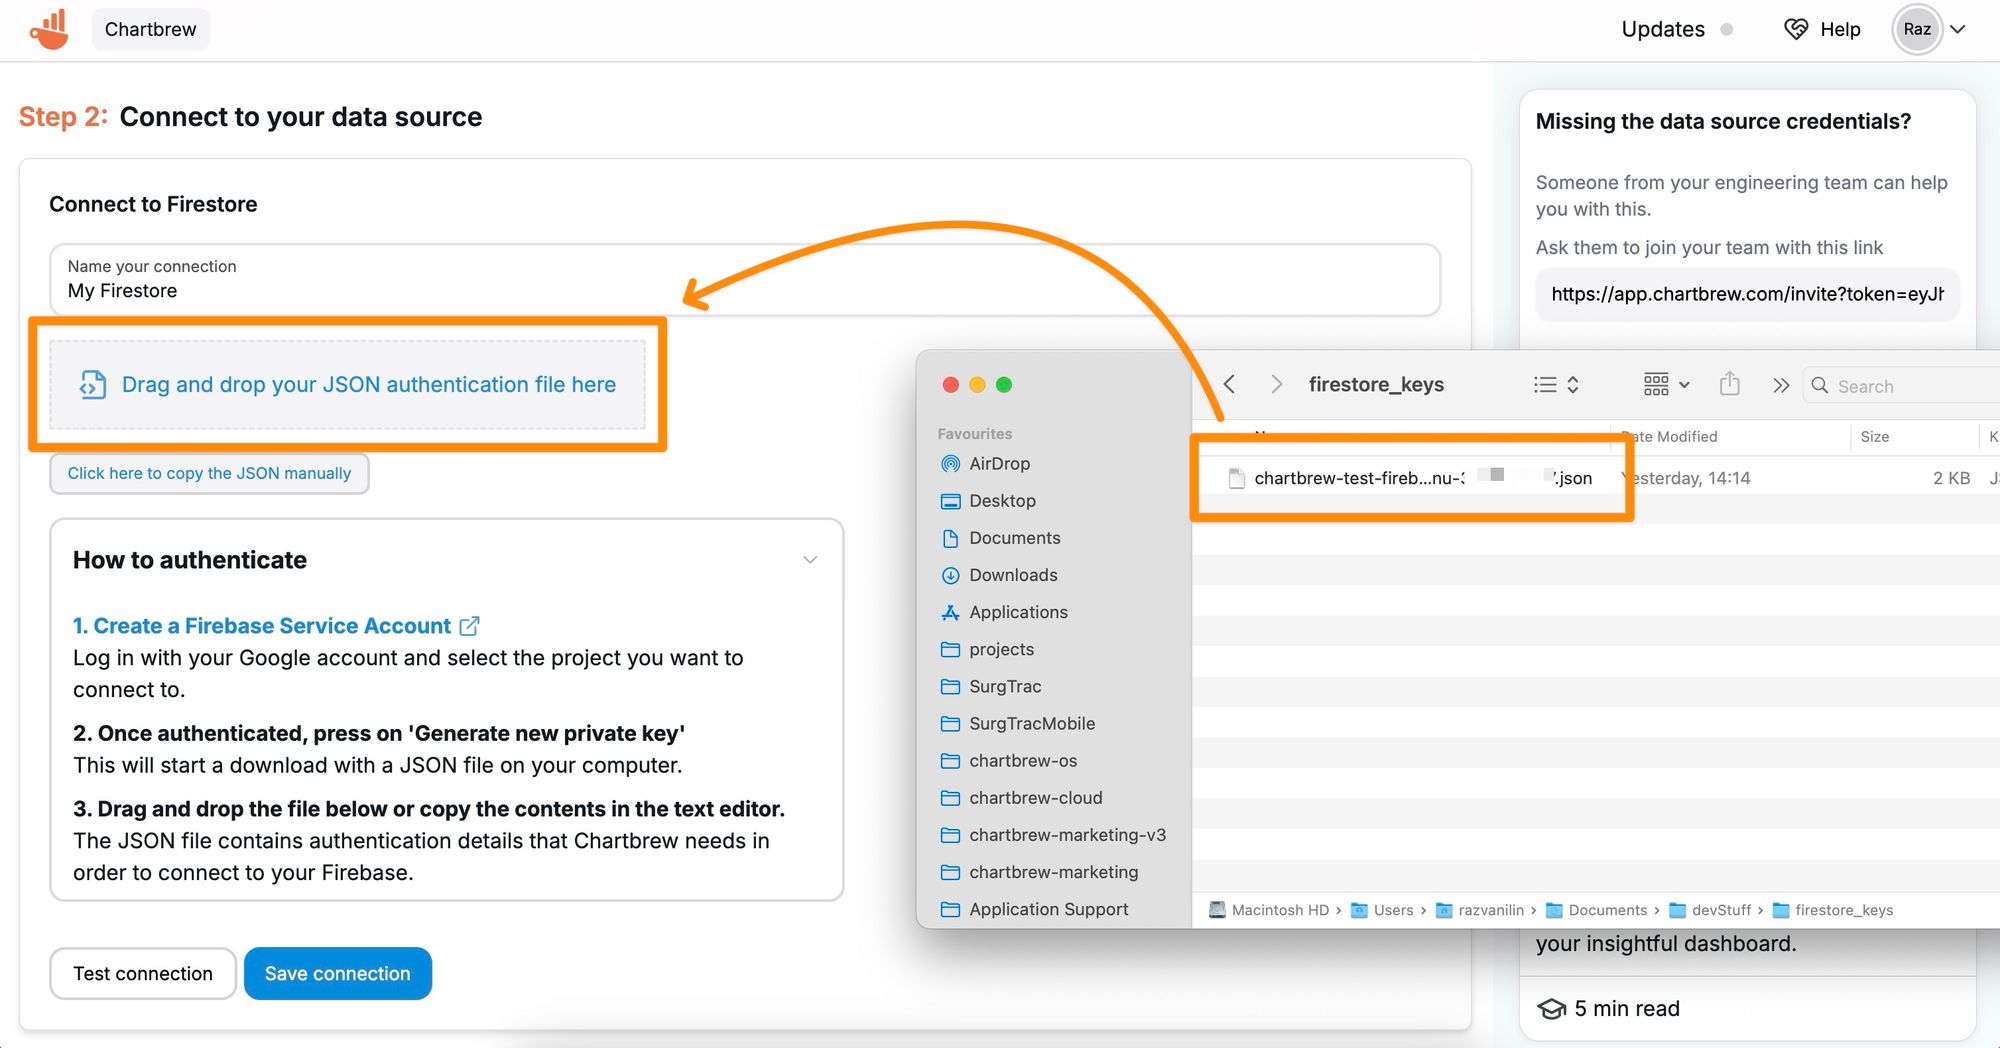
Enter any name for your connection and then click on the link to head over to your Firebase project settings. You can also click here to go there. Once you head over to the URL, you have to select the Firebase project you want to connect to. In the example below, the project is called chartbrew-test.
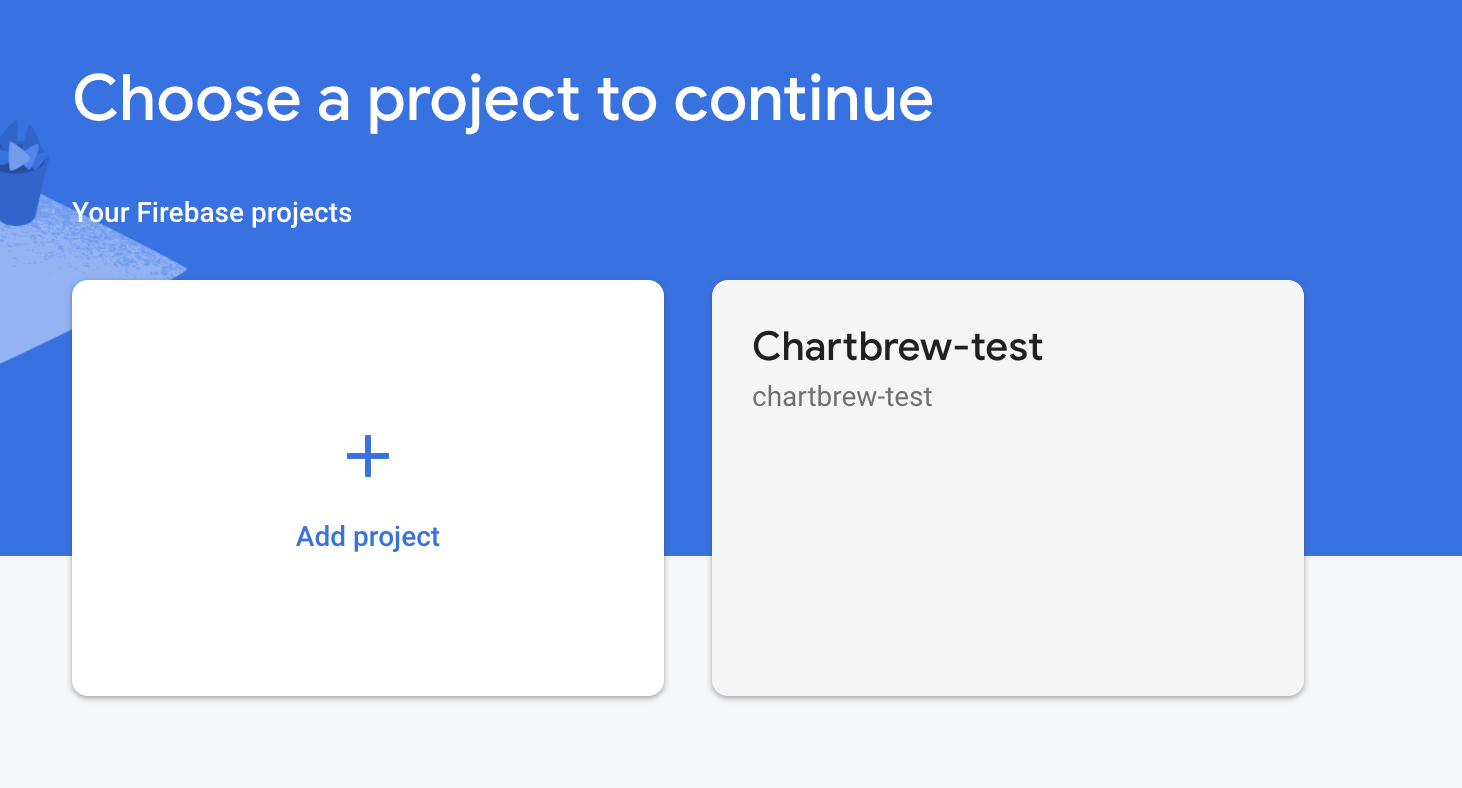
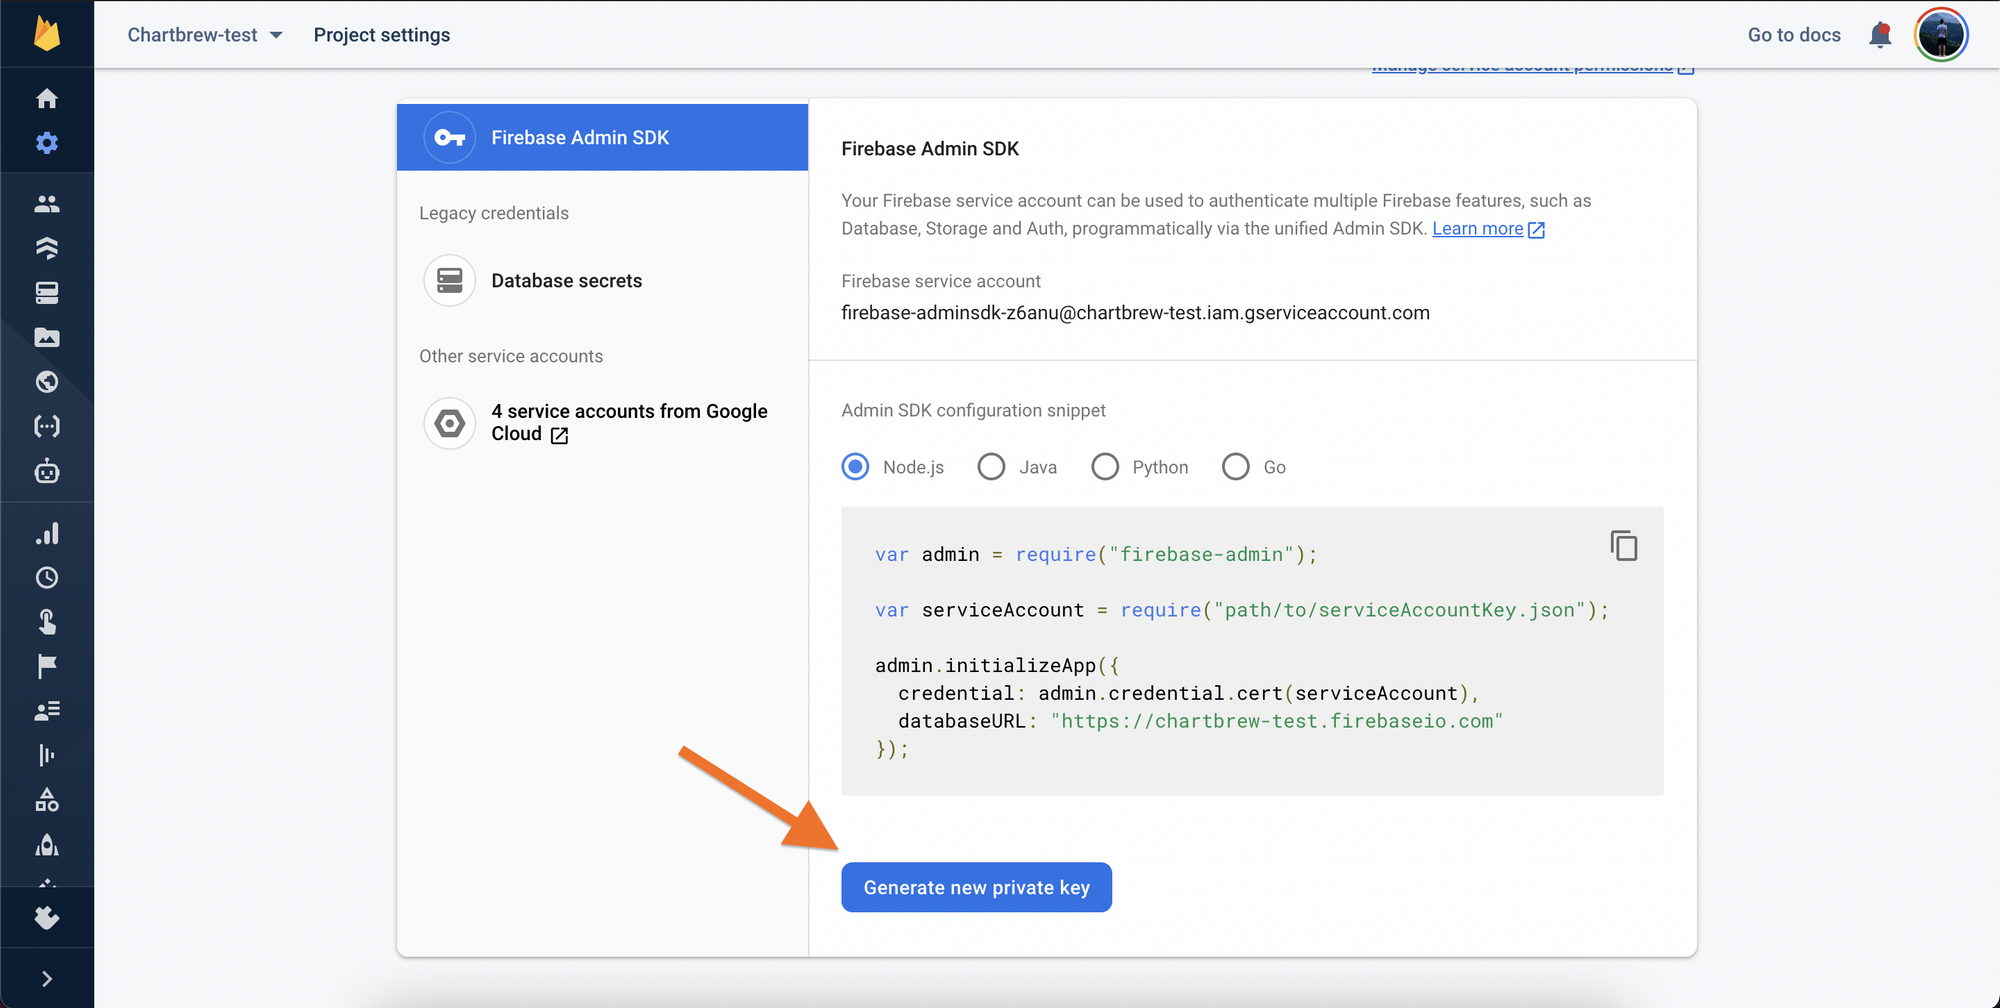
After you click on your project, you will get to the Firebase Admin page from where you have to download your JSON credentials file. Click on the "Generate a new private key" button and you will be prompted to download the key.
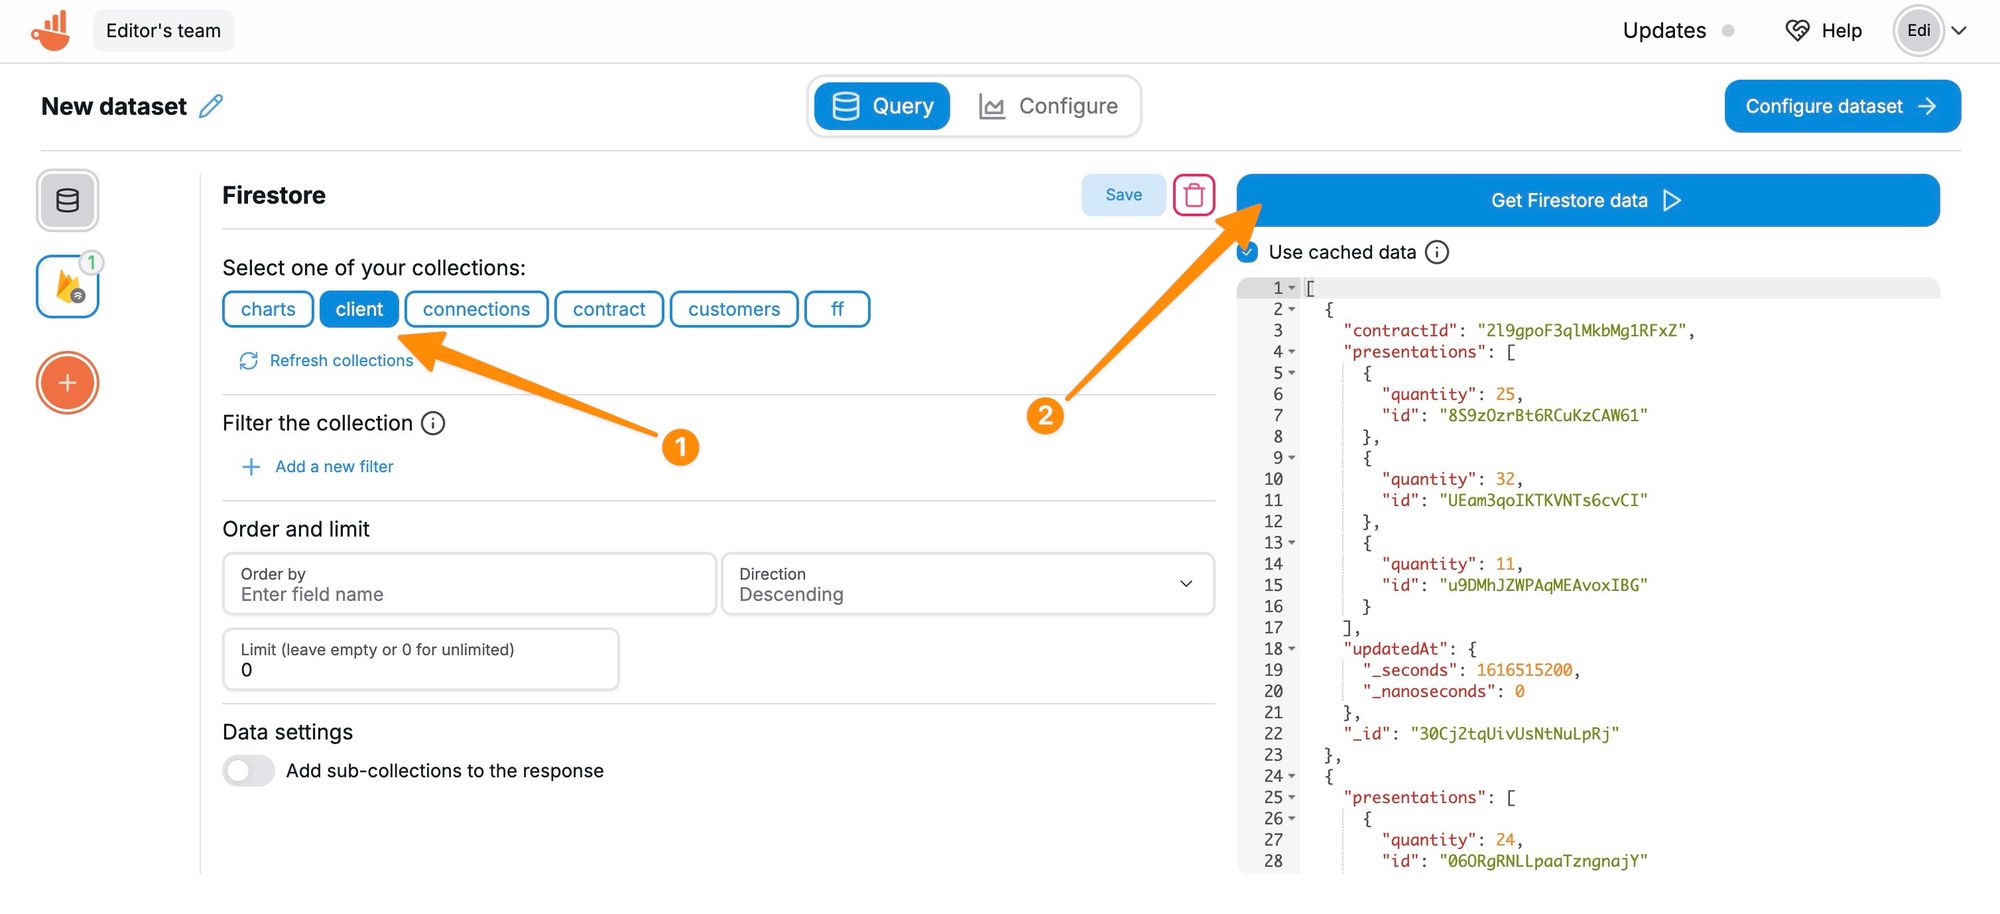
Once you have the key in a JSON file, it's time to return to Chartbrew and add the credentials to the form. You can either copy and paste the contents of the file into the form, or much easier, drag and drop the file directly on the form.
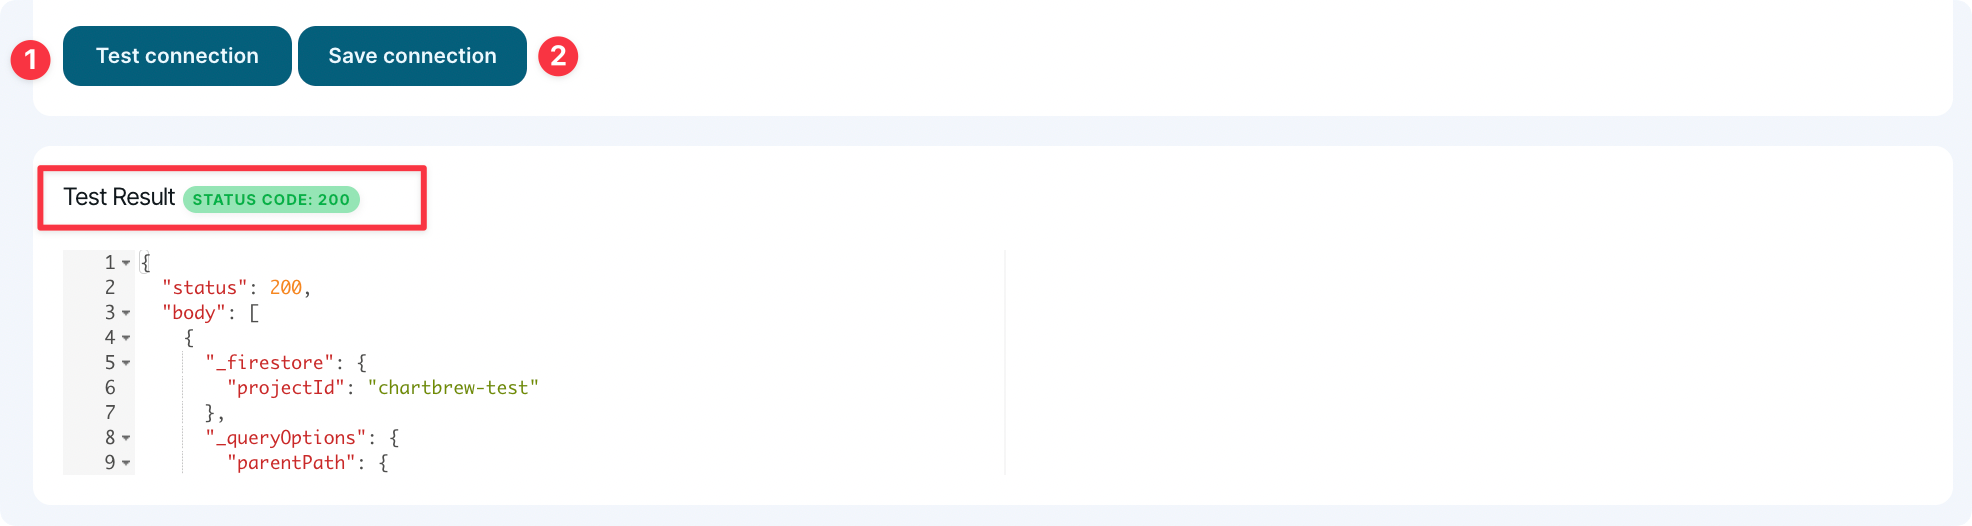
To make sure the authentication works, press the "Test connection" button, and you should get some info about your Firestore database below.
And that's it! We are now connected to Firestore. Next, let's query for some data and create a visualization.
Create a visualization with Firestore data
Now that we are connected, we can start to query for some data and build our first chart.
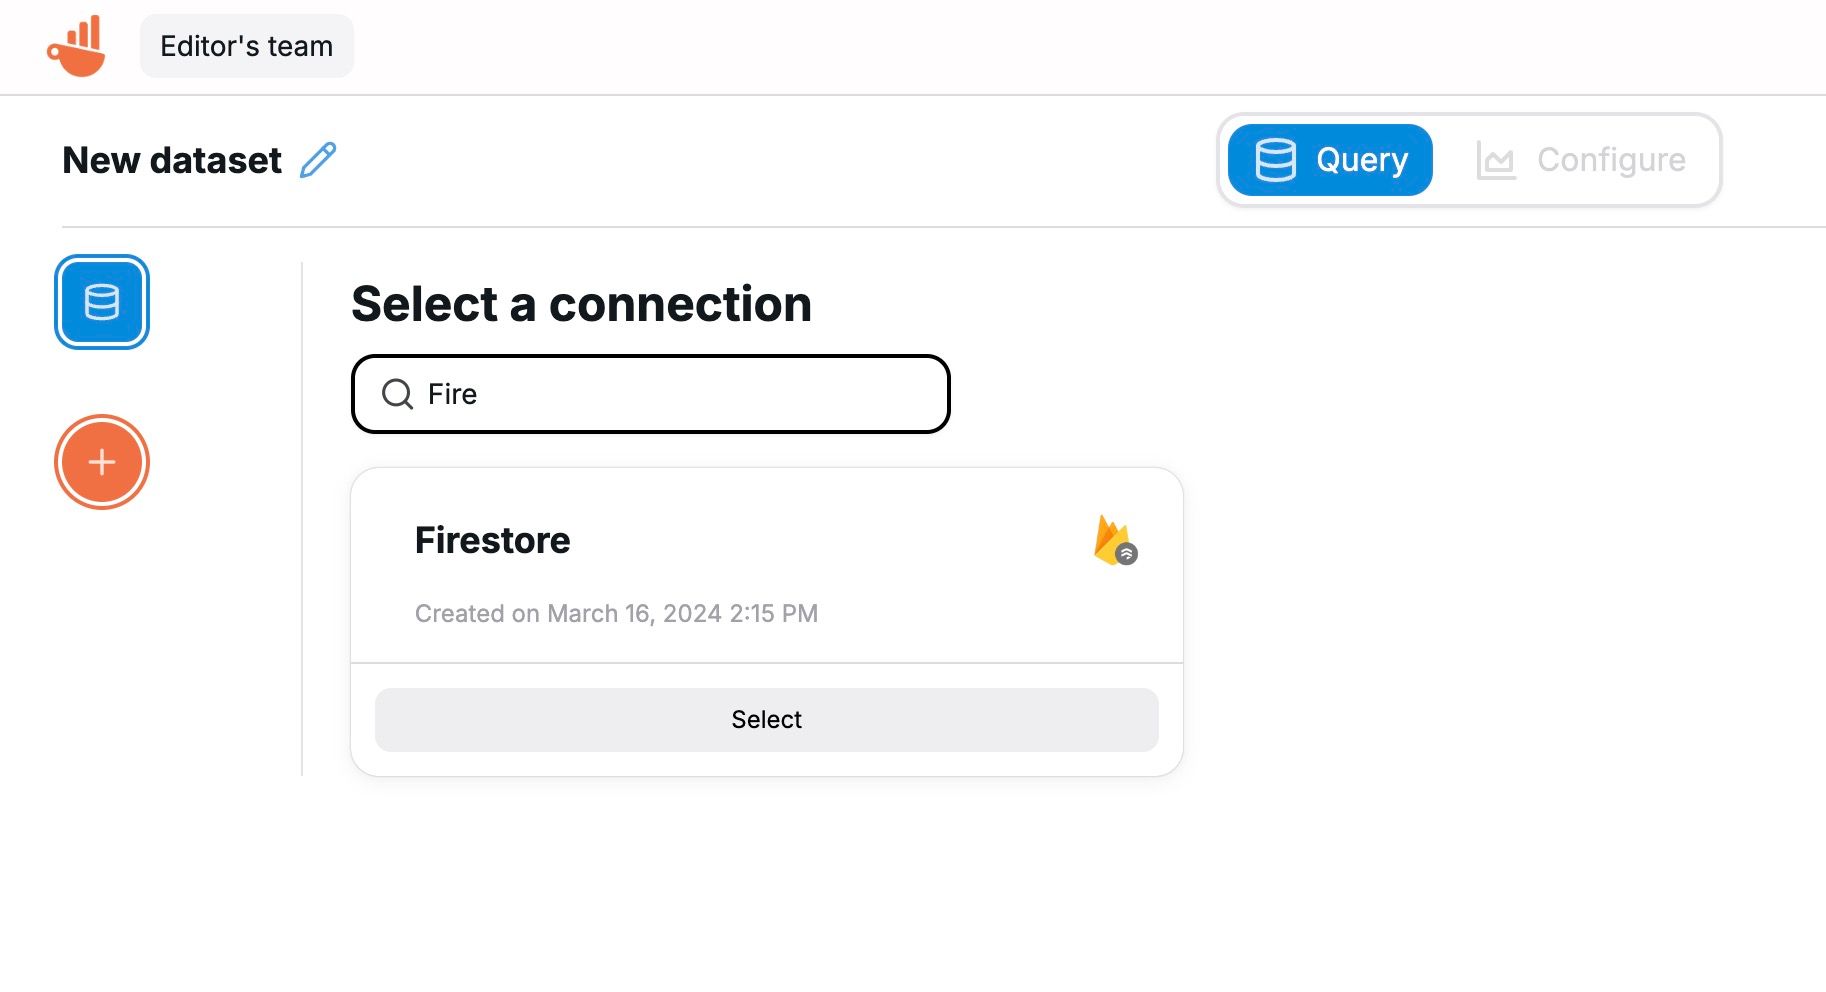
After creating the connection, you will be prompted to create a new dataset. Select the option and let's build our first dataset. You can also create new datasets from your the homepage. First thing when creating a new dataset, you will have to select its main connection. Select the newly created connection.
Once done, click on the Configure dataset button, and Chartbrew will try to create a visualization for you automatically based on your data. You can further customize what the chart shows on the Y and X-axis.
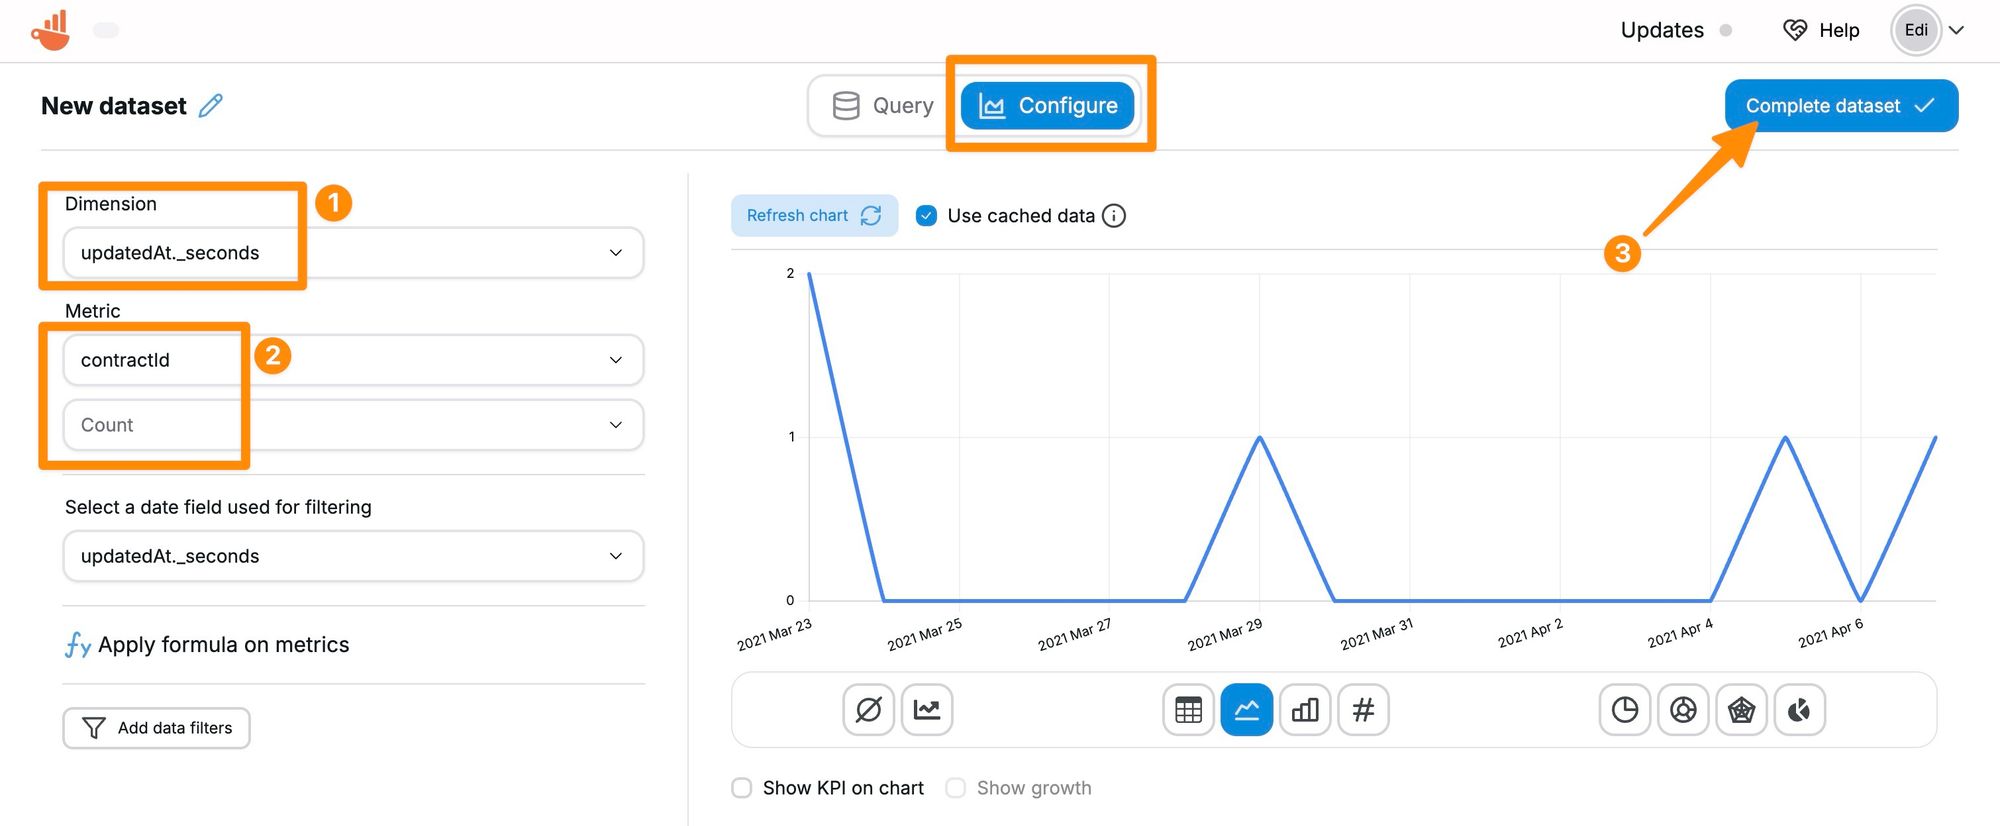
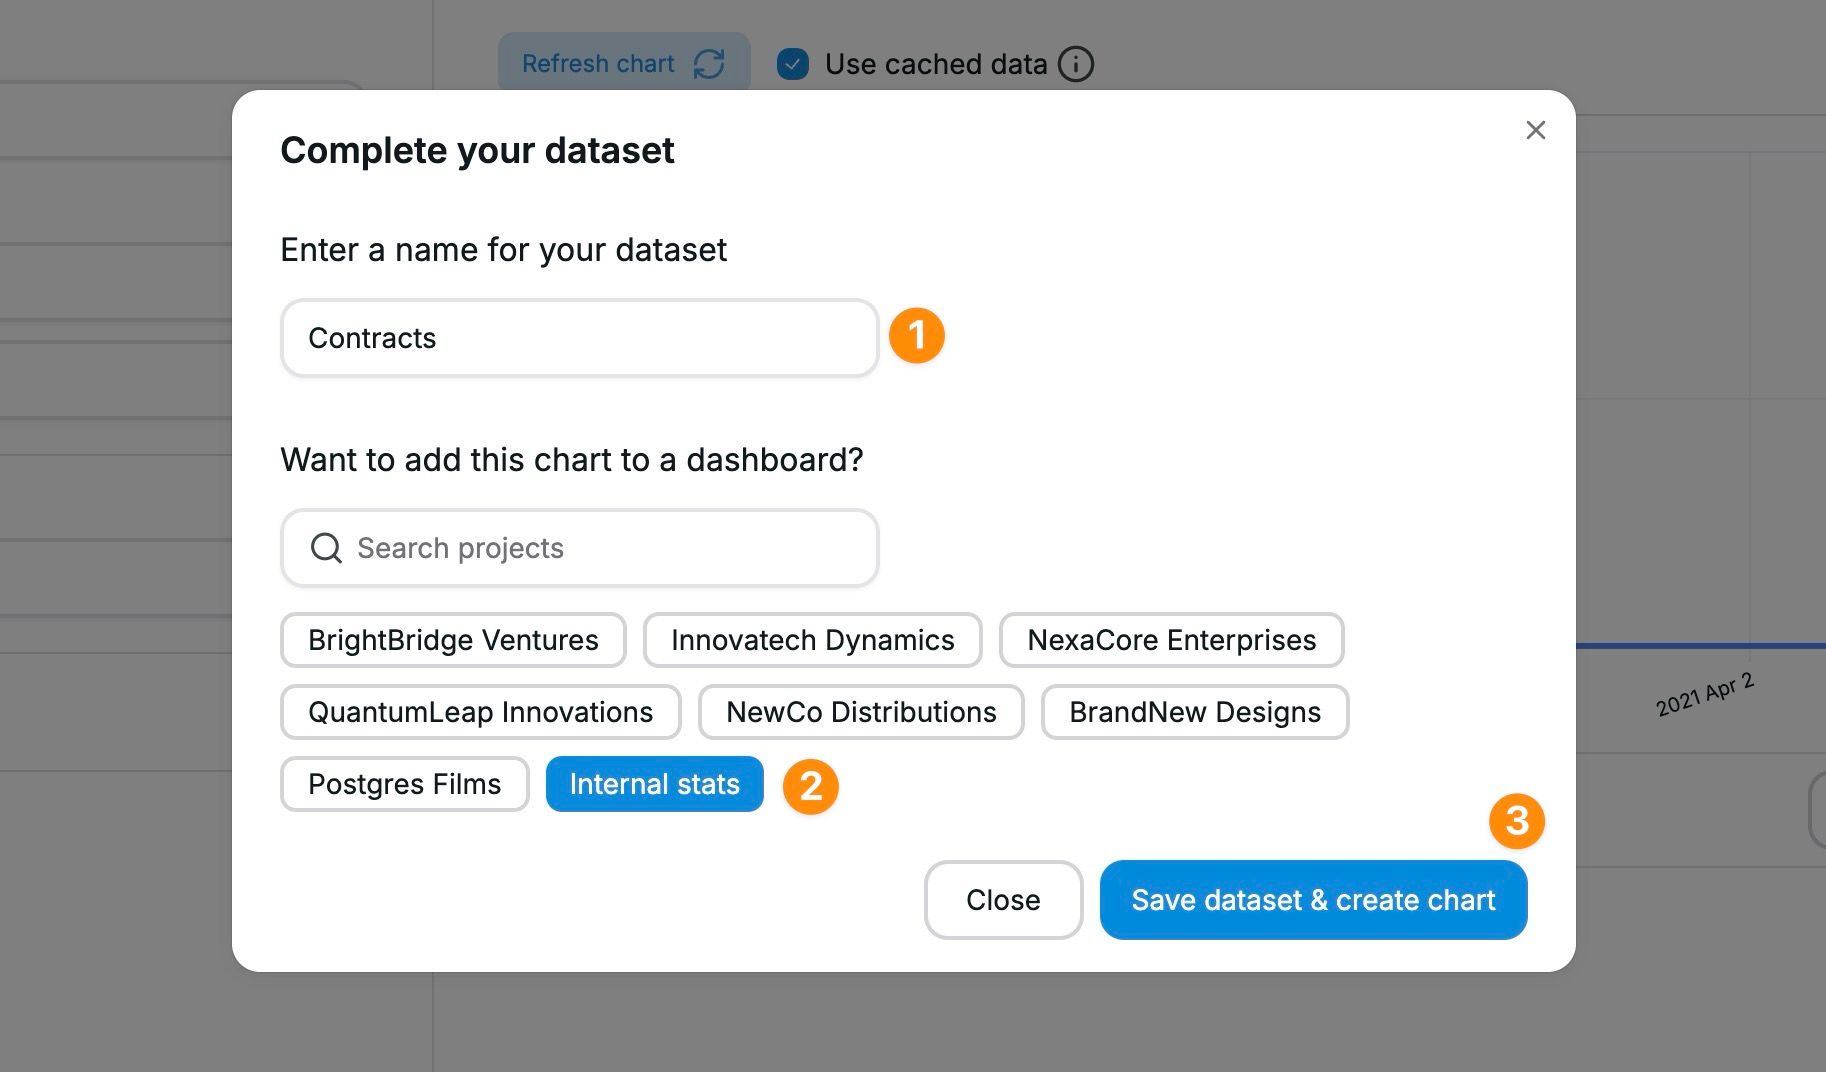
When you are happy with the dataset, click on the Complete dataset button to make it ready for charts. In the final step, you can set a name for your dataset so you can identify it later. You can also quickly add the chart you created inside the preview to your existing dashboards, but this step is optional.
Accessing and working with sub-collections
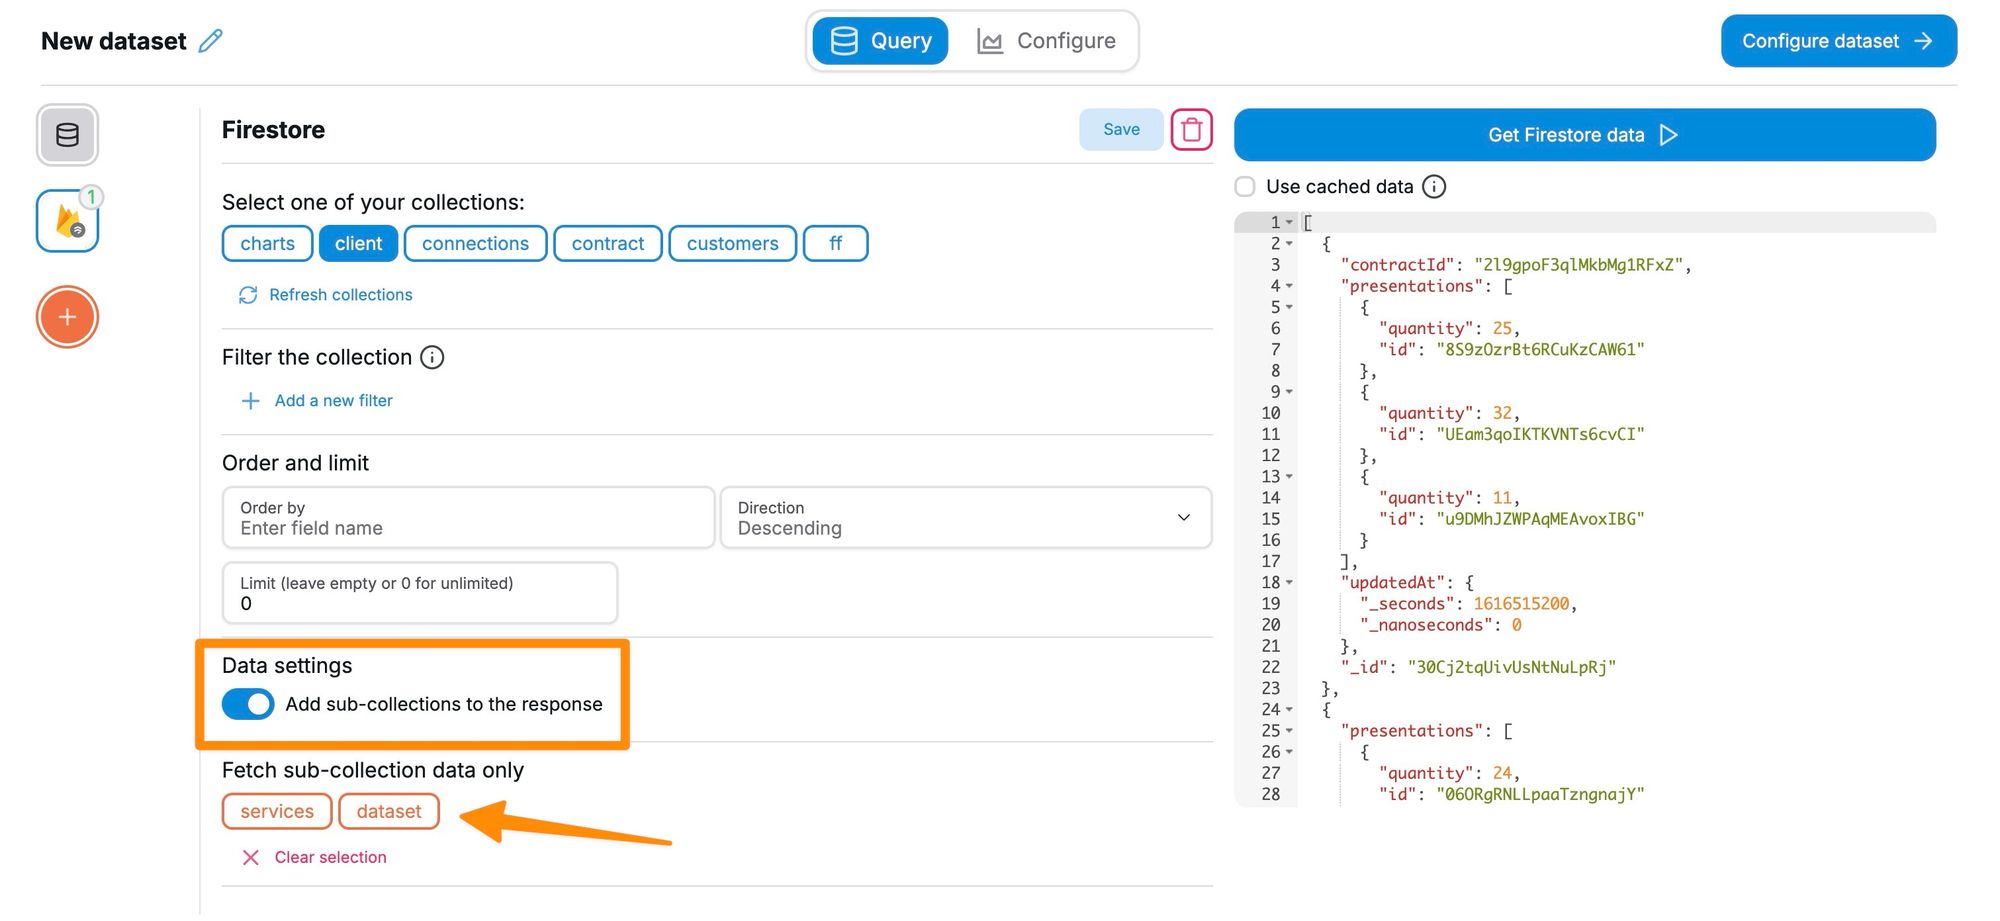
Since Chartbrew v1.15.0, it is possible to query sub-collections from Firestore. The experience is similar to the Firestore official dashboard where after you click on one of the main collections you get the sub-collections available in a certain document. With Chartbrew, this experience is improved and you can work with sub-collections in multiple ways:
- Query main collections and add the sub-collections as arrays in JSON
- Query all documents of a certain sub-collection
- Filter sub-collections based on their fields or parent's fields
Chartbrew will automatically show existing sub-collections when you click on one of the main collections. Applying filters on the main collections will also filter out sub-collections.
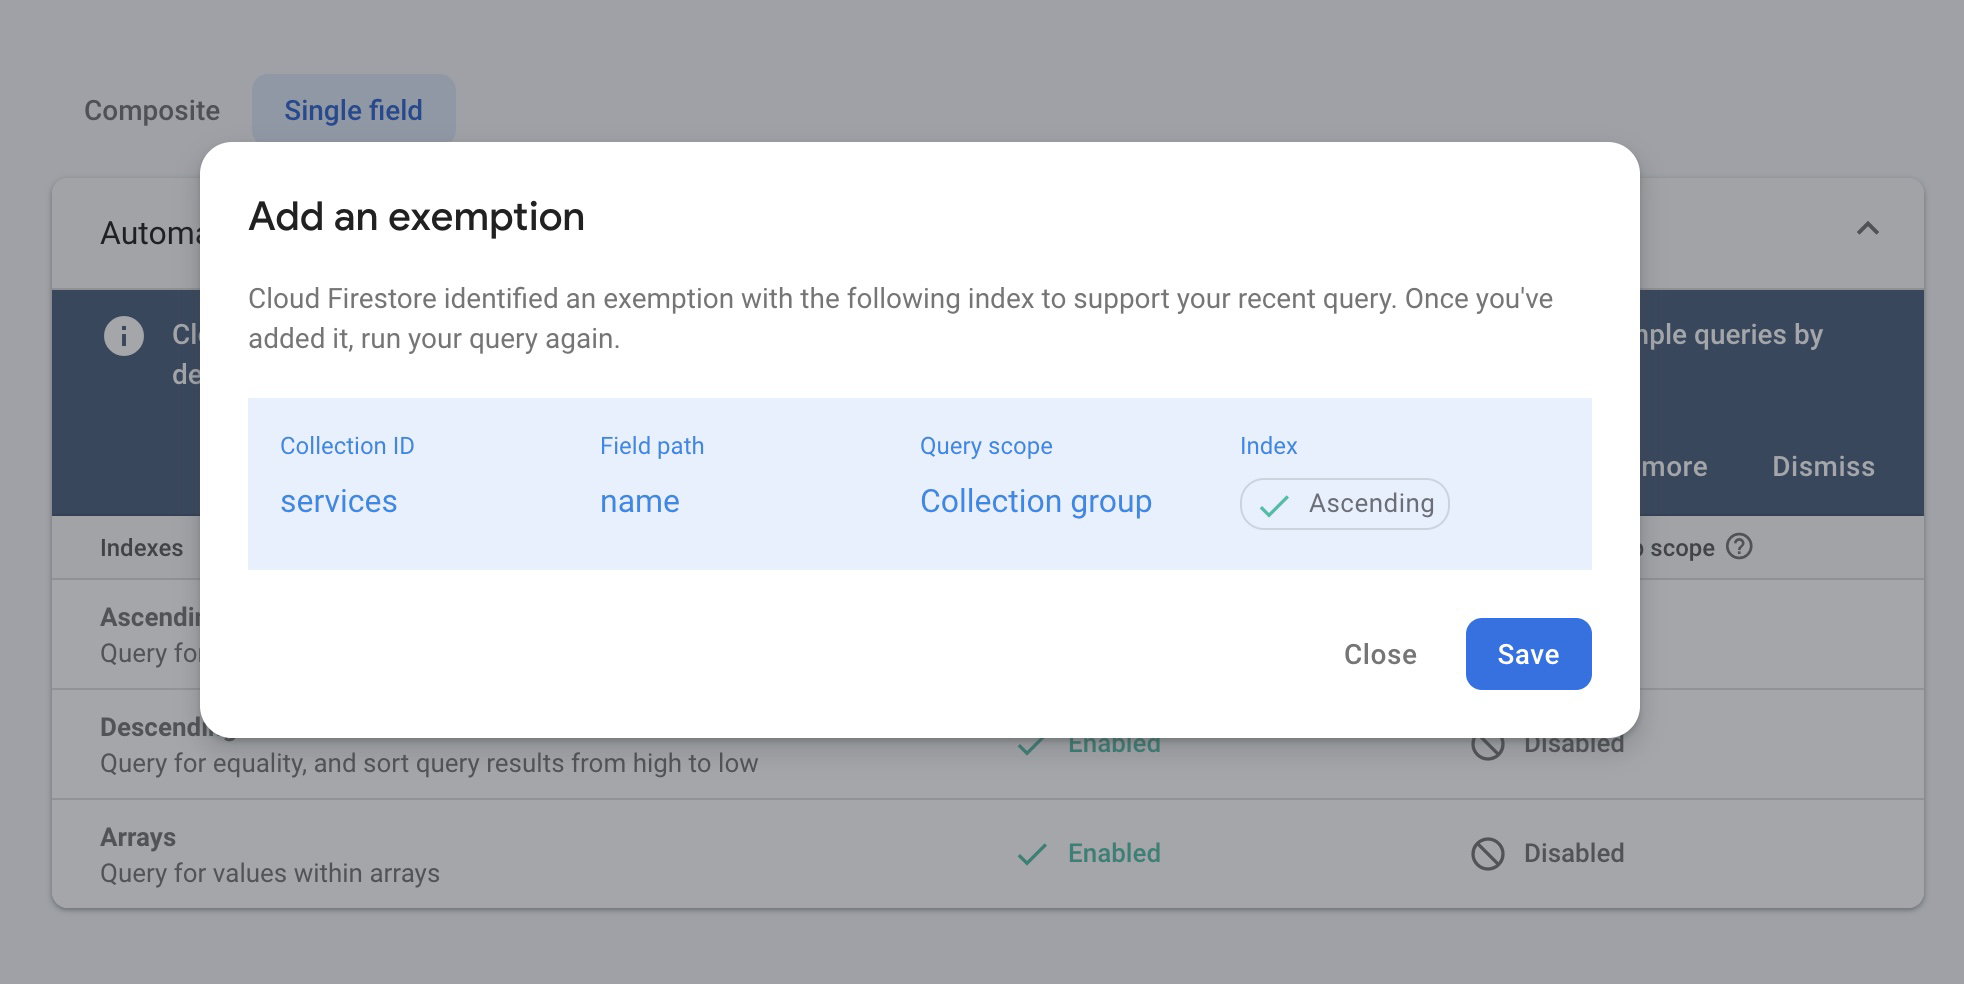
It is also possible to filter sub-collections directly. Click on "Add filter" below your sub-collections and you get a list of available fields. You will need to add an index on the field used for filtering, but Chartbrew will guide you through the process.
The link is generated by Chartbrew to take you to exactly where you need to add the index in your Firestore dashboard. Add the index by clicking on "Save" as shown in the picture below.
The index might take a while to apply and you can monitor the progress on the same page after you click "Save".
After the index is applied you can return to Chartbrew and request the data again and you should see only the data that passes the filter.
Auto-update, share, embed
With Chartbrew, you can do many things with your charts. Other than arranging them into an insightful dashboard, you can set them so they auto-update in a time interval. The charts are not updating whenever a user refreshes the page. The data updates when triggered manually or when the auto-update interval is on.
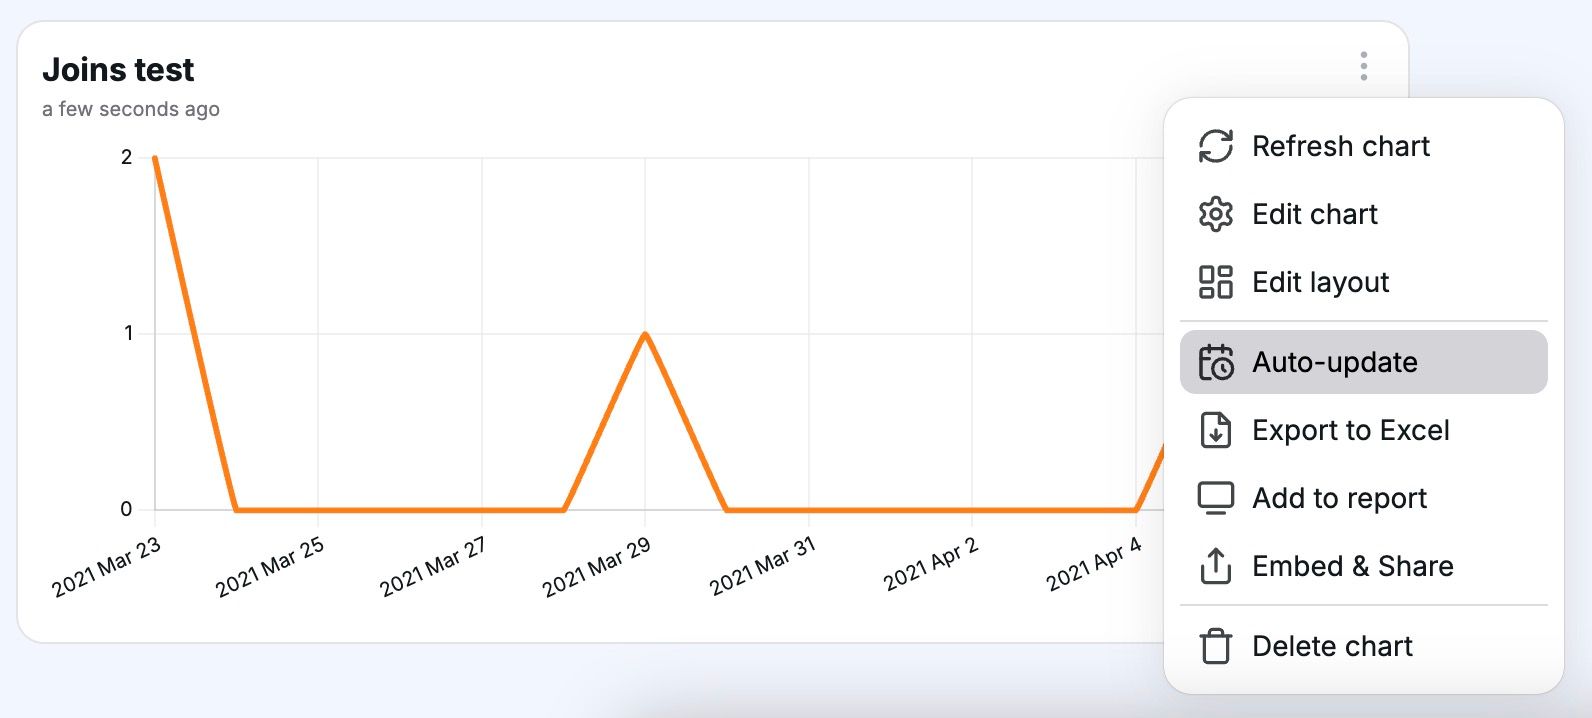
You can also share the chart's link with anyone and can even embed a live chart on your website or documentation sites and blogs.
Next steps
- Try to connect other services to Chartbrew and create charts from different sources in the same dashboard
- Use other visualization types such as pie charts for segmentation or table views for a clear display of data
- Measure your KPIs with the KPI view in the chart editor
- Check other tutorials to learn how to connect various data sources to Chartbrew
