Stripe has always been one of those sources that people want on a dashboard quickly. The useful questions are usually simple: how much money came in, how much went to fees, which payments failed, what invoices need attention, and how subscriptions are moving over time.
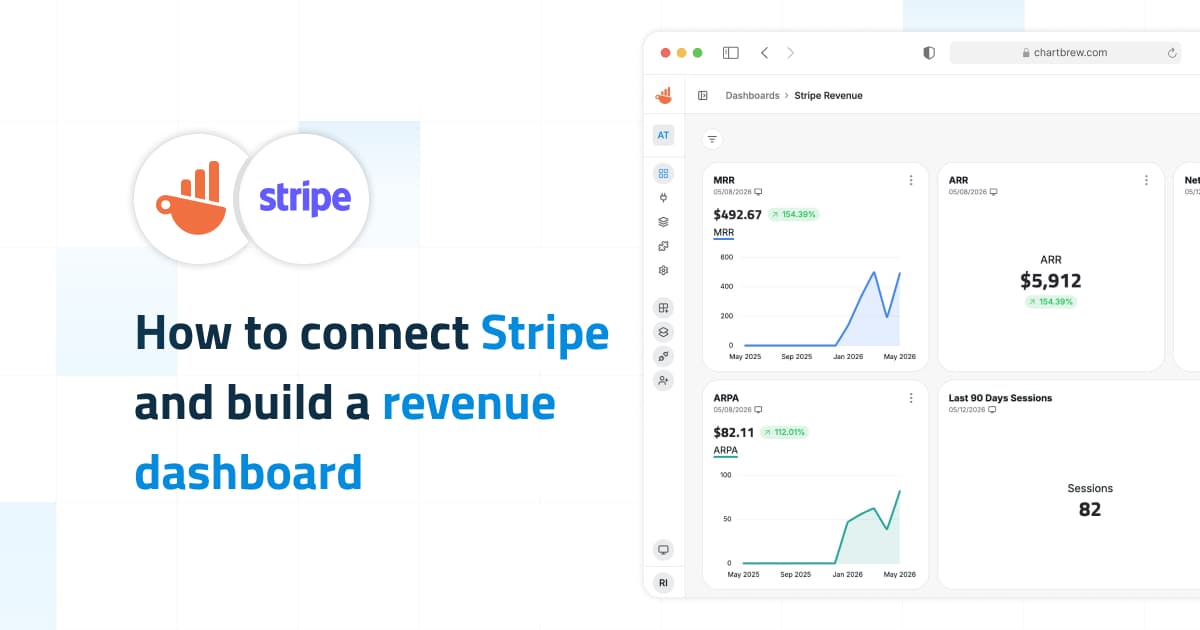
The new Stripe source in Chartbrew is built around that workflow. Instead of setting up a generic API connection and manually wiring Stripe routes one by one, you can connect Stripe once, test the key, and start from ready-made dashboard templates for revenue, payments, invoices, subscriptions, refunds, and recurring revenue metrics.
What the Stripe source is for
The Stripe source is read-only reporting for your Stripe account. It is meant for operational dashboards: the kind you check during the week to see what happened with revenue, subscriptions, payments, invoices, fees, and refunds.
For financial close, revenue recognition, audited reporting, or accounting reconciliation, you should still use your accounting system or warehouse process. Chartbrew is giving you live visibility into Stripe activity, not replacing your finance workflow.
Here is the rough split between the two Stripe template groups:
| Template | Use it when you want to track |
|---|---|
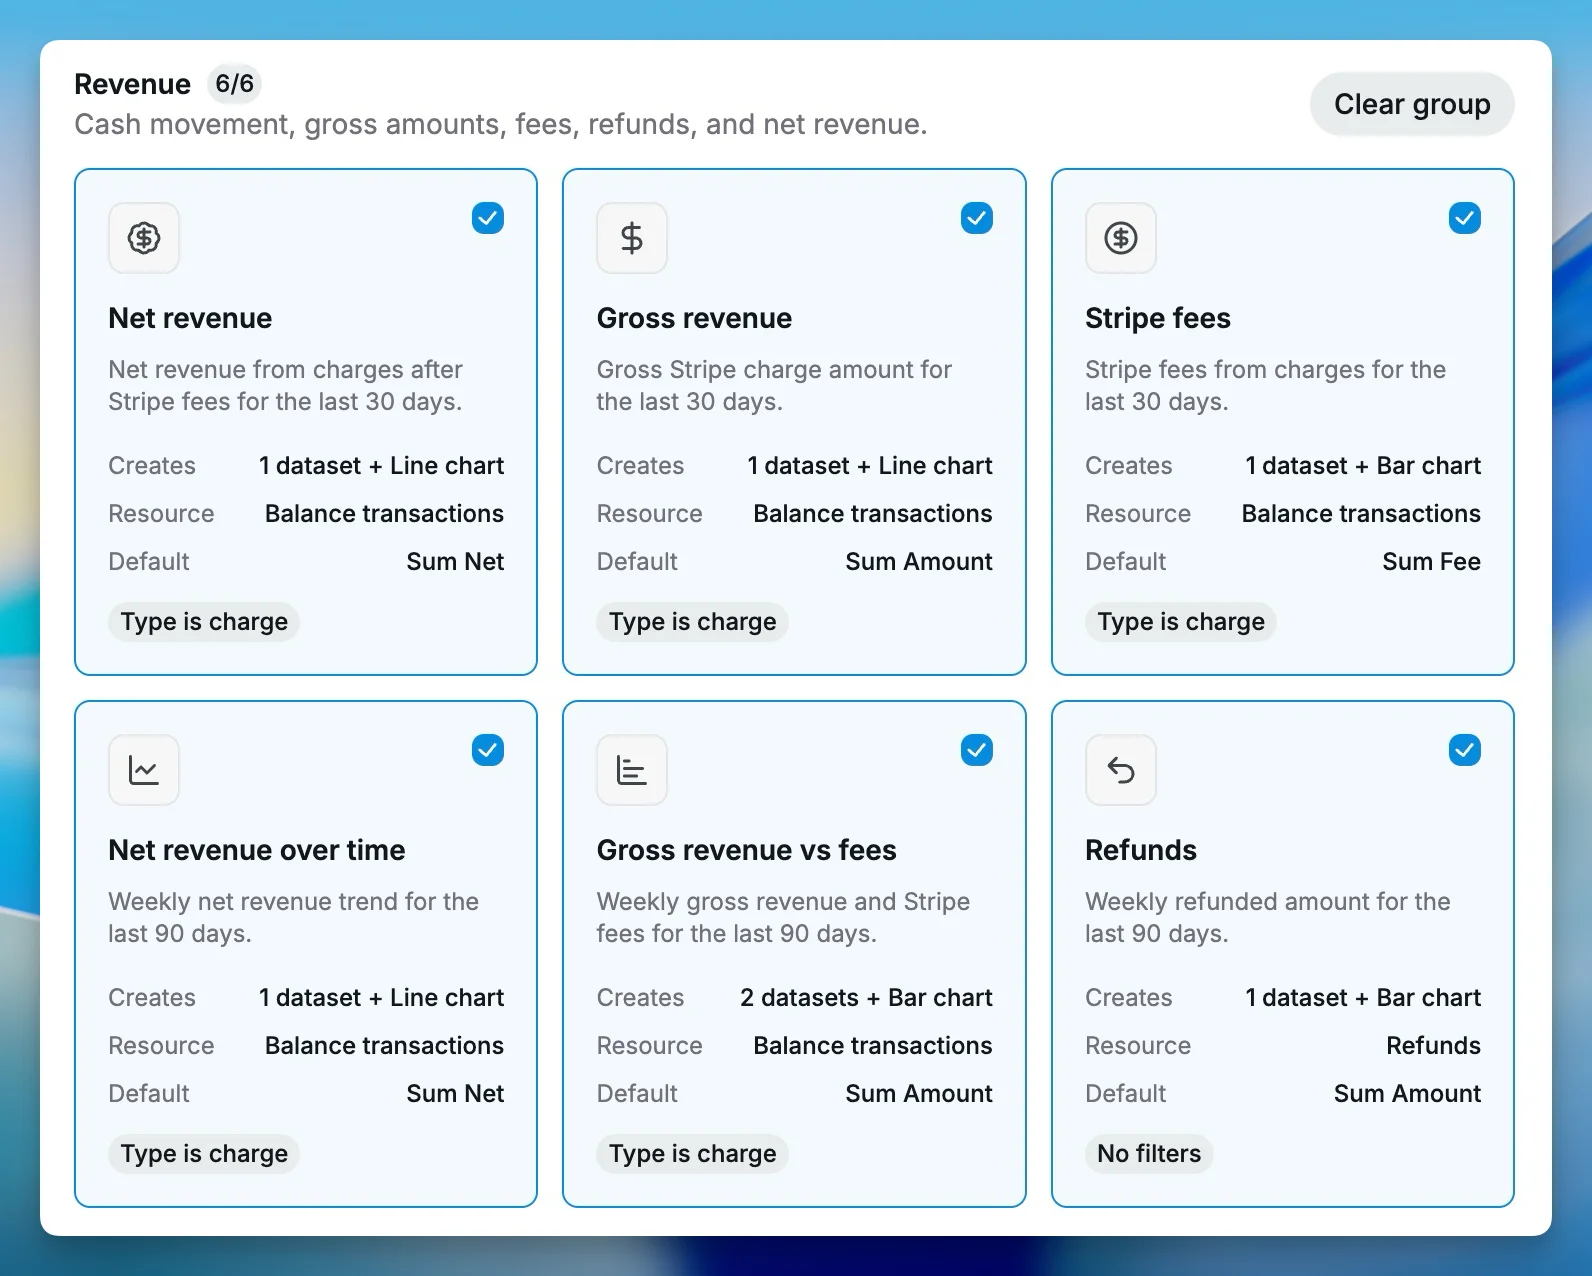
| Stripe Starter Metrics | Net revenue, gross revenue, Stripe fees, refunds, successful and failed payments, active subscriptions, latest payments, open invoices |
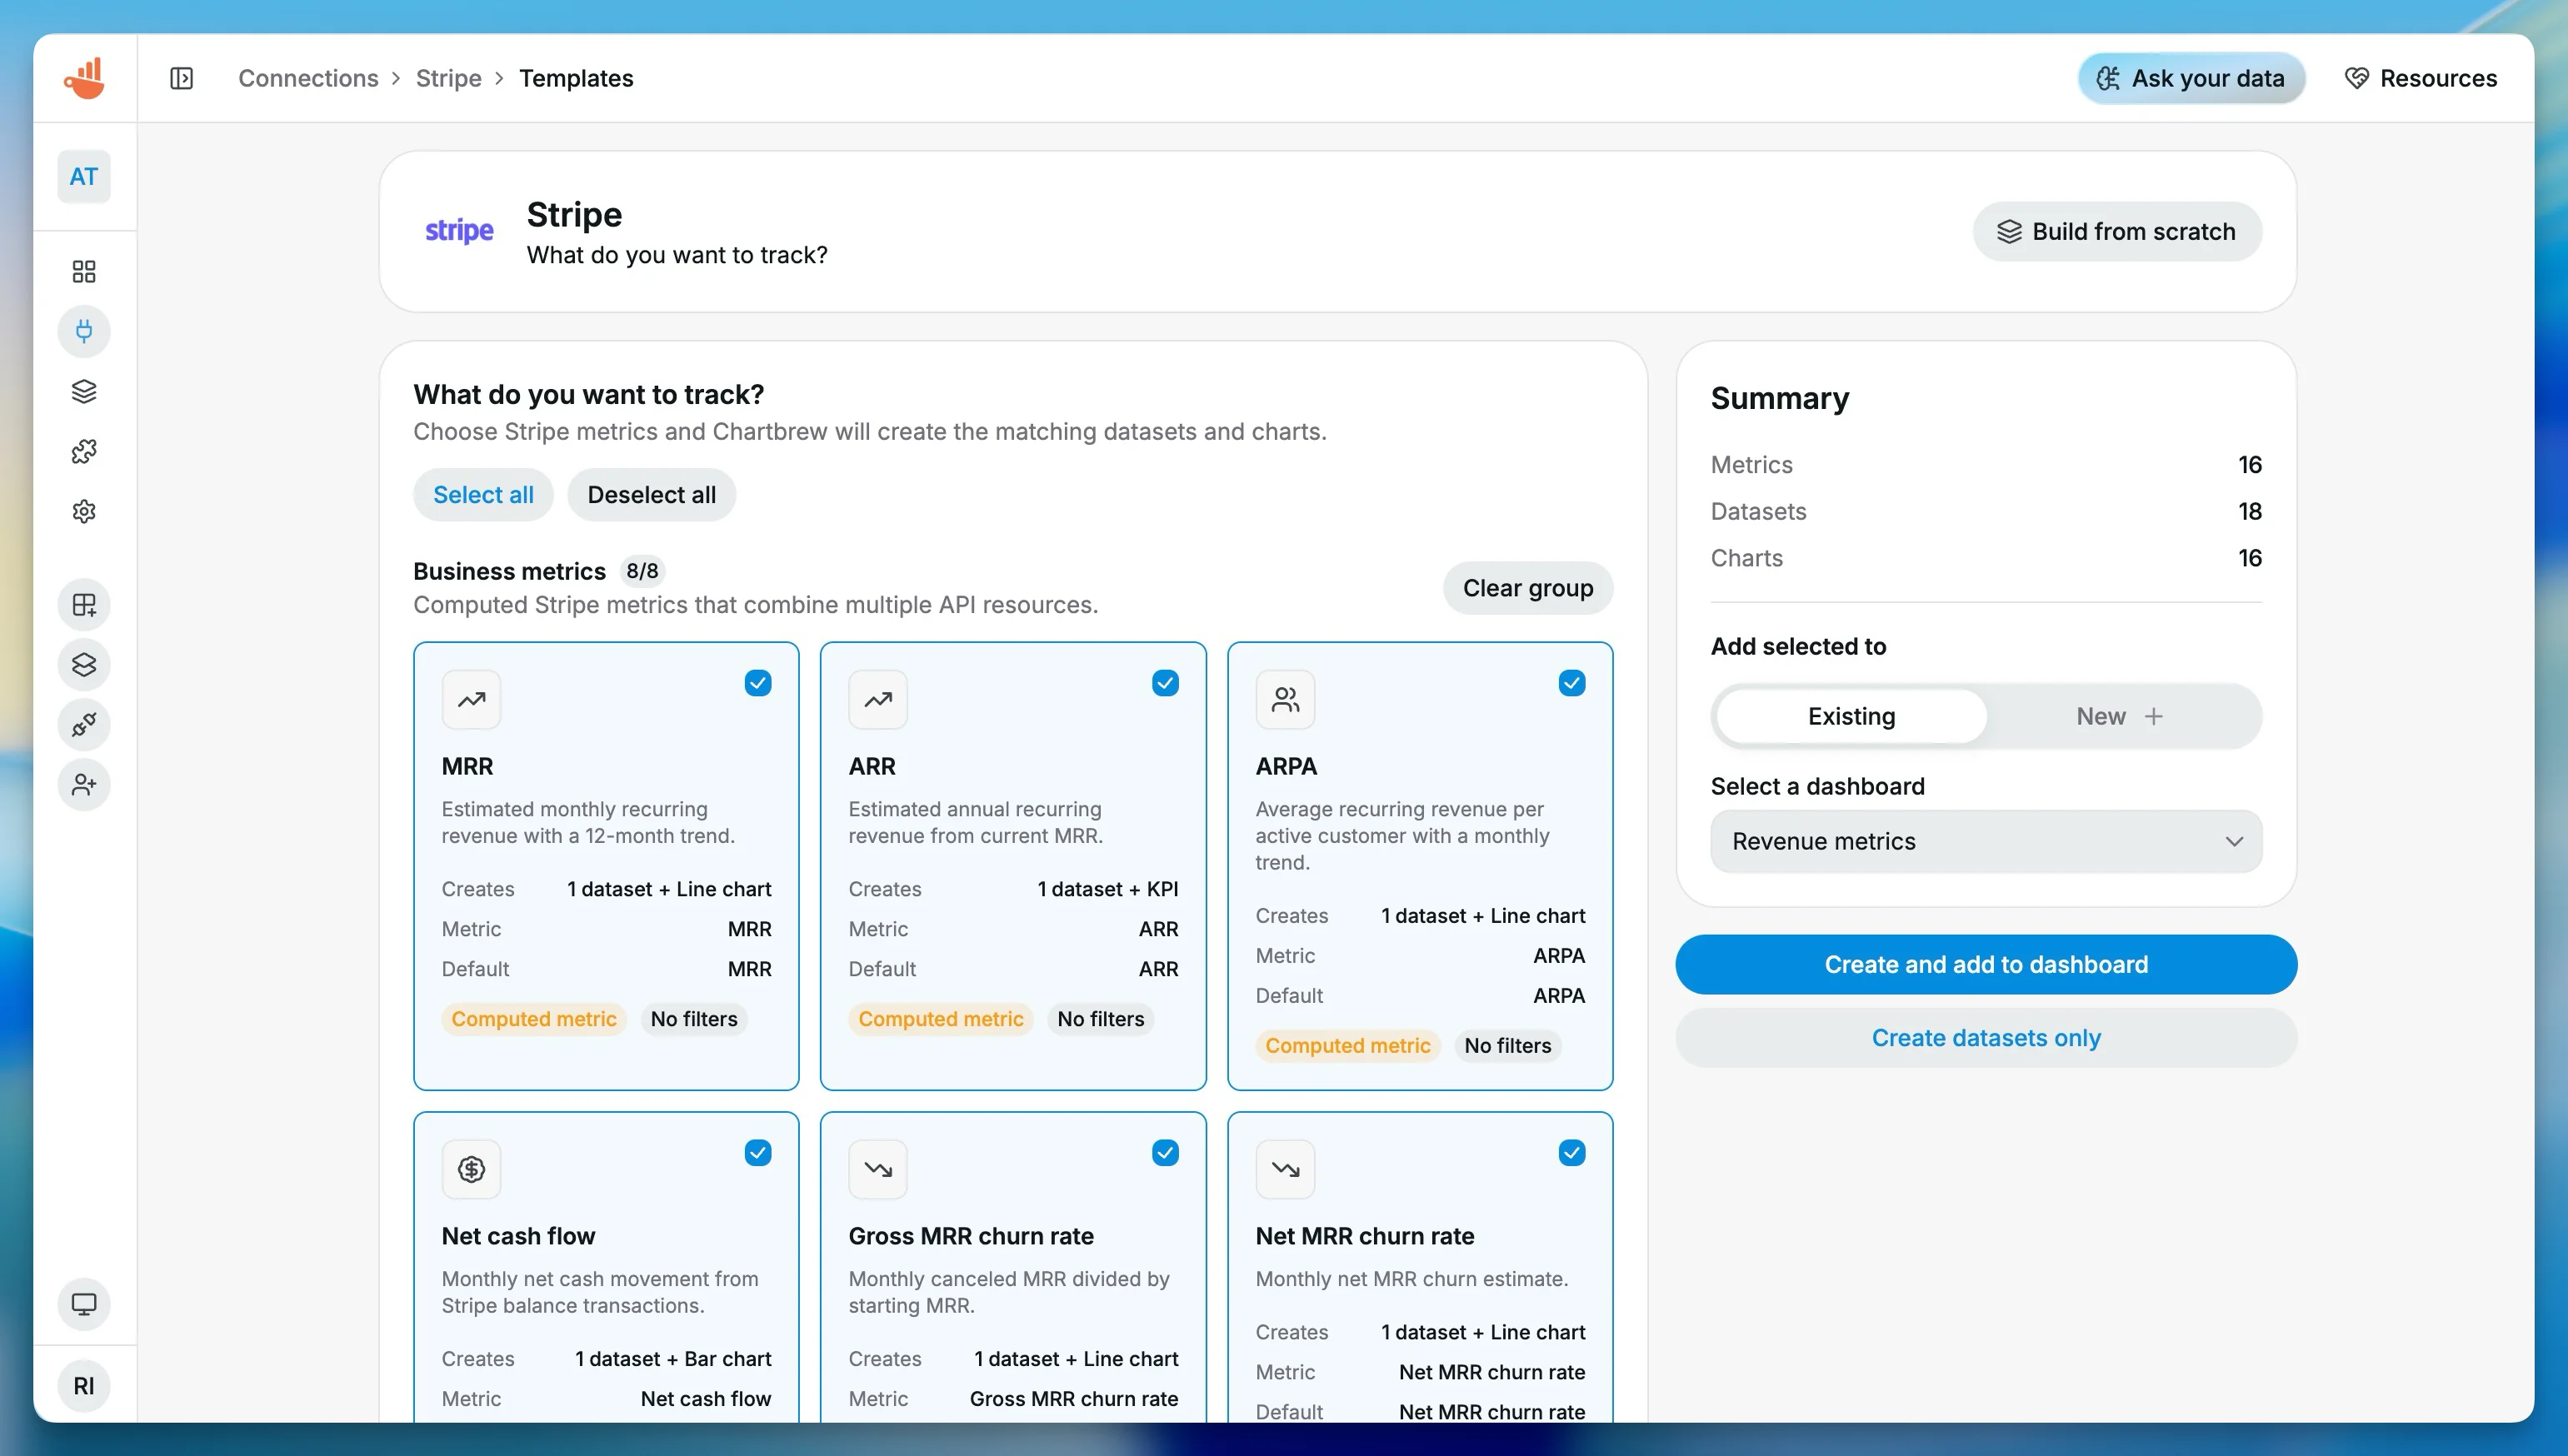
| Stripe Compiled Metrics | MRR, ARR, ARPA, net cash flow, gross MRR churn rate, net MRR churn rate, subscriber churn rate, estimated customer lifetime value |
Connect Stripe
Start in your Stripe dashboard by creating a secret key or restricted key. For production dashboards, I would usually reach for a restricted key with read access only to the Stripe objects you want Chartbrew to report on. The key should start with sk_ or rk_. A publishable key starting with pk_ will not work here because it cannot read the private Stripe data needed for dashboards.

Then open Chartbrew, go to your project, and select Stripe from the connection options. The new connection form only needs a recognizable name and the Stripe API key. Use something short like Stripe for the name, paste the key, then run Test connection before saving.
If the test succeeds, save the connection. At that point Chartbrew can use the same connection for all Stripe charts in that project.
Create the first dashboard
After saving the connection, open the Stripe template setup screen. You can add the generated charts to an existing dashboard or create a new one, for example Stripe Revenue.
For a first pass, I would start with the operational charts: net revenue, gross revenue, Stripe fees, active subscriptions, successful vs failed payments, refunds, latest payments, and open invoices. That gives you a useful dashboard immediately without turning the first setup into a modeling project.
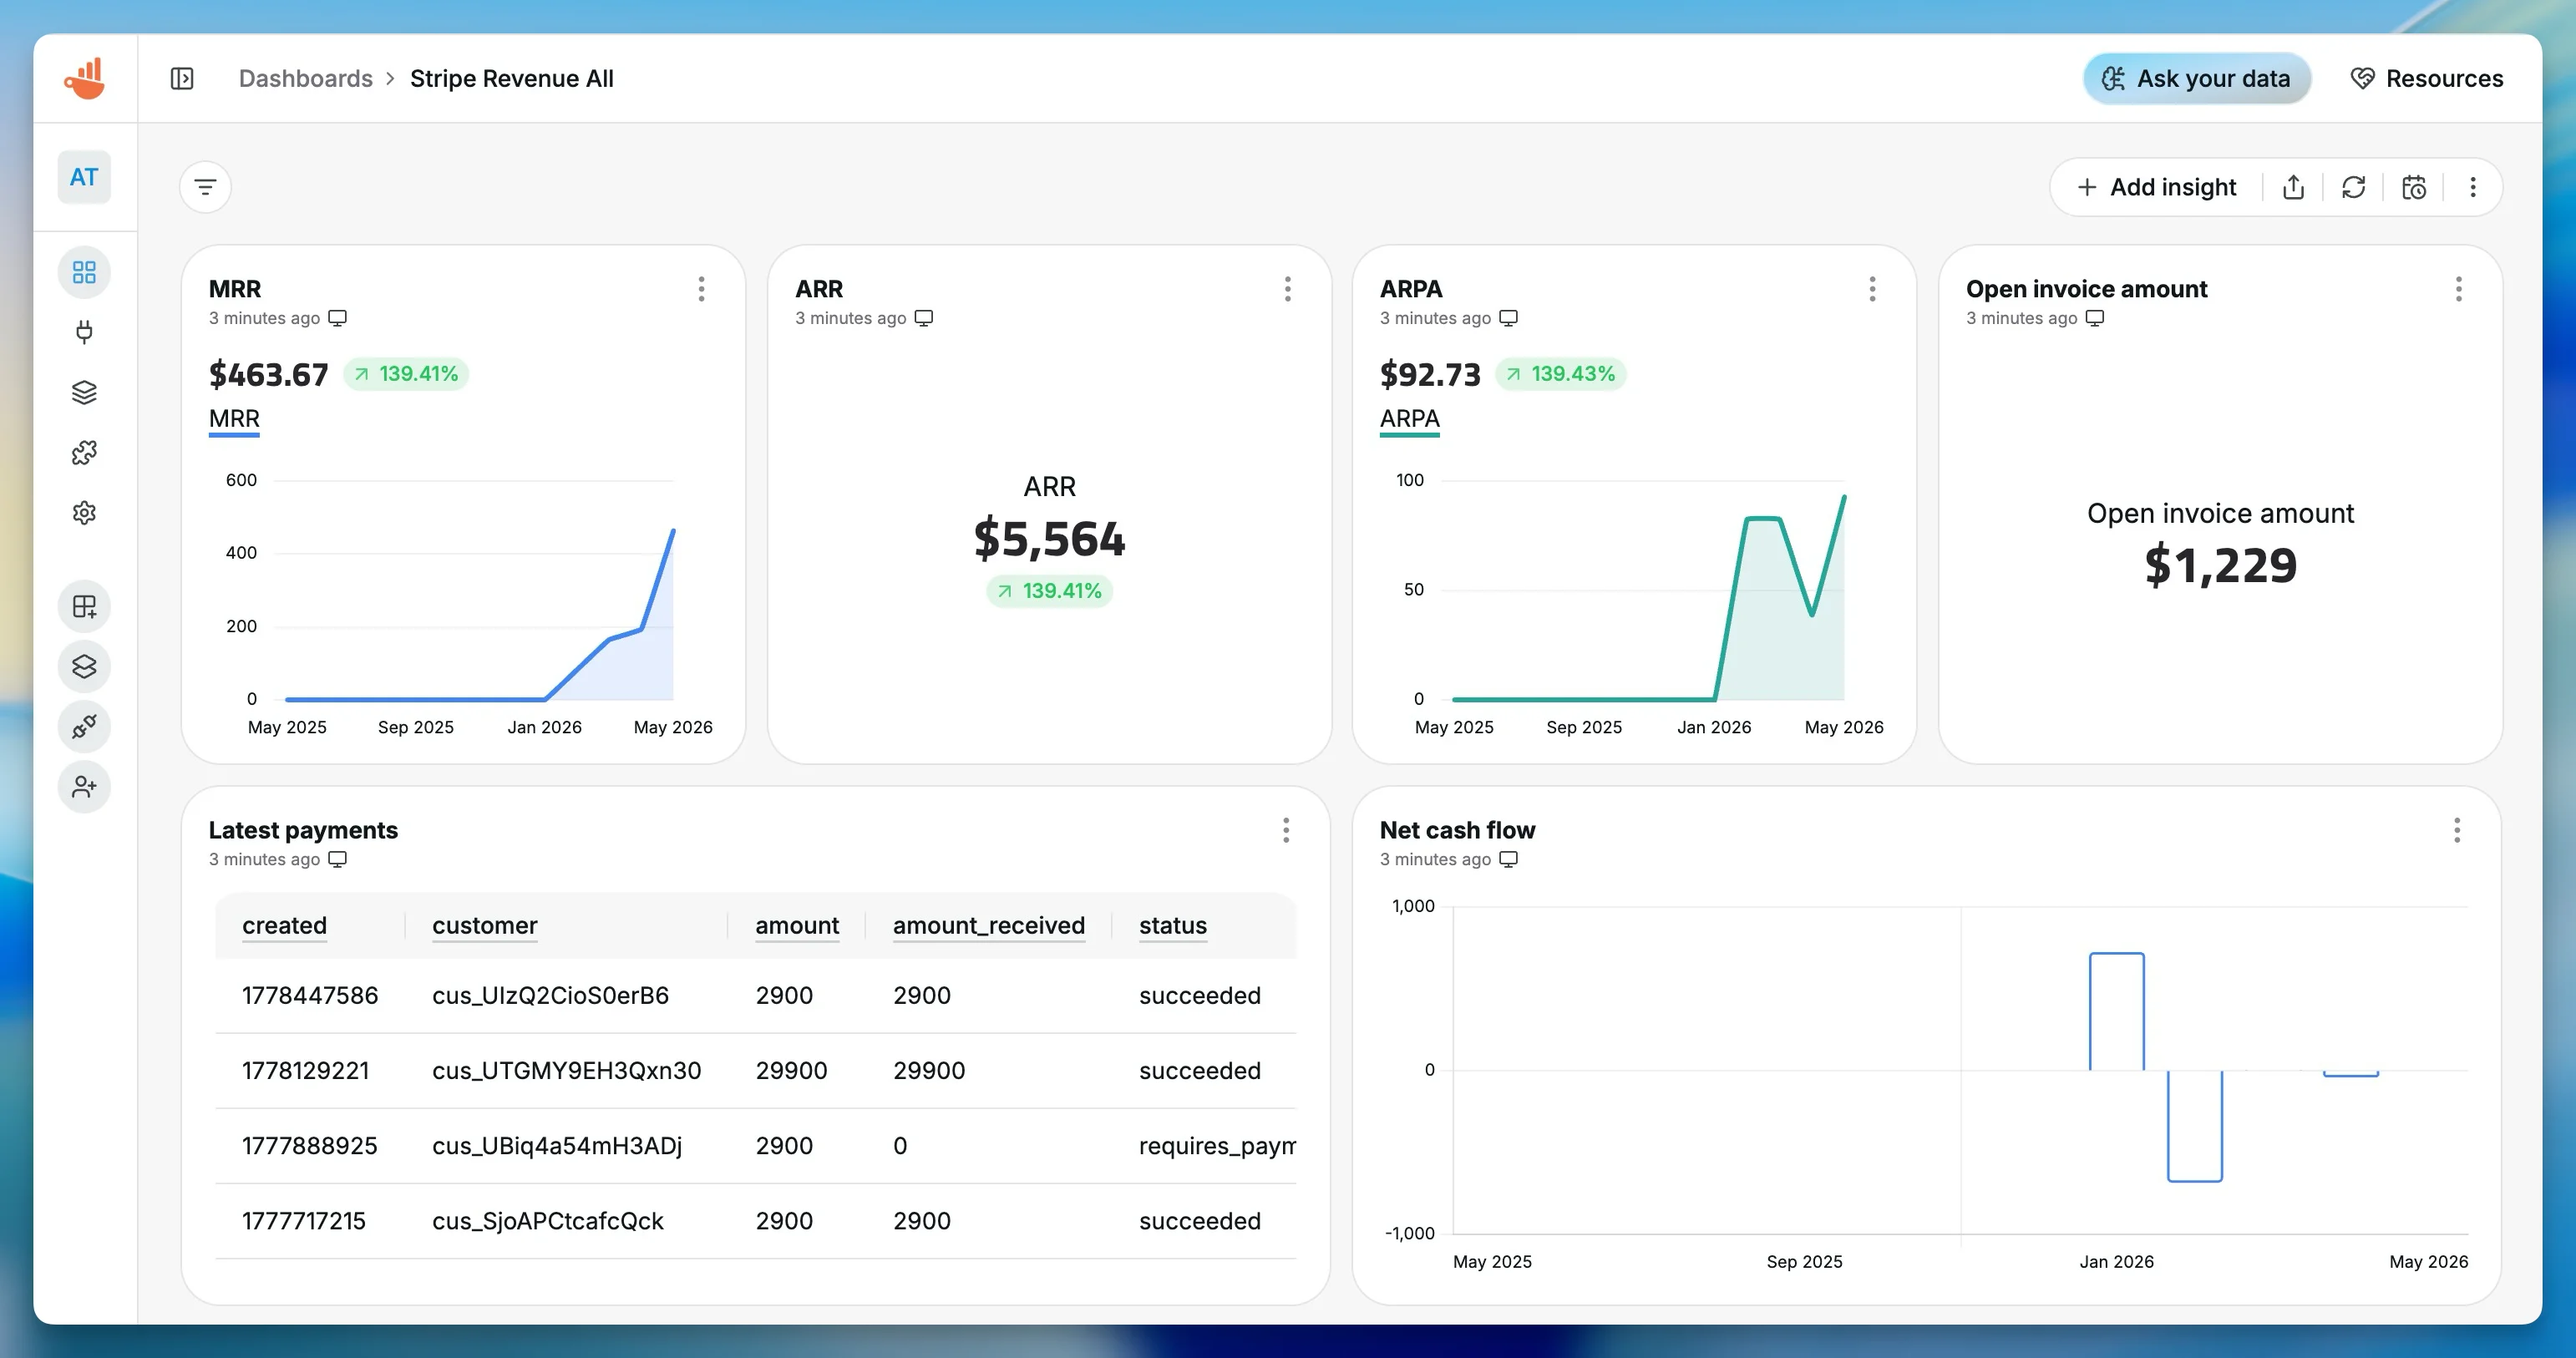
Once you create the selected charts, Chartbrew builds the datasets, links them to the Stripe connection, and opens the dashboard. The first thing to check is whether the numbers line up with the period you care about. Stripe amounts come back in minor currency units, such as cents for USD, so the templates apply display formulas where needed to make the charts readable.
Add subscription metrics
If subscriptions are a big part of your business, add the Stripe Compiled Metrics template next. This is where Chartbrew creates metrics that need more interpretation than a single Stripe object can provide, such as estimated MRR, ARR, ARPA, churn rates, net cash flow, and estimated customer lifetime value.
These charts are useful for product reviews, founder updates, and weekly operating dashboards. Treat them as directional analytics unless you have reconciled them against your accounting process.
Ask the AI assistant about Stripe data
Once the Stripe connection is in place, you do not have to start every investigation by deciding which Stripe object or metric to query. You can ask the Chartbrew AI assistant a business question and let it plan the Stripe dataset configuration for you.
This is useful when you know what you want to understand, but not the exact chart setup yet. For example, you might ask:
Show me failed Stripe payments over the last 30 days
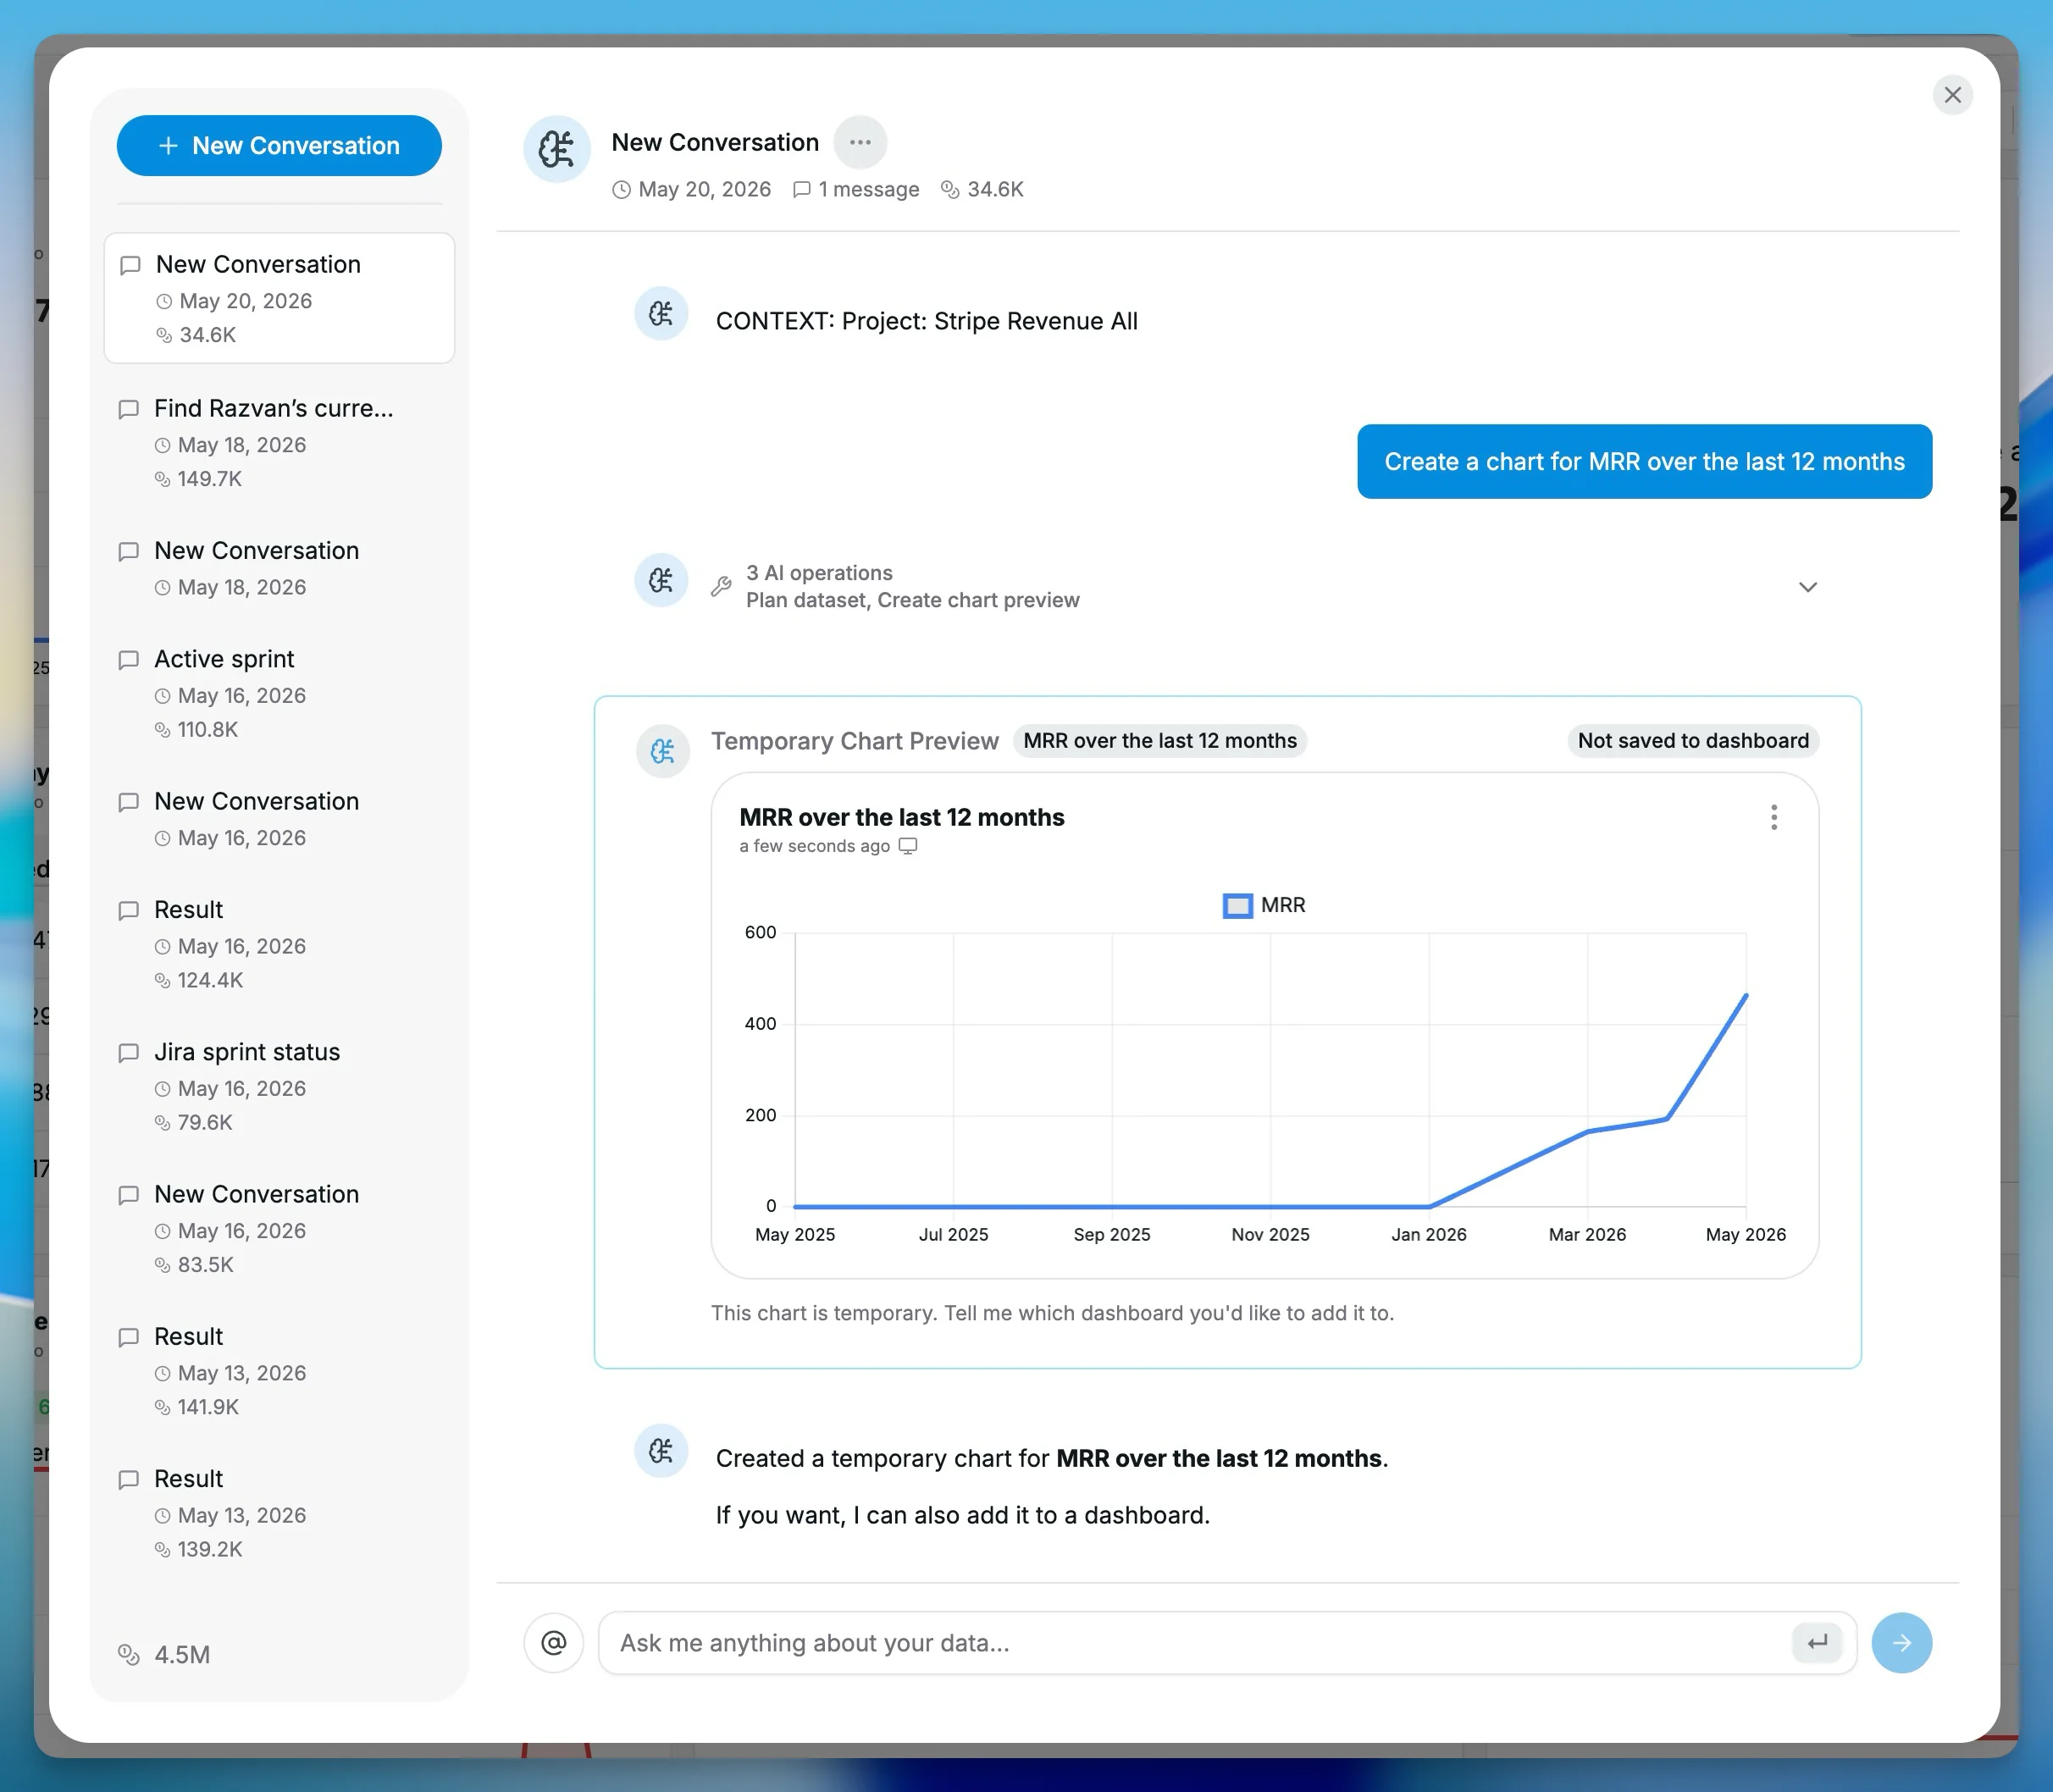
Create a chart for MRR over the last 12 months
Which open invoices need attention?
For Stripe questions, the AI assistant uses the Stripe source's own planning logic. That matters because metrics like MRR, ARR, ARPA, churn rates, net cash flow, and customer lifetime value should use the compiled Stripe metric mode rather than a generic payment or invoice aggregate.
The assistant can also create a temporary chart preview, so you can inspect the result before deciding whether to save it to a dashboard. I find this especially useful for follow-up questions: start with a revenue dashboard, ask about a spike or drop, then turn the useful answer into a chart if it is worth keeping.
Customize the Stripe charts
The generated dashboard is only a starting point. You can change chart types, adjust date ranges, add filters for status or currency, and combine Stripe charts with data from your database, product analytics, or marketing tools.
This is where Chartbrew becomes more useful than a single-purpose Stripe report. A SaaS dashboard can put MRR next to product activation. A finance follow-up dashboard can put open invoices next to CRM or support data. A founder dashboard can keep revenue, failed payments, refunds, and active subscriptions together in one place.
If you need the same Stripe dashboard to work across different teams, products, currencies, or customer groups, add dashboard filters and variables after the first version is working.
Stripe dashboard ideas
These are the dashboard shapes I would start with before adding more detail:
| Dashboard | Useful charts |
|---|---|
| Revenue overview | Net revenue, gross revenue, fees, refunds, net cash flow |
| Subscription health | MRR, ARR, ARPA, active subscriptions, churn rate, new subscriptions |
| Payments operations | Successful payments, failed payments, latest payments, refunds |
| Finance follow-up | Open invoice amount, open invoices, payouts, balance transactions |
| Founder dashboard | Revenue KPIs, active subscriptions, failed payments, latest payments |
FAQ
Can Chartbrew connect directly to Stripe?
Yes. Chartbrew has a dedicated Stripe source that connects with a Stripe secret key or restricted key. You can use it to create Stripe dashboards, payment charts, subscription charts, invoice tables, and revenue metrics.
What Stripe API key should I use with Chartbrew?
Use a Stripe secret key starting with sk_ or a restricted key starting with rk_. For production reporting, a restricted read-only key is usually the better choice.
Can Chartbrew calculate MRR from Stripe?
Yes. The Stripe Compiled Metrics template includes estimated MRR, ARR, ARPA, churn metrics, net cash flow, and estimated customer lifetime value. These are operational analytics metrics and should be reconciled before accounting use.
Can I use AI to ask questions about Stripe data?
Yes. The Chartbrew AI assistant can plan Stripe datasets and create temporary chart previews from questions such as failed payments, MRR trends, open invoices, refunds, churn, or net cash flow.
Can I combine Stripe data with other sources?
Yes. Stripe charts can live on the same Chartbrew dashboard as charts from databases, APIs, Google Analytics, Supabase, MongoDB, PostgreSQL, MySQL, and other sources.
Conclusion
The new Stripe source should make Stripe reporting feel less like API setup and more like dashboard building. Connect the key, create the starter charts, check that the generated numbers match the period you care about, and then customize from there.
If you want to make the dashboard interactive for clients or teammates, the next step is to add dashboard filters or create a shareable report. You can also learn how to use variables in Chartbrew to reuse the same charts across different dashboard contexts.
