
In Chartbrew, variables let you replace fixed values in queries, filters, dashboards, embeds, and reports with placeholders that can change depending on the context. This allows you to reuse the same charts for different scenarios without editing the configuration each time.
A variable is a named placeholder wrapped in double curly braces, for example {{startDate}}. When a chart runs, Chartbrew will replace it with the value you’ve set in the editor, through a dashboard filter, via URL parameters in an embed or report, or from a default value.
Using Variables in a Query
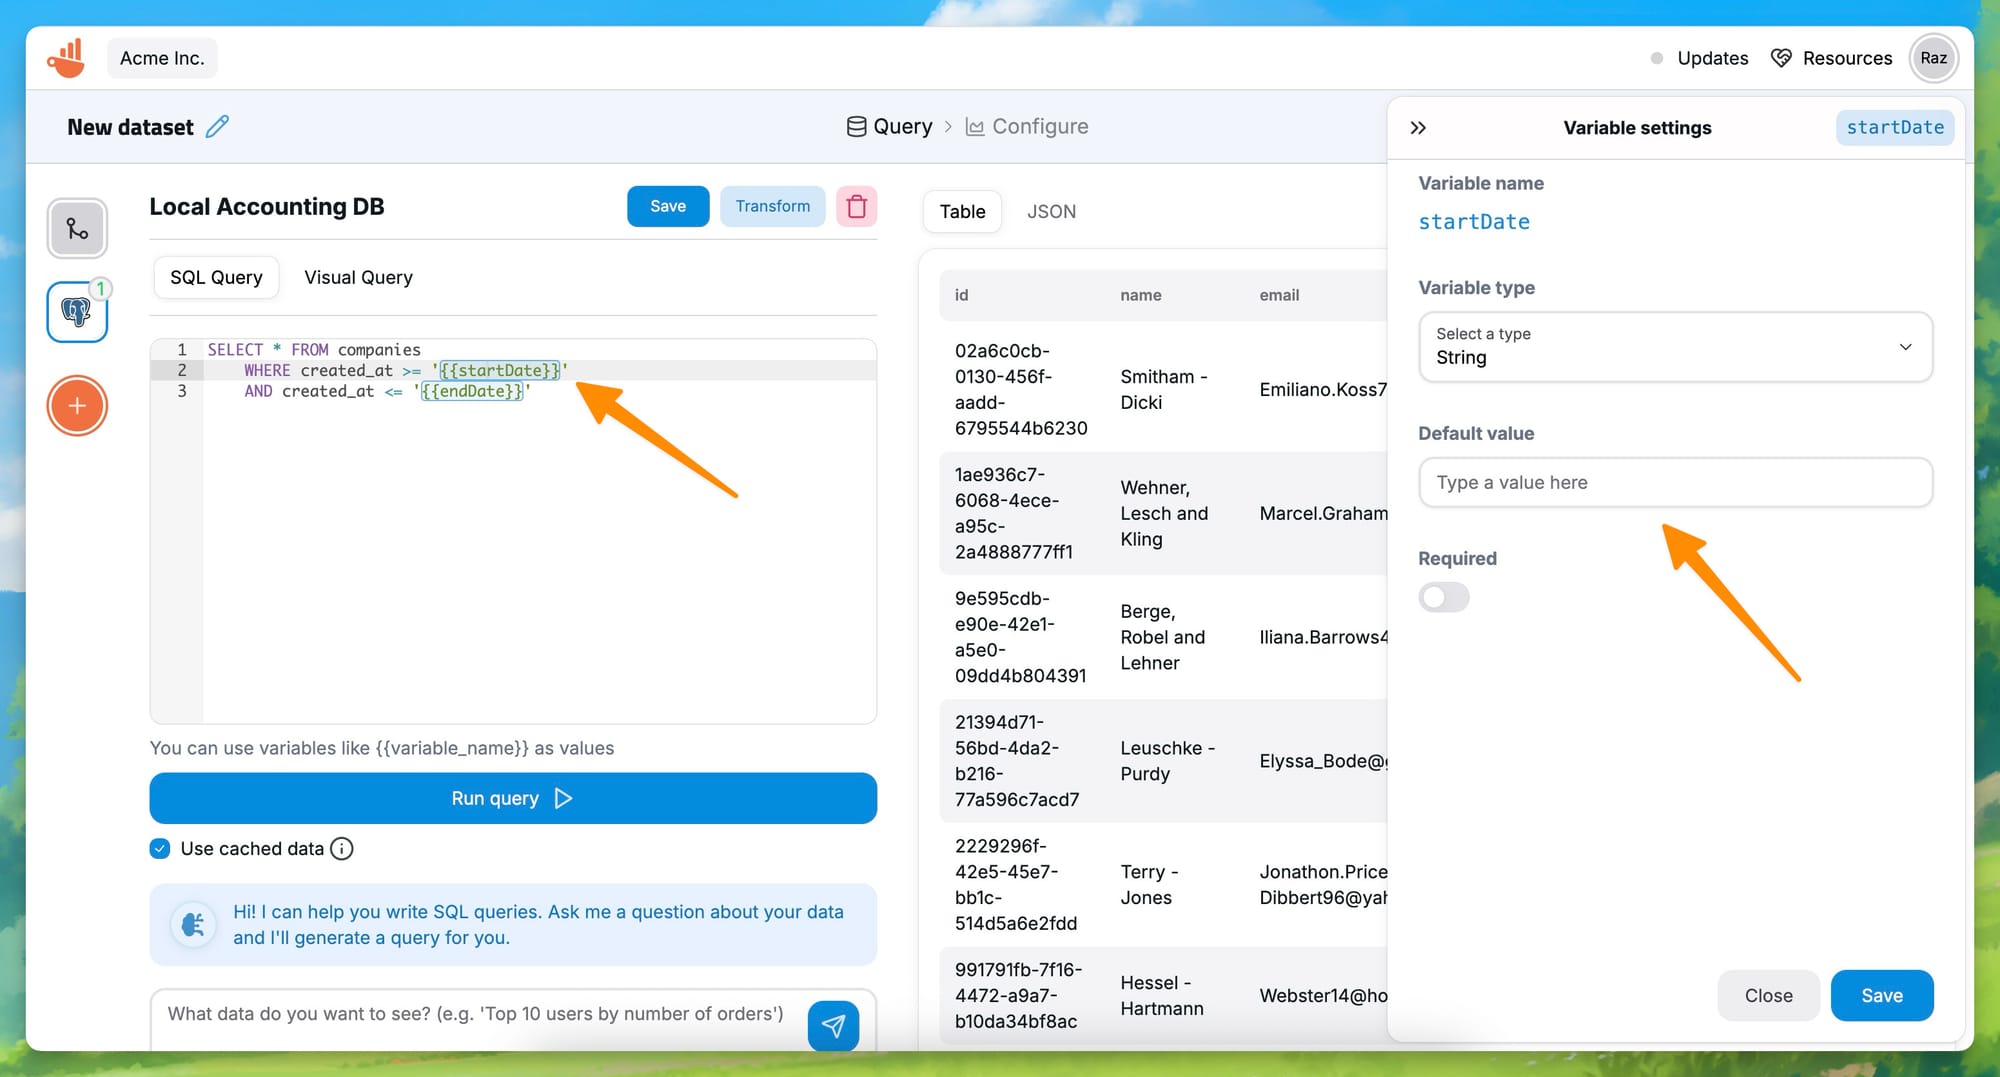
You can place variables directly into your queries. For example, in a PostgreSQL dataset:
SELECT * FROM companies
  WHERE created_at >= '{{startDate}}'
  AND created_at <= '{{endDate}}'
Adjusting startDate and endDate will change the timeframe instantly, making the chart responsive to different date ranges without rewriting the SQL. The query variables are available in the following places:
- MySQL-based connections
- Postgres-based connections
- Firestore filters
- RealtimeDatabase route
- API - route, body, headers, parameters
When typing a variable in a designated field or text box, Chartbrew will automatically detect the variable and prompt you to set it up by clicking on it. When editing a variable, you can set a default value, the type, and whether they are required or not (if required, the query will fail when missing a value).
Using Variables in Dataset Filters
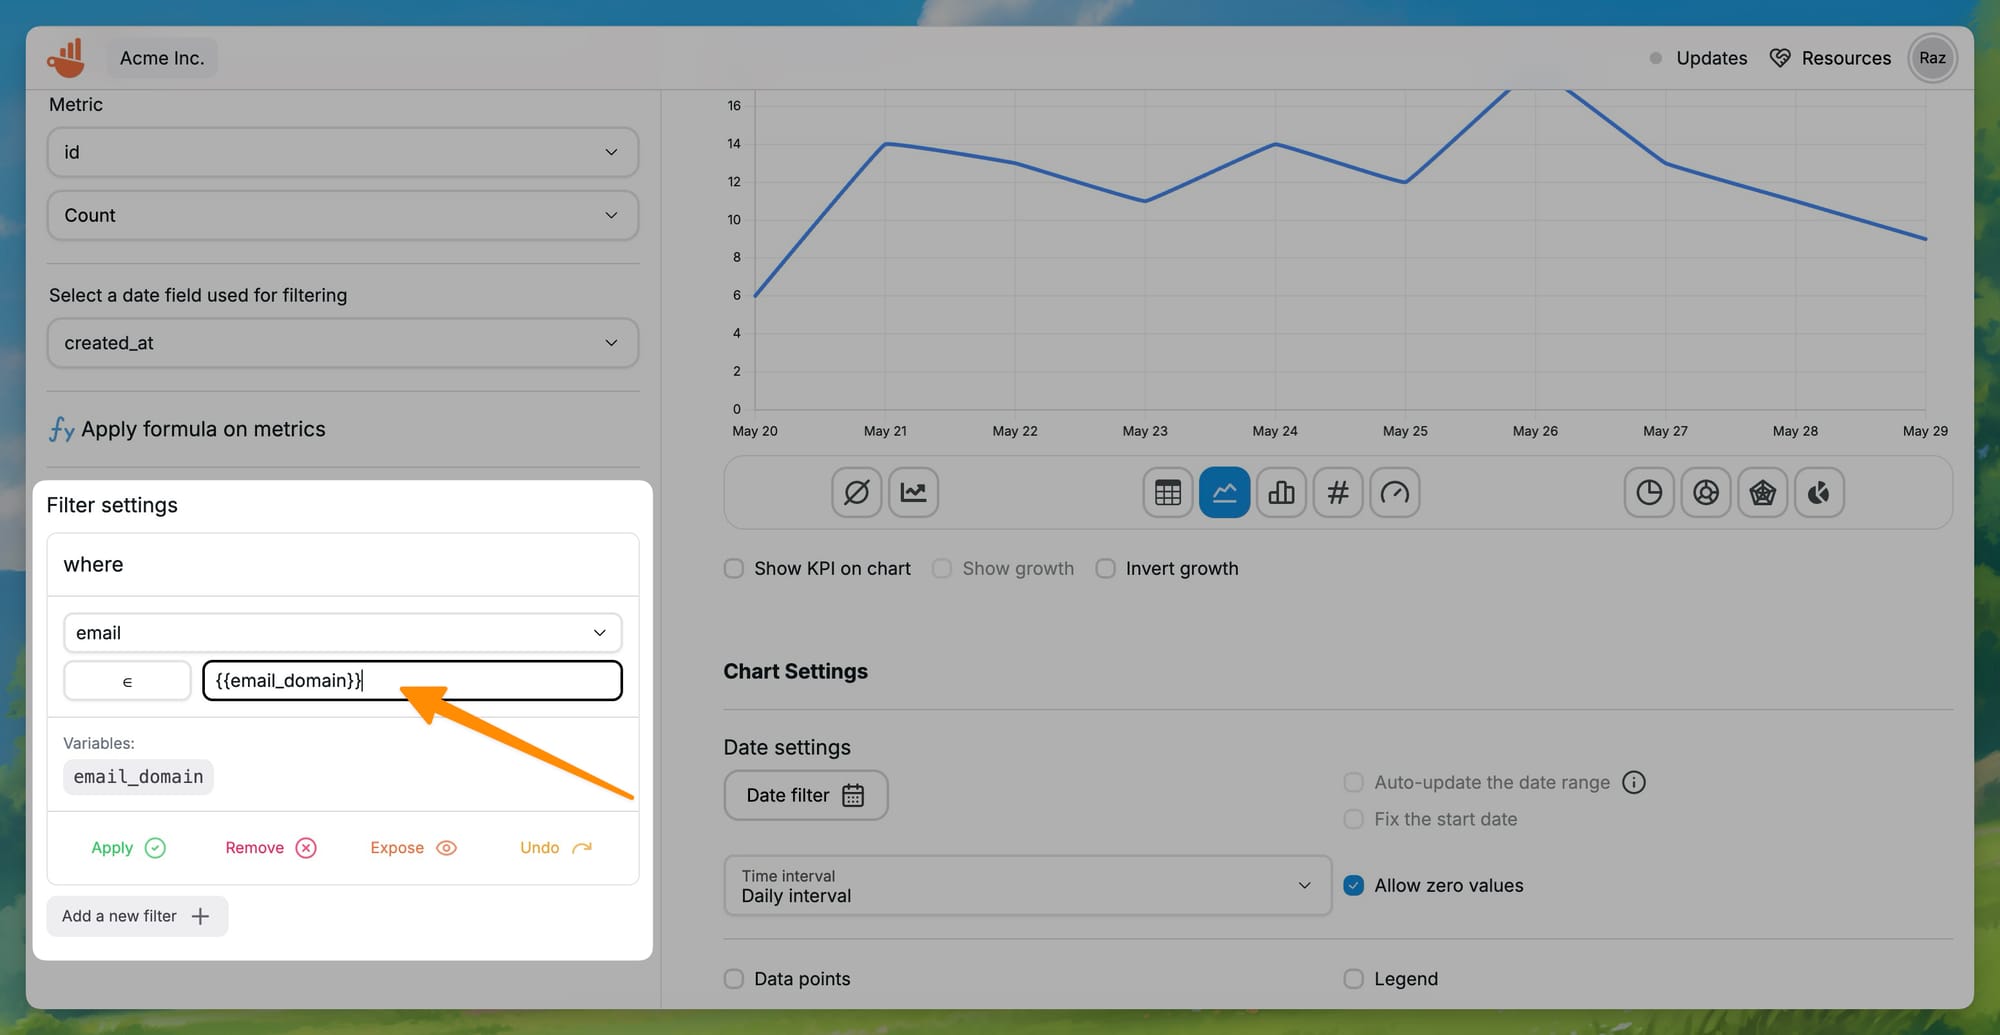
Like before, Dataset Filters can have variables assigned to them, and then have dashboard filters or URL parameters insert values to filter the data. With the addition of the new variable system, the dataset filters have been updated to use the new variables.
You can now start typing variables straight in the value field. When a variable is detected, Chartbrew will show the available variables and let you configure them on the spot.
Creating Variable Dashboard Filters
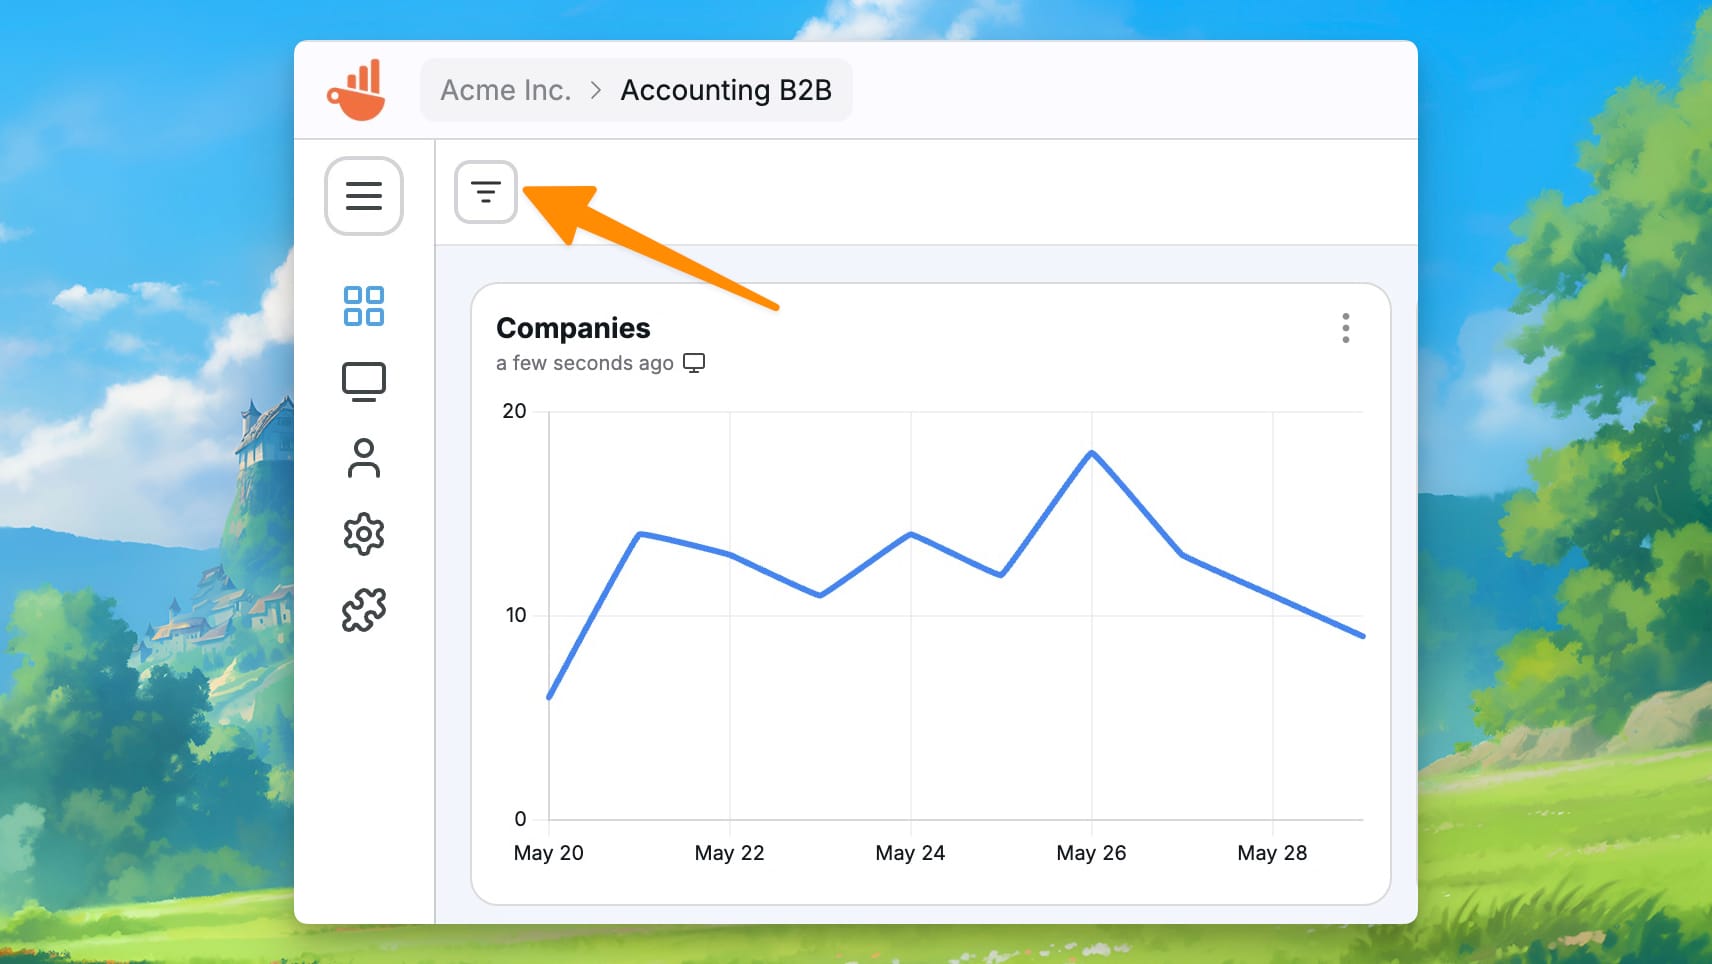
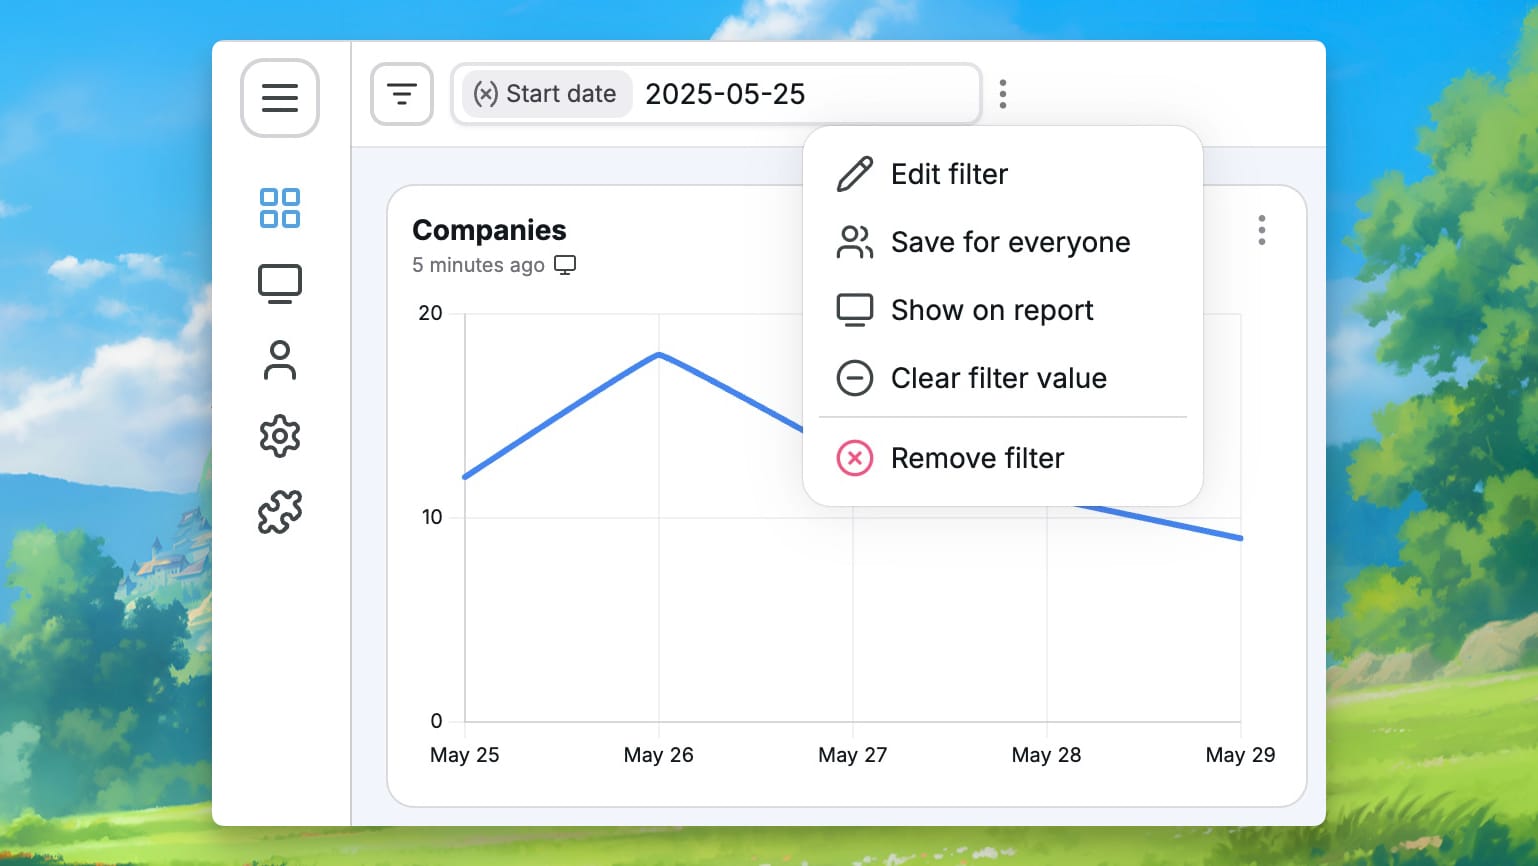
Dashboard filters connect directly to variables in datasets. Adding a filter with the same name as a variable will link them automatically, so changing the filter updates every chart using that variable. This is ideal for controlling date ranges, categories, or other parameters across multiple charts at once. To set up a filter, access one of your dashboards and then press the filter button at the top:
Select the Variable type in the filter settings, and then match the variable name for Chartbrew to know which variables to replace for you.
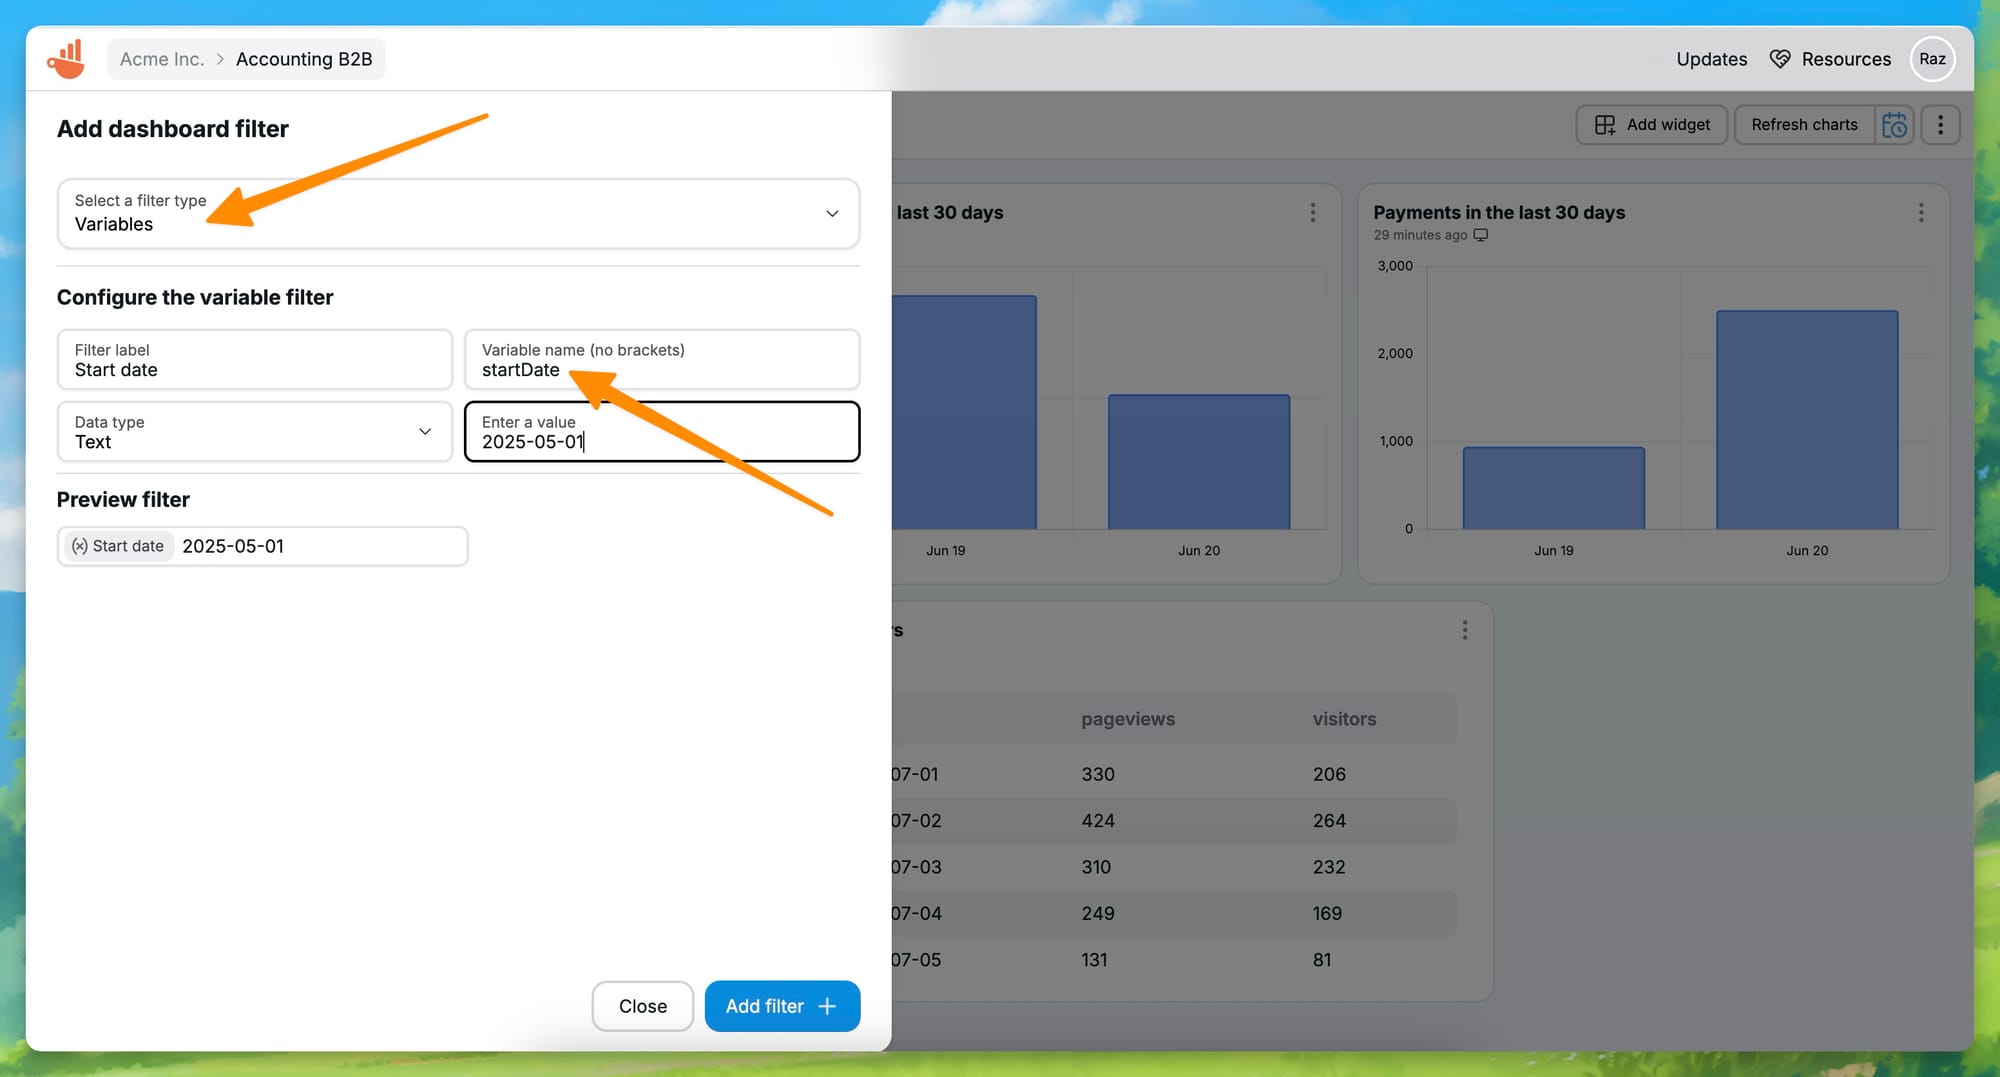
Once set up, you can interact with the filter and change the value on the fly. Moreover, you can also save this filter to appear to everyone in your team or even on the report so all viewers can interact with it. If you make it available on the report, it will work even when embedding the report on your site.
Setting Variables in the Chart Editor
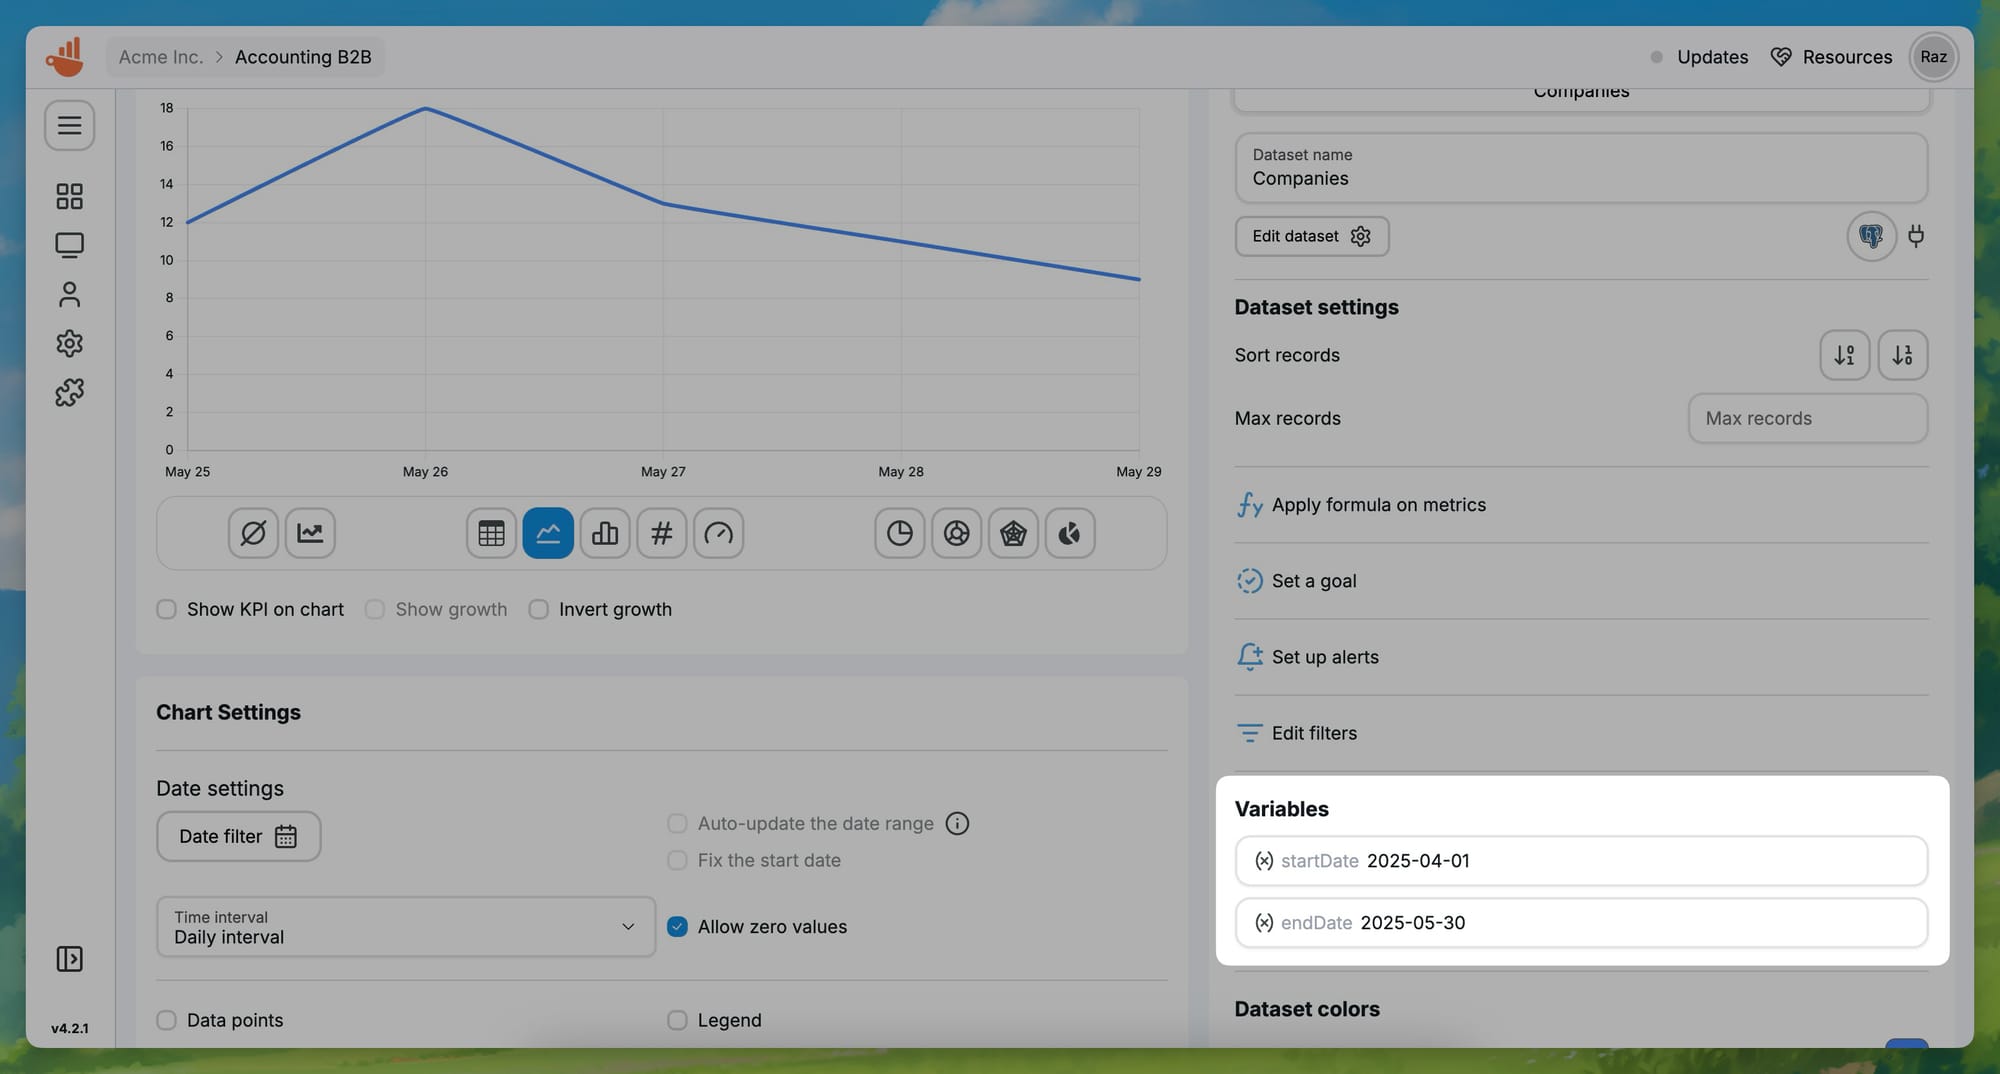
If you don't want to expose filters and add them to the dashboard level, you can even pass values through individual charts.
Within the chart editor, the Variables section lists all variables used in the dataset query or filters. You can set test values here to preview how the chart responds before publishing, ensuring that your setup works for different inputs. Charts that have custom variables will have an indicator icon on the dashboard.
Passing Variables to Embedded Charts
Embedded charts can receive variable values through URL parameters, such as:
https://app.chartbrew.com/chart/3b2a5538-6895-4856-8933-ef1e0c67a820/embedded?country=FR&startDate=2025-08-01
This approach lets you use one embed in different contexts but display data relevant to each audience.
Passing Variables to Reports
Reports accept variables in the same way as embeds. Adding query parameters to the report URL changes the displayed data without creating multiple report versions.
<iframe src="https://app.chartbrew.com/b/abc_123?country=FR&startDate=2025-08-01" allowTransparency="true" width="1200" height="600" frameborder="0" style="background-color: #ffffff"></iframe>
Conclusion
Variables in Chartbrew provide a straightforward way to make charts, dashboards, embeds, and reports adaptable. In conjunction with dashboard filters or embedding parameters, the variables can make visualizations reusable for different user groups or allow for faster data exploration internally.
Want to do more with Chartbrew? Learn how to set up automated dashboard snapshots next.
