
Chartbrew v5 is here: a faster, cleaner, more polished reporting experience
Chartbrew v5 is now available, and this is one of the biggest product updates we have shipped in a while.
This release is not just a visual refresh. It touches almost every part of the app, from dashboards and chart creation to datasets, query editing, email templates, access control, and the underlying developer experience.
The main goal behind v5 was simple: make Chartbrew feel easier to use every day.
As teams build more dashboards, connect more data sources, and share more reports with clients or stakeholders, the product needs to stay clear and predictable. Chartbrew v5 lays the groundwork for that.
A complete UI refresh
The most obvious change in v5 is the new interface.
Chartbrew has been migrated to a new component system, which gave us the chance to revisit a lot of the product surface. Dashboards, chart editing, settings, modals, tables, forms, connections, navigation, and other core areas now feel more consistent and modern.
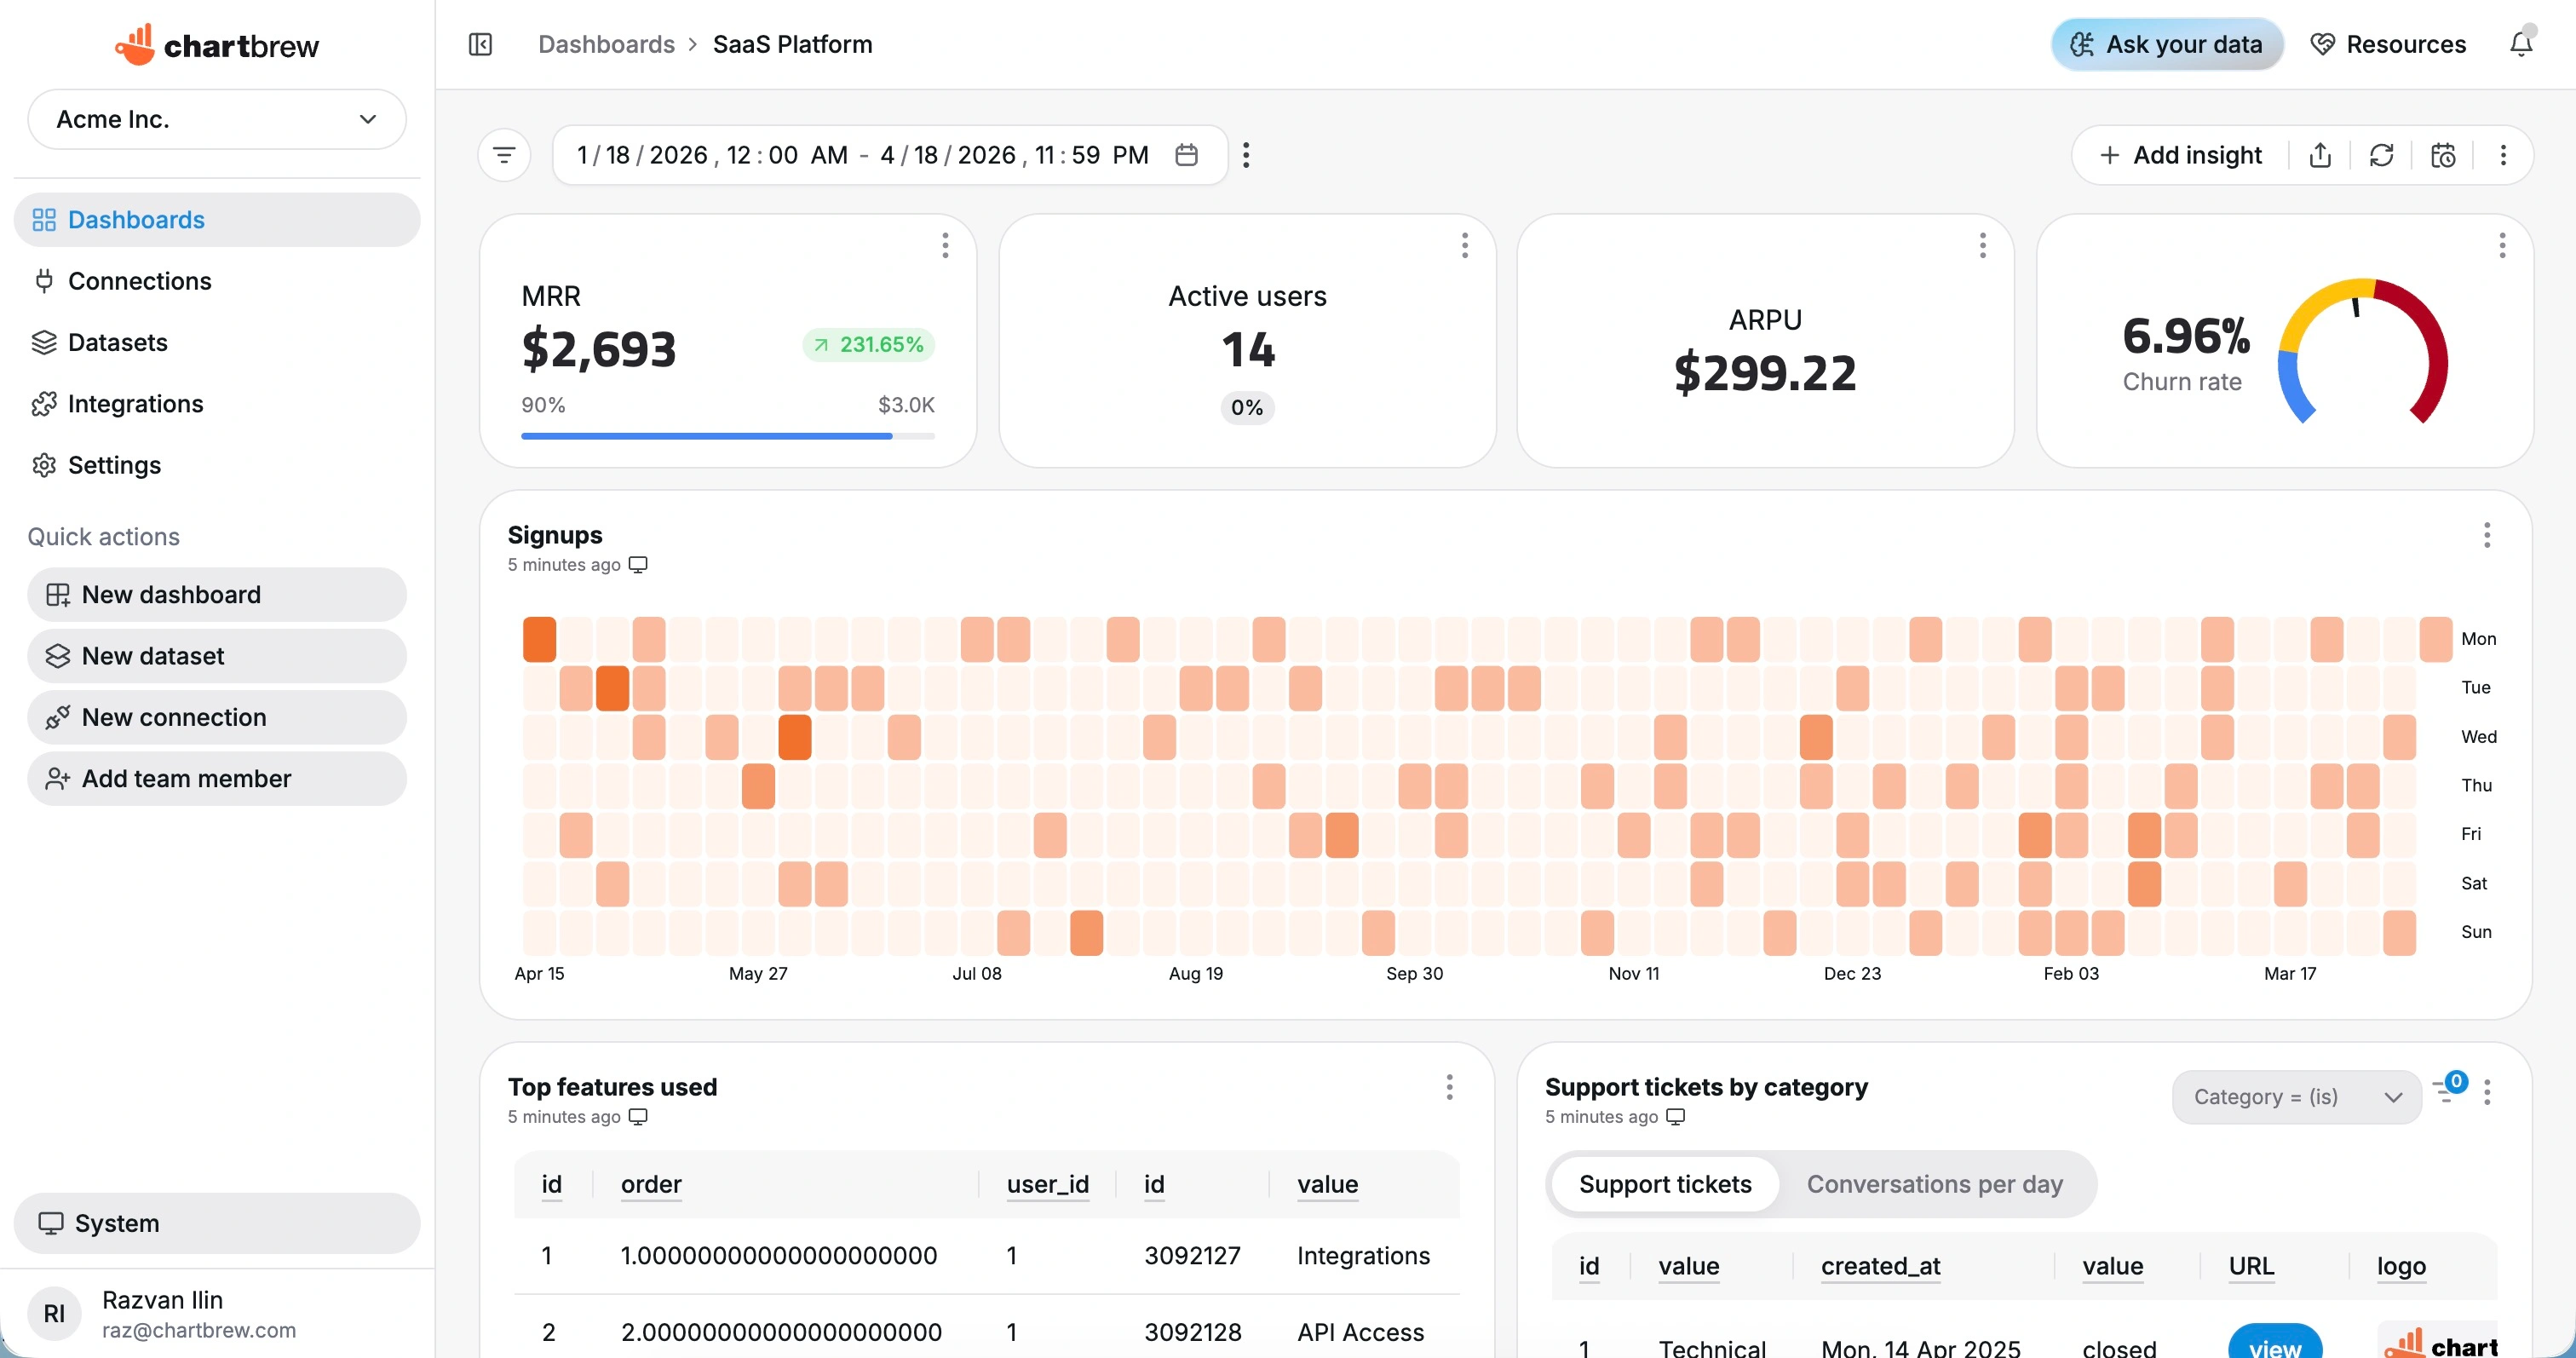
The dashboard experience in particular feels much cleaner. Controls and filters are easier to spot, charts feel better placed, and the overall layout is easier to scan.
This is the kind of update where almost everything feels a little better. Some parts look completely new, while others simply feel smoother and more polished.
A clearer dataset and chart creation flow
One of the most important changes in v5 is how Chartbrew separates datasets from visualization settings.
Previously, datasets carried more of the chart setup with them. In v5, the dataset is focused on the data itself, including requests, joins, fields, and transformations. The visualization layer, such as metrics, dimensions, labels, colors, and series-level settings, now belongs in the chart editor.
This makes datasets more reusable and reduces second-guessing when building charts.
The dataset setup flow has also been simplified. Query and join settings are now separated more clearly from data request settings, which should make the experience easier to follow, especially when working with more advanced datasets.
Once a dataset is created, the path to turning it into a chart is more direct too. The new chart creation flow includes a clearer dataset picker, making it easier to find and reuse existing datasets instead of creating duplicate work.
Better dashboards from the first screen
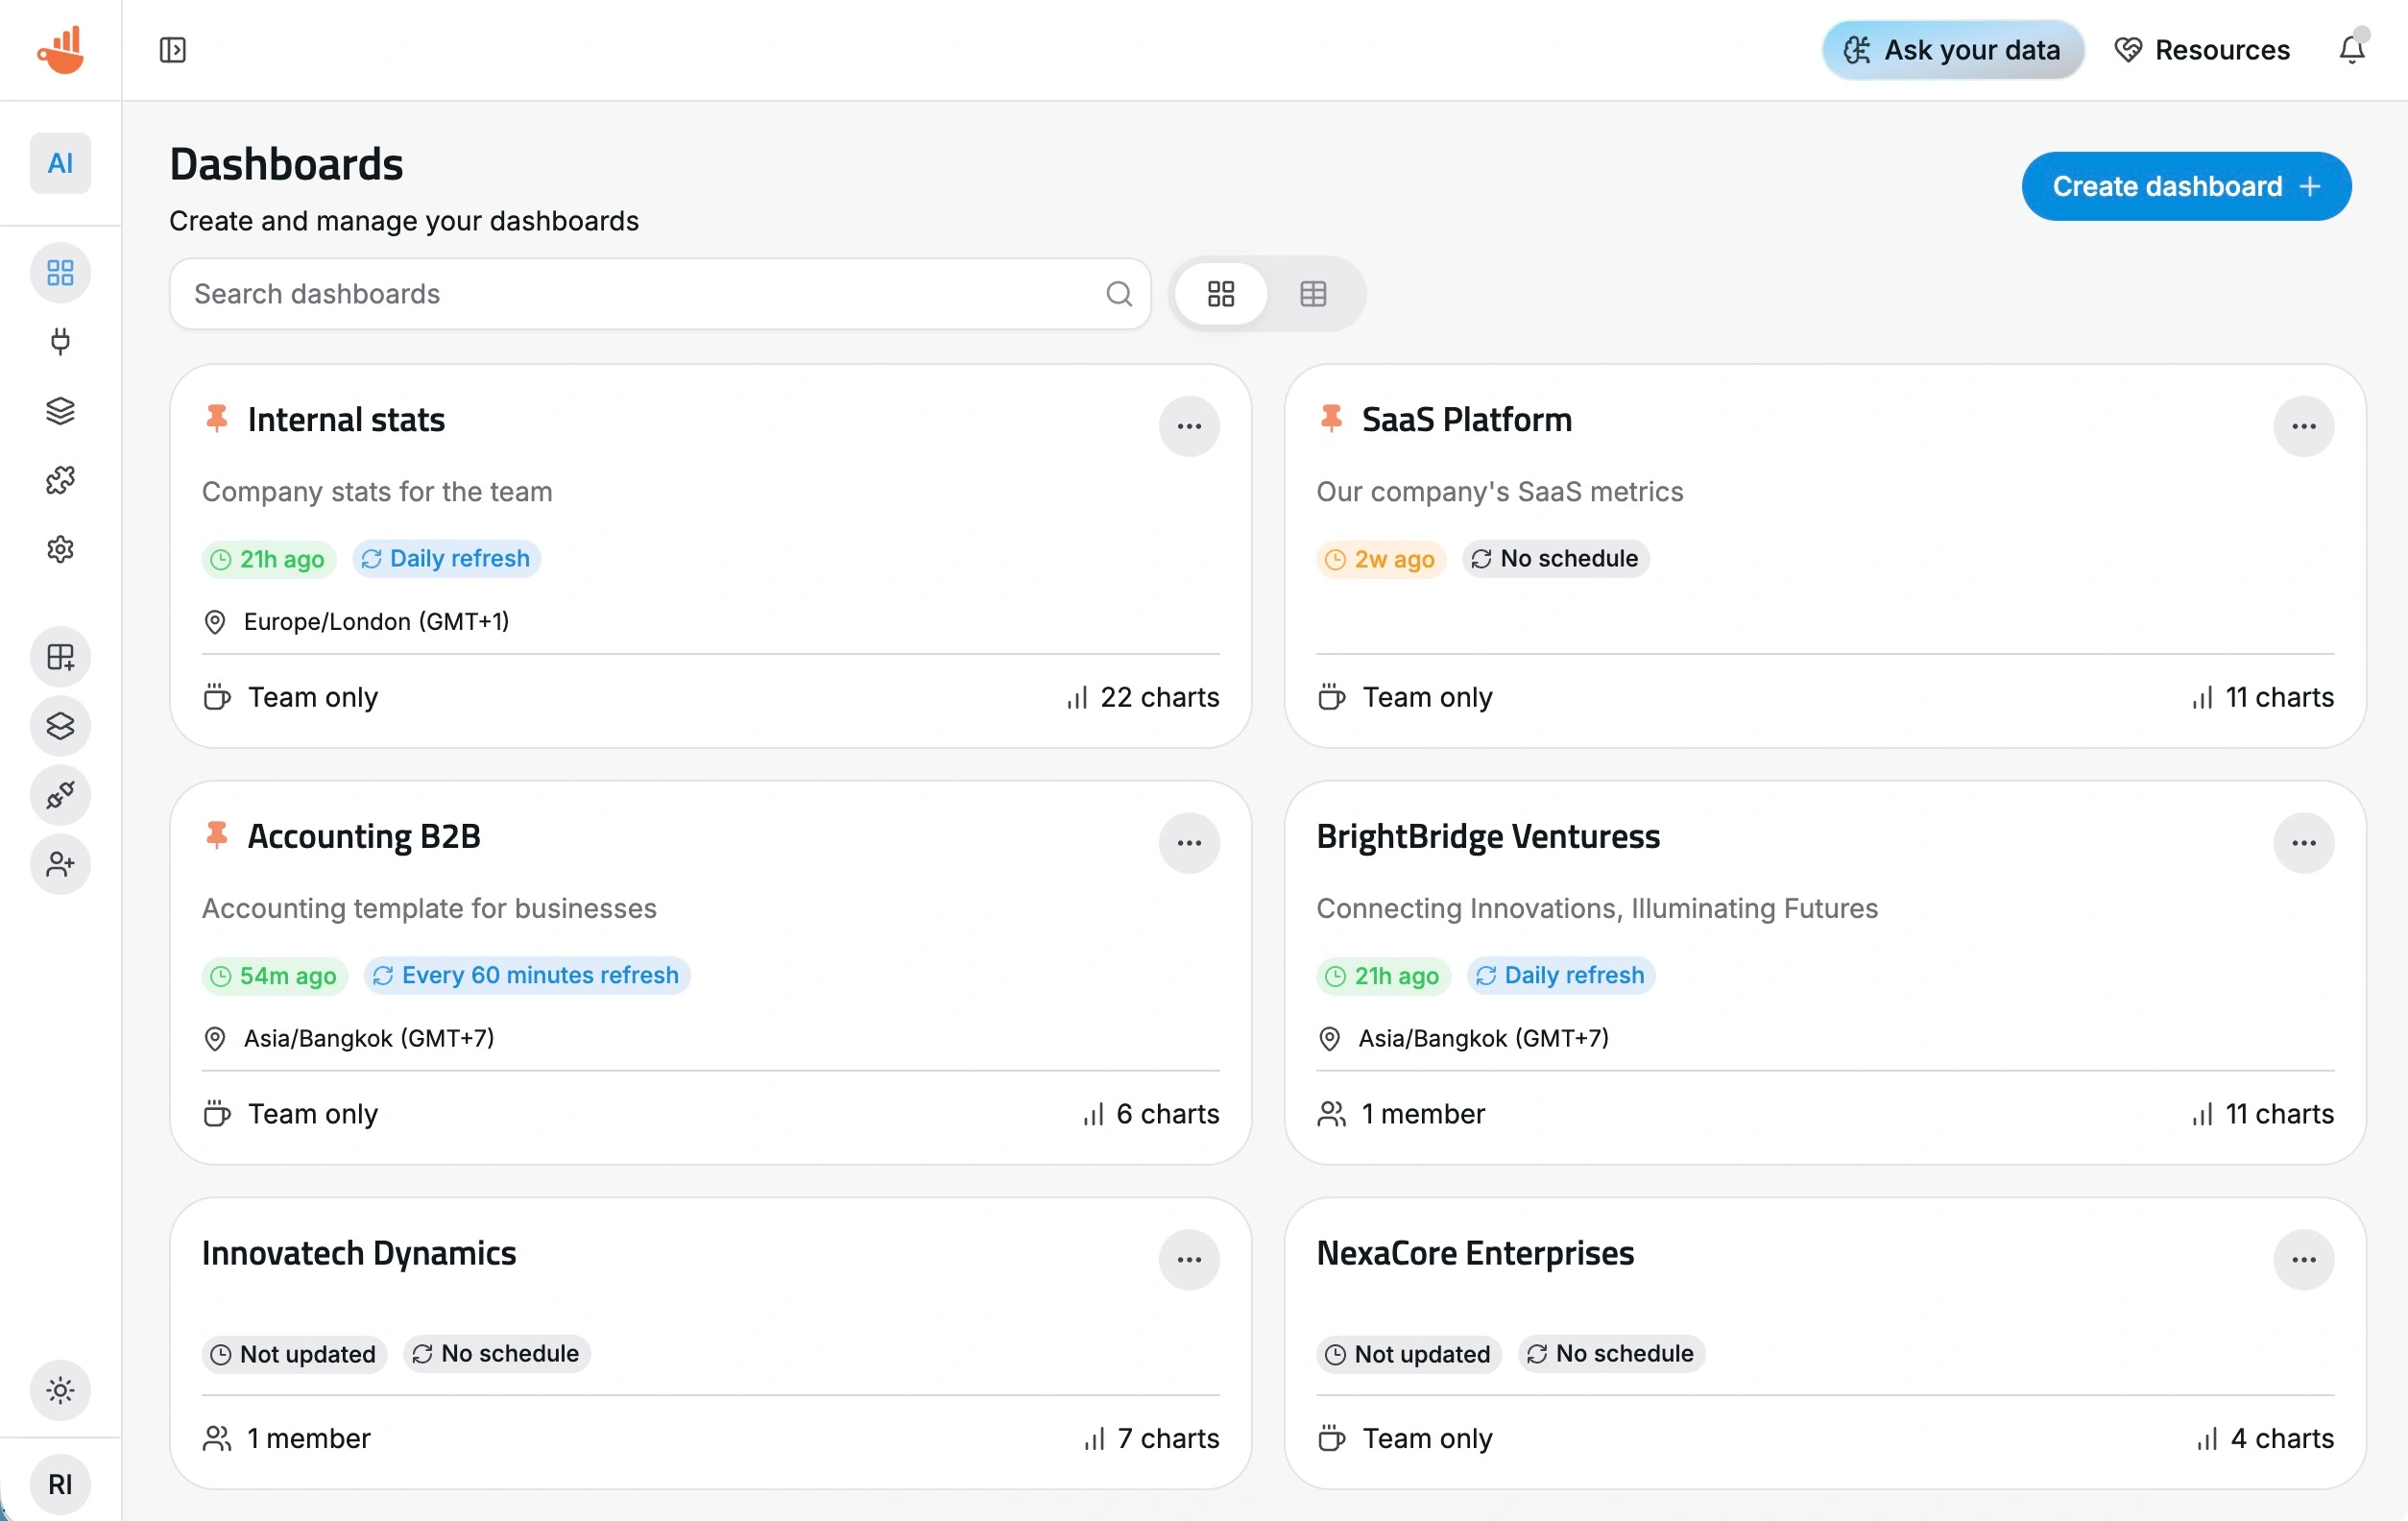
Dashboard and dataset cards now show more useful information about updates, making it easier to understand when data last changed and what needs attention.
This is a small change, but it matters when you manage multiple dashboards or use Chartbrew for recurring reporting. You should not have to open every dashboard just to understand whether things are fresh.
We also improved timezone behavior across dashboard updates and snapshot scheduling. This should make scheduled refreshes and reports more predictable across teams working in different locations.
A new "Discover" area
Chartbrew v5 introduces a new Discover panel inside dashboards.
This gives us a better place to highlight product updates, tutorials, tips, and new features directly inside the app. Instead of relying only on release notes, emails, or Discord messages, useful updates can now appear where people are already working.
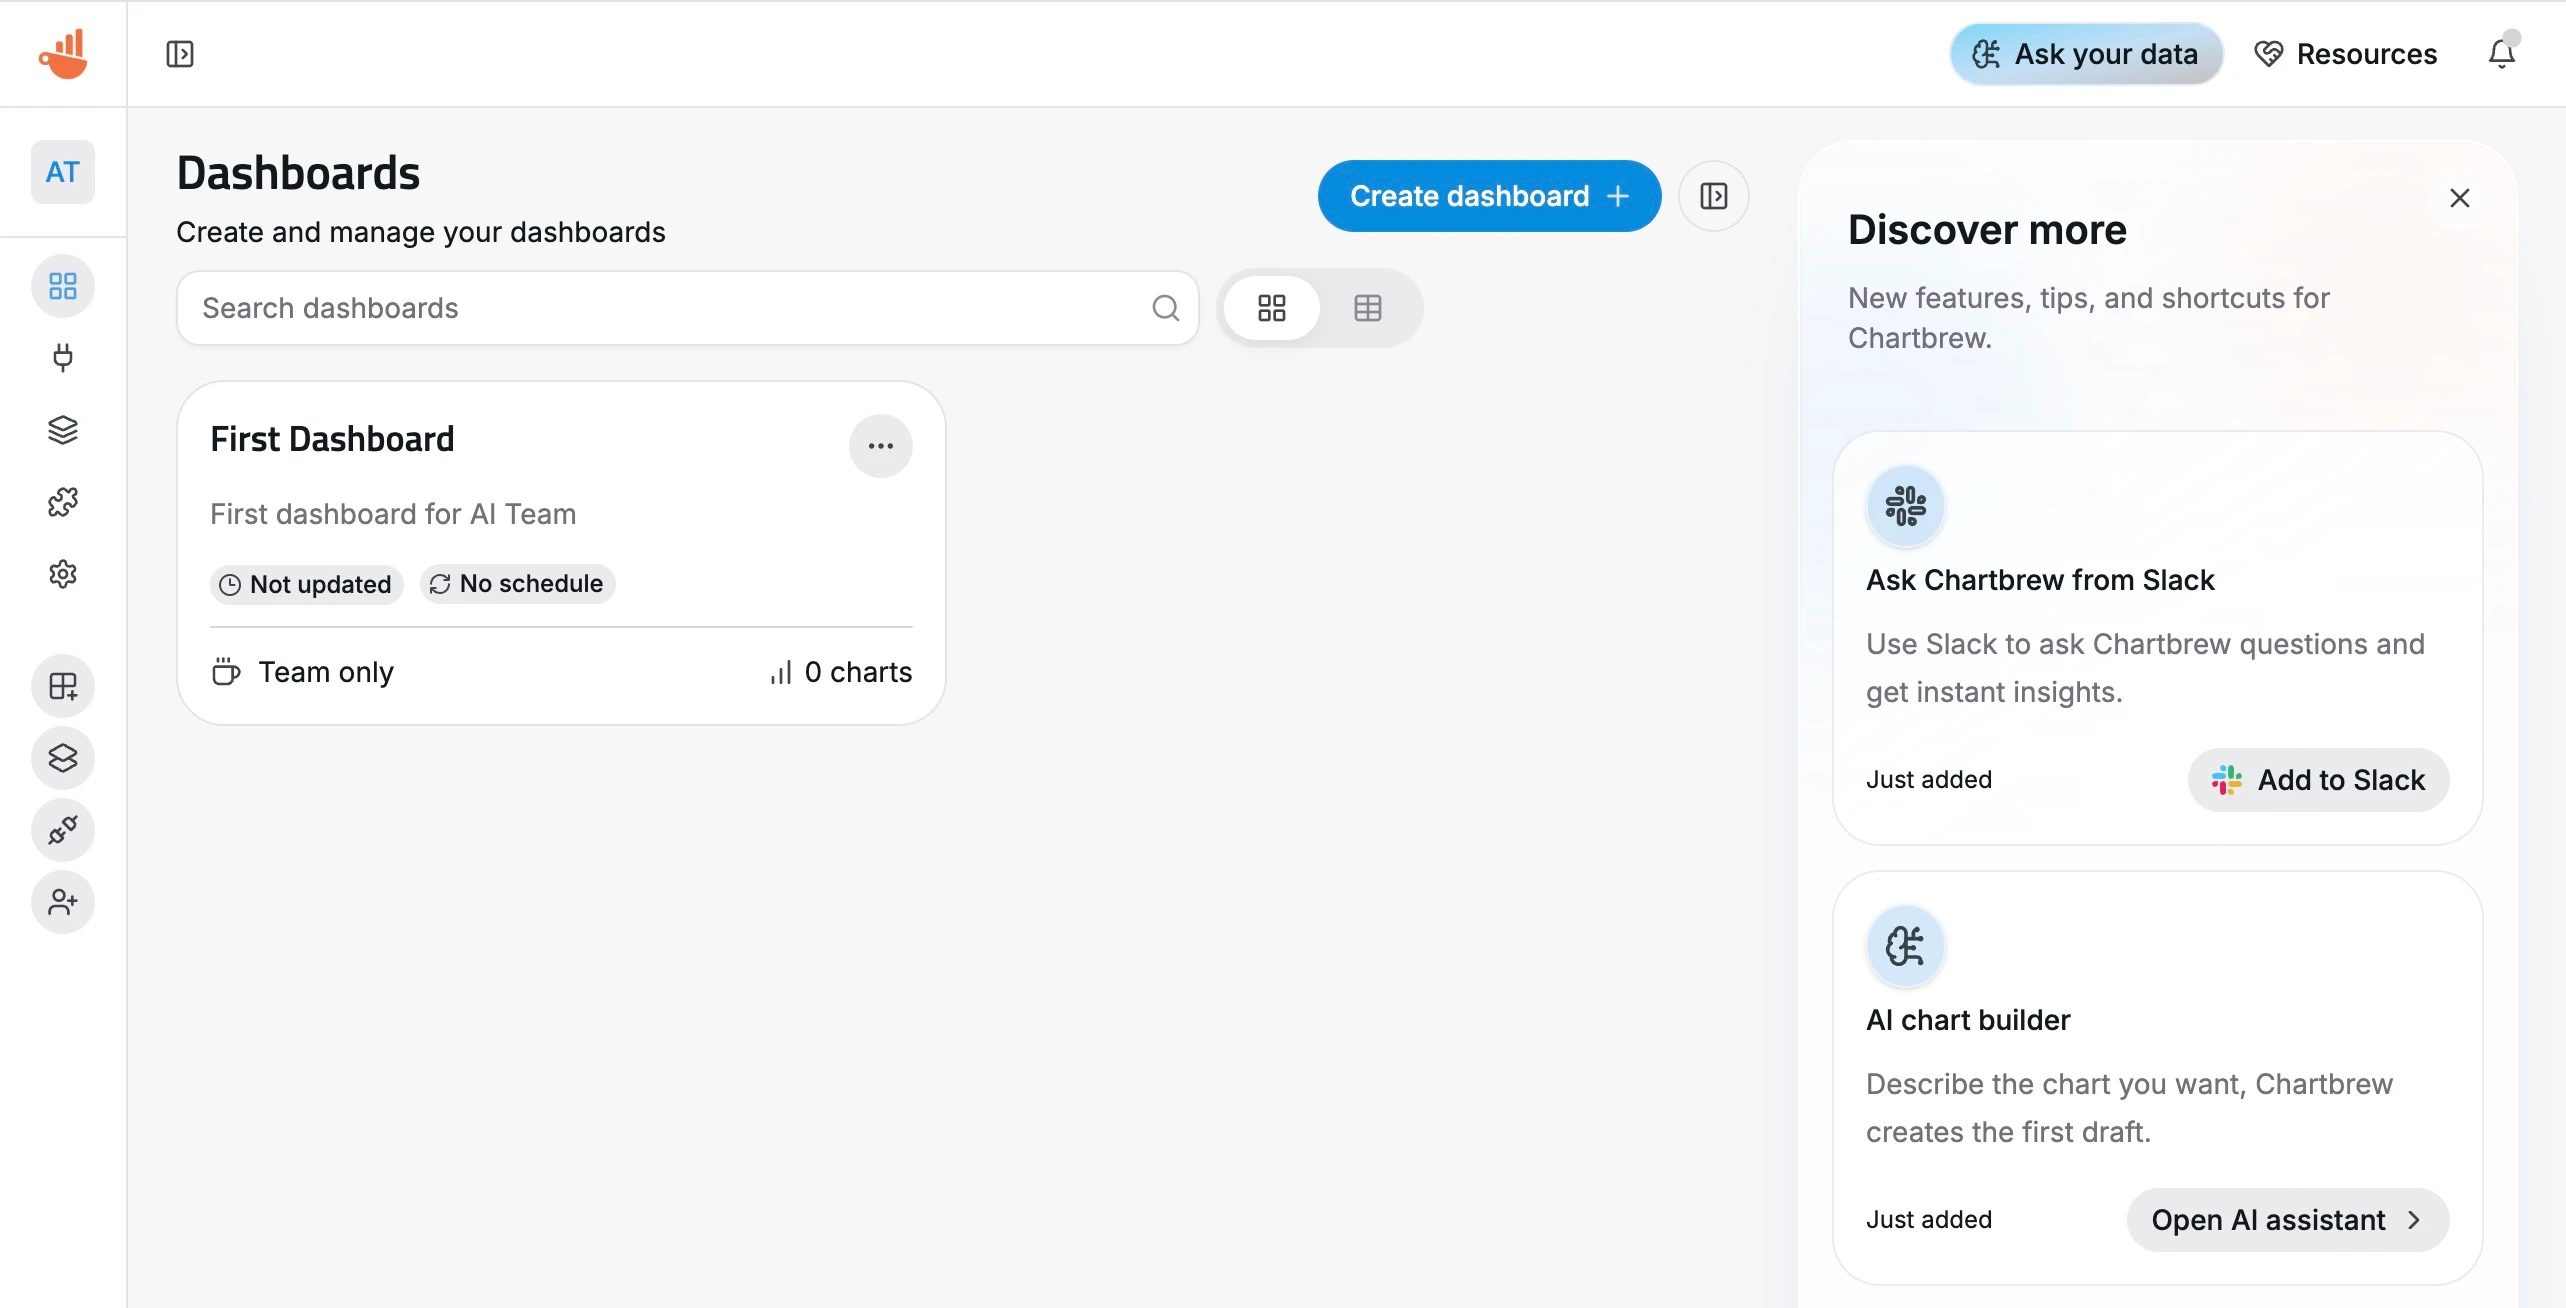
This area is also part of the groundwork for the next set of improvements we want to ship. There is a lot planned, and this gives us a better way to help users discover those updates as they land.
Monaco-powered code editing
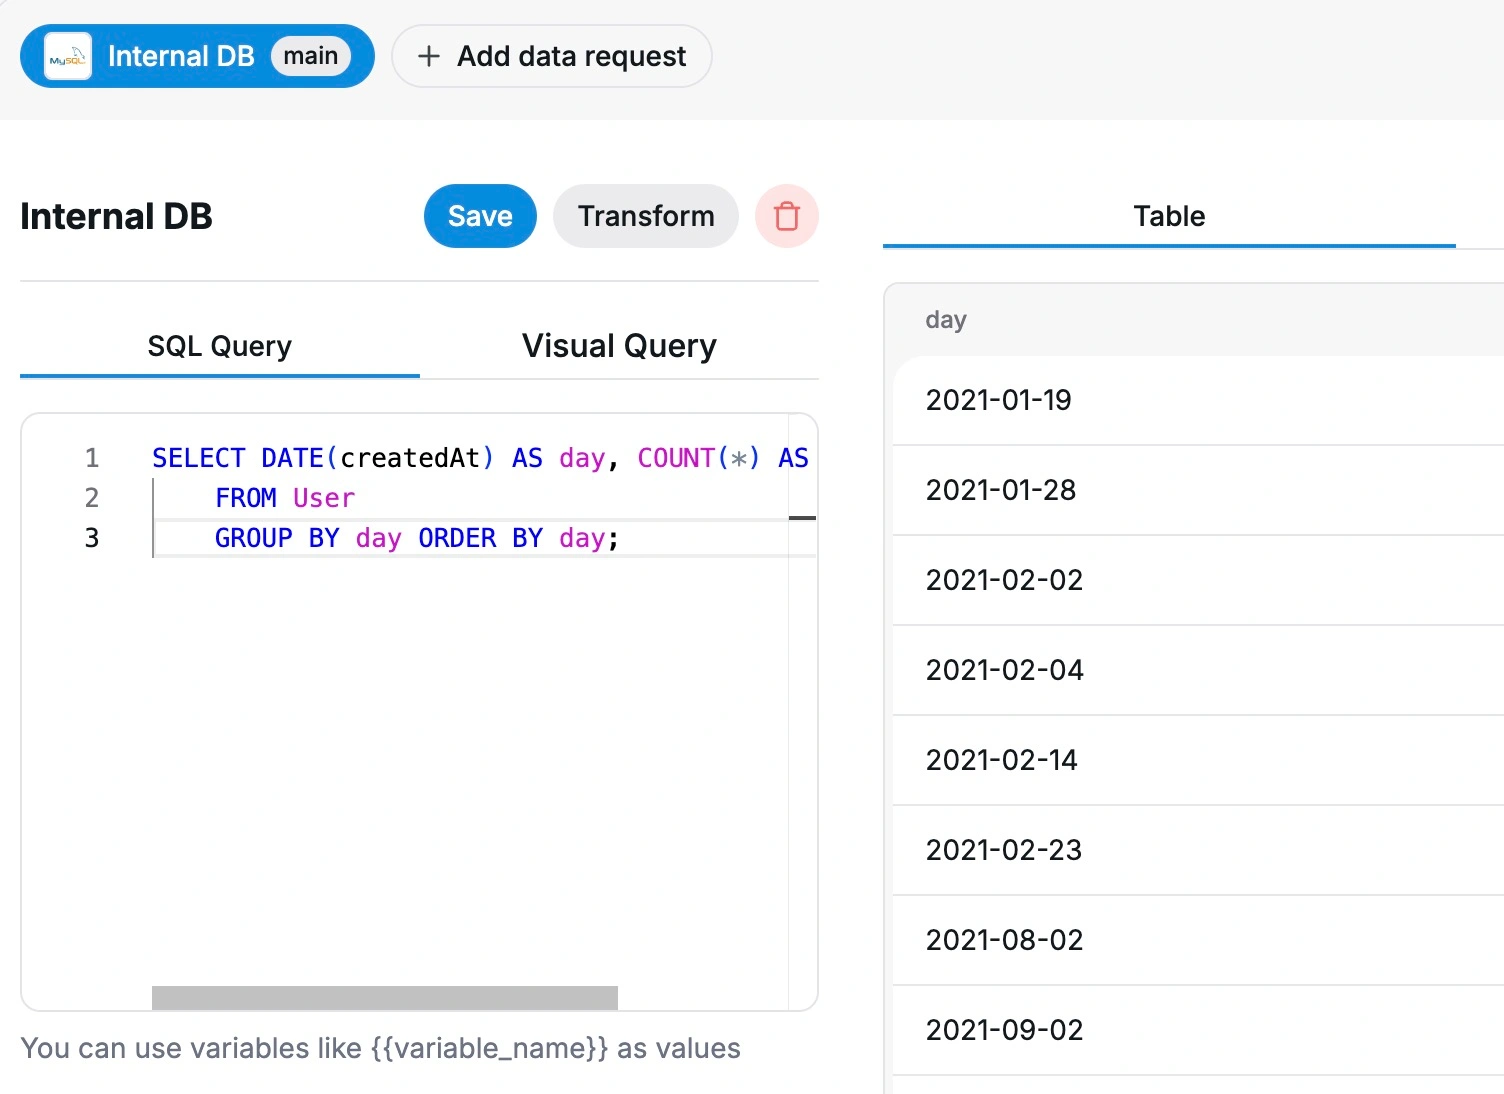
Chartbrew now uses Monaco for code editing across the app.
This replaces the older Ace editor in areas like SQL, API requests, MongoDB, ClickHouse, Firestore, Google Analytics, Realtime Database, connection forms, public dashboard custom code, reports, and data transforms.
For users who spend time writing queries or editing custom logic, this should feel like a big step forward. Monaco gives the editing experience a more modern foundation and makes Chartbrew feel closer to the tools developers already use.
Refreshed email templates
Emails sent by Chartbrew have also been refreshed.
We introduced new React Email templates for chart alerts, dashboard snapshots, email updates, and password resets. These now share a consistent Chartbrew email layout, making product emails feel more polished and professional.
This also prepares Chartbrew for more advanced scheduled reporting features in the future.
Stronger security and access control
Chartbrew v5 includes several important security and access-control improvements.
Invite token validation has been tightened, tagged dataset access has been refined, and project-level permissions are now enforced more carefully across reports, share policies, and hidden charts.
None of this is flashy, but it is important, especially for teams sharing dashboards and reports with clients or external stakeholders.
If you self-host Chartbrew, upgrading to v5 is strongly recommended.
AI Orchestrator improvements
The AI Orchestrator also received some important internal upgrades.
It now has better guards around team-scoped tools, and the OpenAI integration has moved from the older chat completions API to the newer responses API.
This should make AI-assisted workflows more reliable and better aligned with team-level data access.
Technical updates
Chartbrew v5 also brings several developer and dependency updates:
- React 19
- Vite 8
- Updated client dependencies
- Updated react-table
- Replaced
react-colorwith a native variant - Migrated linting from ESLint to Oxlint
- Fixed CI after tooling updates
For self-hosted users, there is no manual migration required. You can update to v5 like any other Chartbrew release. Data migrations are handled automatically.
We do recommend updating to Node v22+ if you have not done so yet, since Chartbrew development has moved away from Node v20.
API notes for v5
There are a couple of important API changes around quick-create endpoints.
The reusable dataset now uses name as its canonical identifier, while legend is treated as chart-specific label text.
Older dataset-level inputs like dimension, metric, metricOperation, dateField, dateFormat, conditions, and legend are still accepted for compatibility, but new chart-specific bindings now belong in chartDatasetConfigs[] on the chart quick-create route instead of the dataset quick-create route.
This matches the broader v5 cleanup: datasets describe the data, while chart dataset configs describe how that data appears inside a chart.
Trials no longer require a credit card
Alongside the v5 launch, we also removed the credit card requirement for starting a Chartbrew trial.
You can now activate a 14-day trial without adding a card. This should make it easier for teams to properly explore Chartbrew before deciding if it fits their workflow.
If you tried Chartbrew before but skipped the trial because of the card requirement, this is a good time to give it another look.
A foundation for what comes next
Chartbrew v5 is a foundation release.
A lot of the value is in the overall feel of the product: cleaner workflows, better defaults, clearer editing, stronger access rules, more polished emails, and a more consistent interface across the app.
It also puts Chartbrew in a much better position for the next round of improvements, especially around onboarding, reporting, templates, AI, and scheduled insights.
As always, feedback is welcome. If you try v5 and have ideas, issues, or requests, join the discussion on Discord or get in touch directly.
