Actionable insights for your team and clients
Track KPIs and improve decision-making with real-time dashboards and reports from all your data sources

Trusted by amazing companies


Data for everyone: your team, clients, leadership
An easy-to-use set of tools for your team to create interactive reports from all your data sources
Embedded real-time dashboards
Build and integrate interactive dashboards in hours, not weeks

Seamless Integration
Easily embed analytics into your existing apps using ready-to-go iframe or API embedding—no complex coding required.
Fully Interactive Insights
Let your users explore interactive dashboards with filters and real-time updates directly within your platform.
Secure & Multi-Tenant
Safely manage analytics for multiple clients or user groups with robust security, access controls, and tenant isolation.
"Chartbrew has helped us move away from having to constantly update clunky Google-based charts, but what most impresses me is the responsiveness and the helpfulness of the people behind Chartbrew. Highly recommend!"

Schuyler
Full-stack developer, Fairchain
Optimised for collaboration and speed
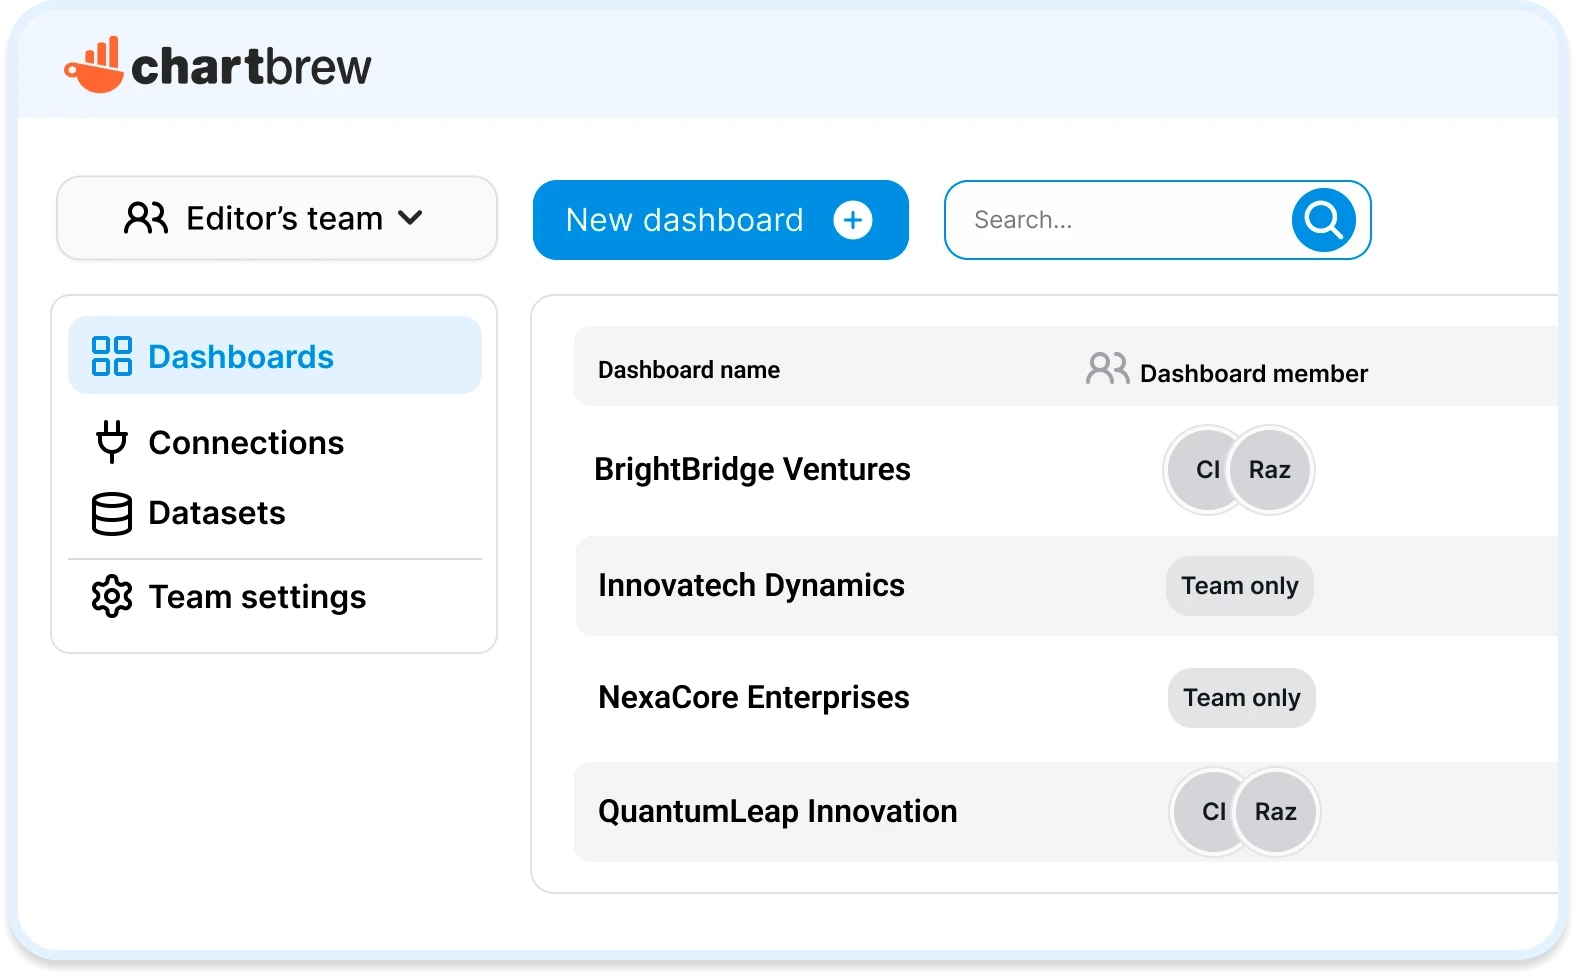
Chartbrew is tailor-made for teamwork. Easily collaborate on dashboards and reports with your team, and share your insights effortlessly with clients or stakeholders.
Scale your client reporting with templates
Replicate dashboards for your clients using templates. You can then further customise the datasets to match each client's needs.
AI-powered query assistant
Let our AI assistant help you write and optimize your queries. Get instant suggestions and improvements to make your data analysis more efficient. Works with any SQL-based database and MongoDB.
"Loving the product (so are our customers!), appreciate seeing user feedback show up in the updates, and it just keeps getting better. Thanks Raz!"

Jeffrey Meese
CEO, OrderEZ
How it works
Get up and running in minutes

Integrations
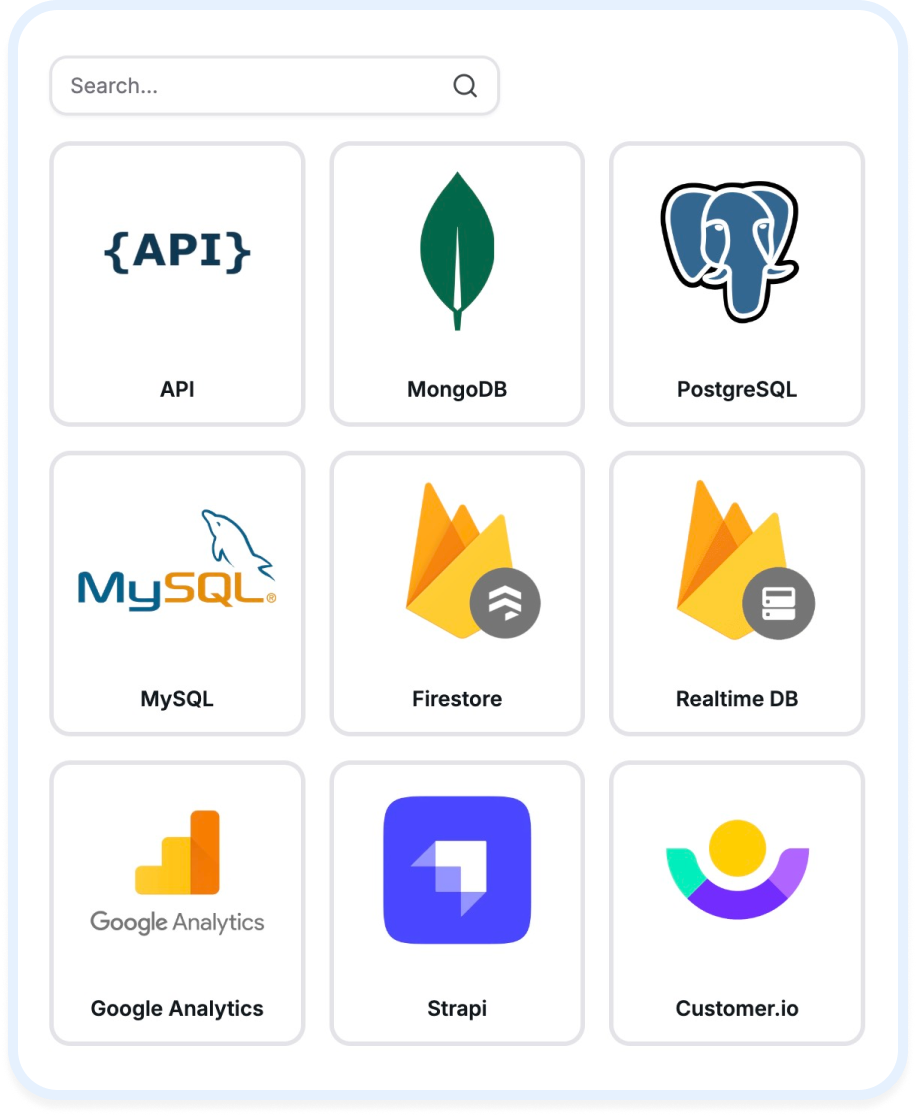
Get your data from a wide range of sources. More added all the time
See what others say about Chartbrew
Take your data to the next level
Empower your team and clients with dynamic, branded reporting dashboards
Already have an account? Log in