Chartbrew v3 - what's new
I am relieved to announce that Chartbrew v3 is finally out! The development for this version started officially in August 2023. Unlike the move from v1 to v2, this next version is not a culmination of updates pushed live with time. It's more of a standalone update as v3 was developed parallel to the previous version.
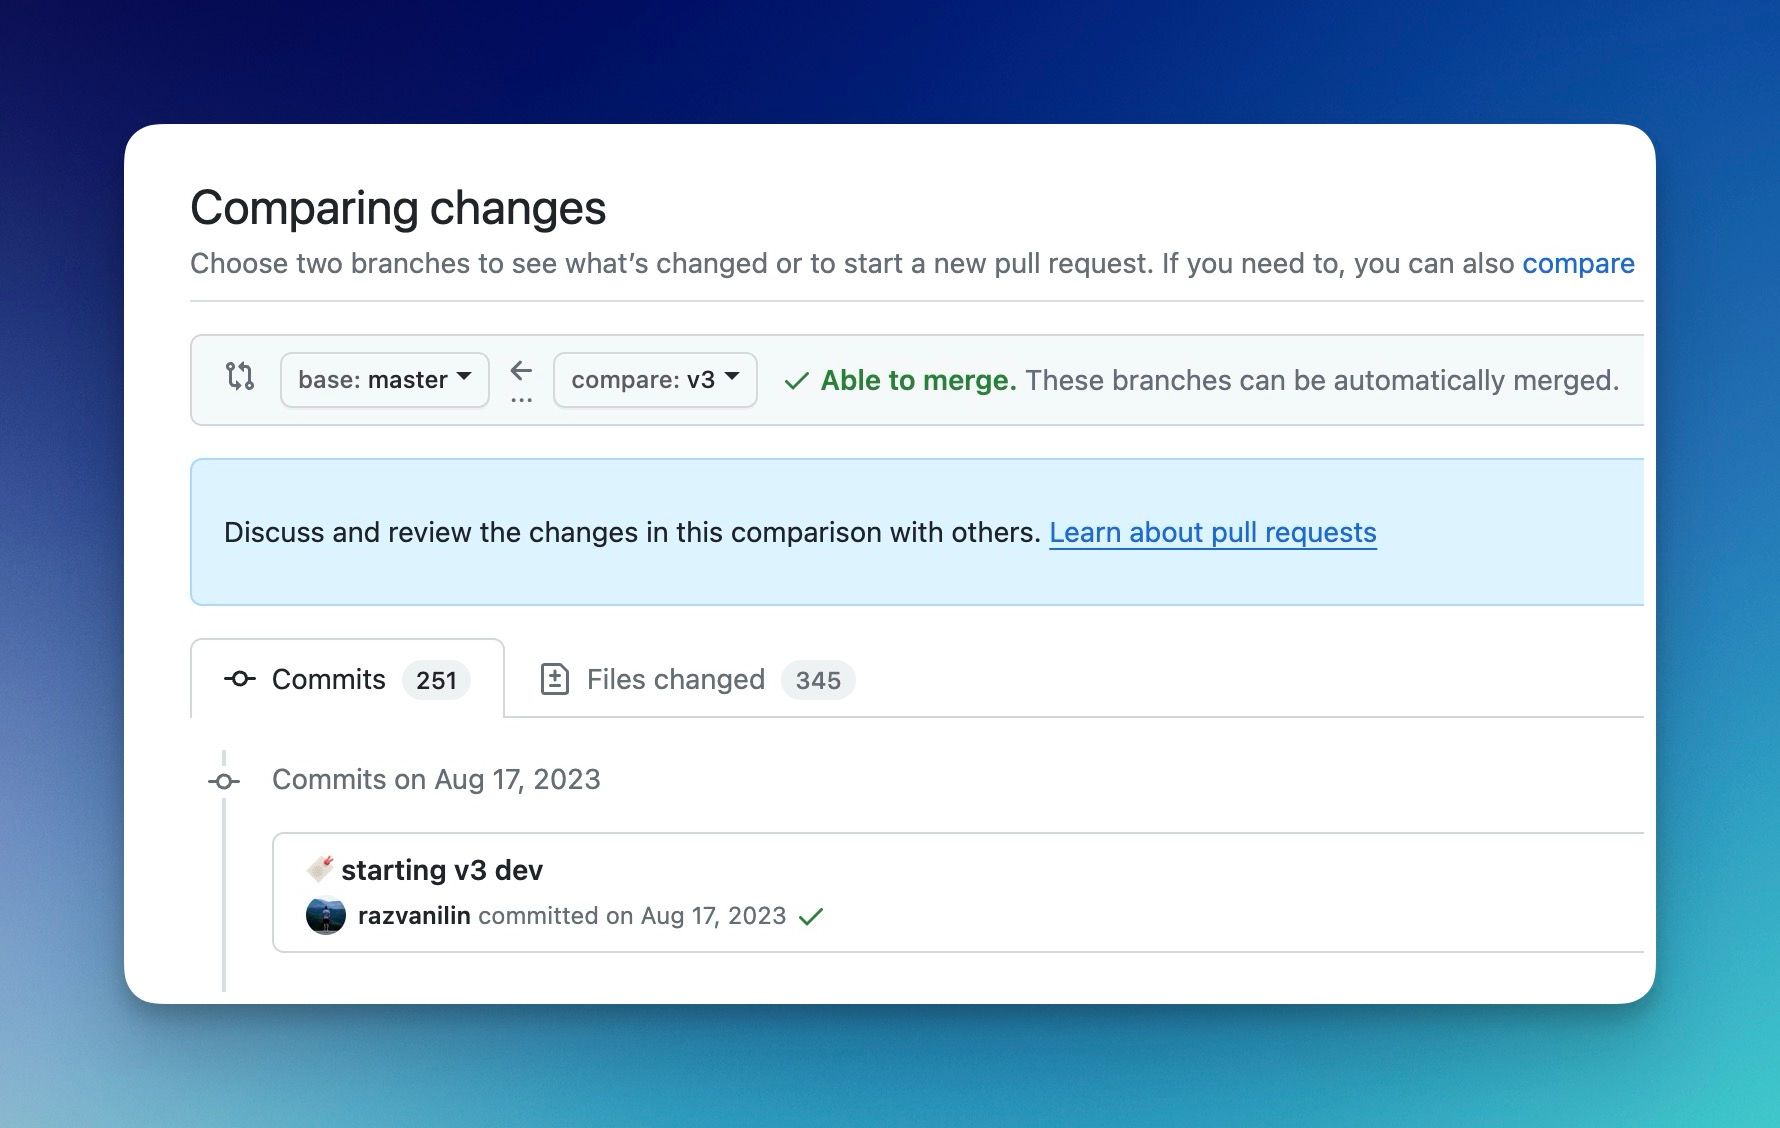
V3 brings a shift in the way Chartbrew is used. Part of why it took so long to release, was the major change of the underlying architecture. All these changes also needed to be brought live so that existing dashboards of all customers would still work unchanged.
But enough background info! Let's see what the new version brings.
Product changes
Reusable connections and datasets
The main star of v3, and the main reason the works started in the first place, is the way connections and datasets work. Previously, each dashboard would have its connections and each chart would have its datasets. This was a massive pain when dealing with many dashboards and charts as most of the setup needed to be repeated.
With v3, the connections and datasets live on the team level and can be used in all dashboards. This has multiple benefits:
- Technical team members can prepare connections and datasets for the rest of the team
- Non-technical team members can use the datasets to create charts
- Create connections once, then re-use for all datasets
- Create datasets once, then re-use them for all charts
- If requirements change, editing connections and datasets will update everything across the board
New connections UI
The connections can now be created straight from the home screen. Just press the Create connection button and you can interact with the new UI.
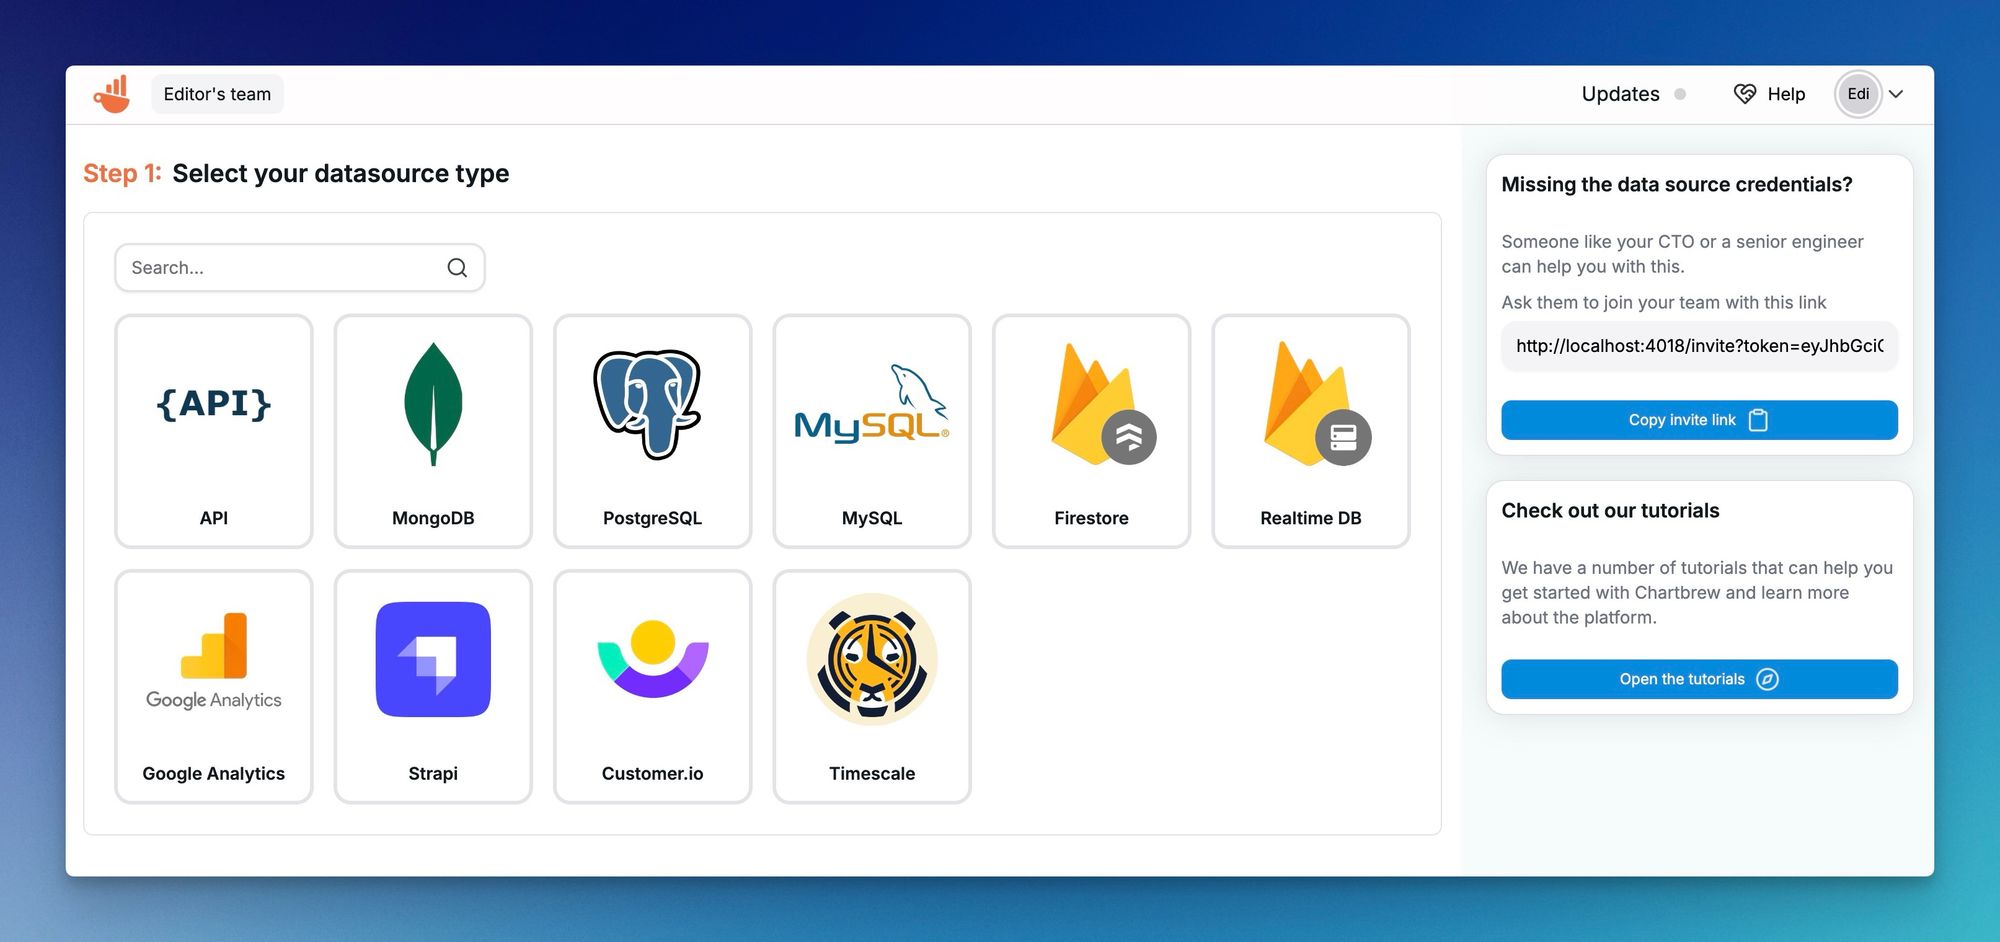
The new UI is built to assist users with dynamic links to relevant tutorials depending on what connection type is selected. The quick invite links are also generated automatically to let users quickly get developers to create the connections if required.
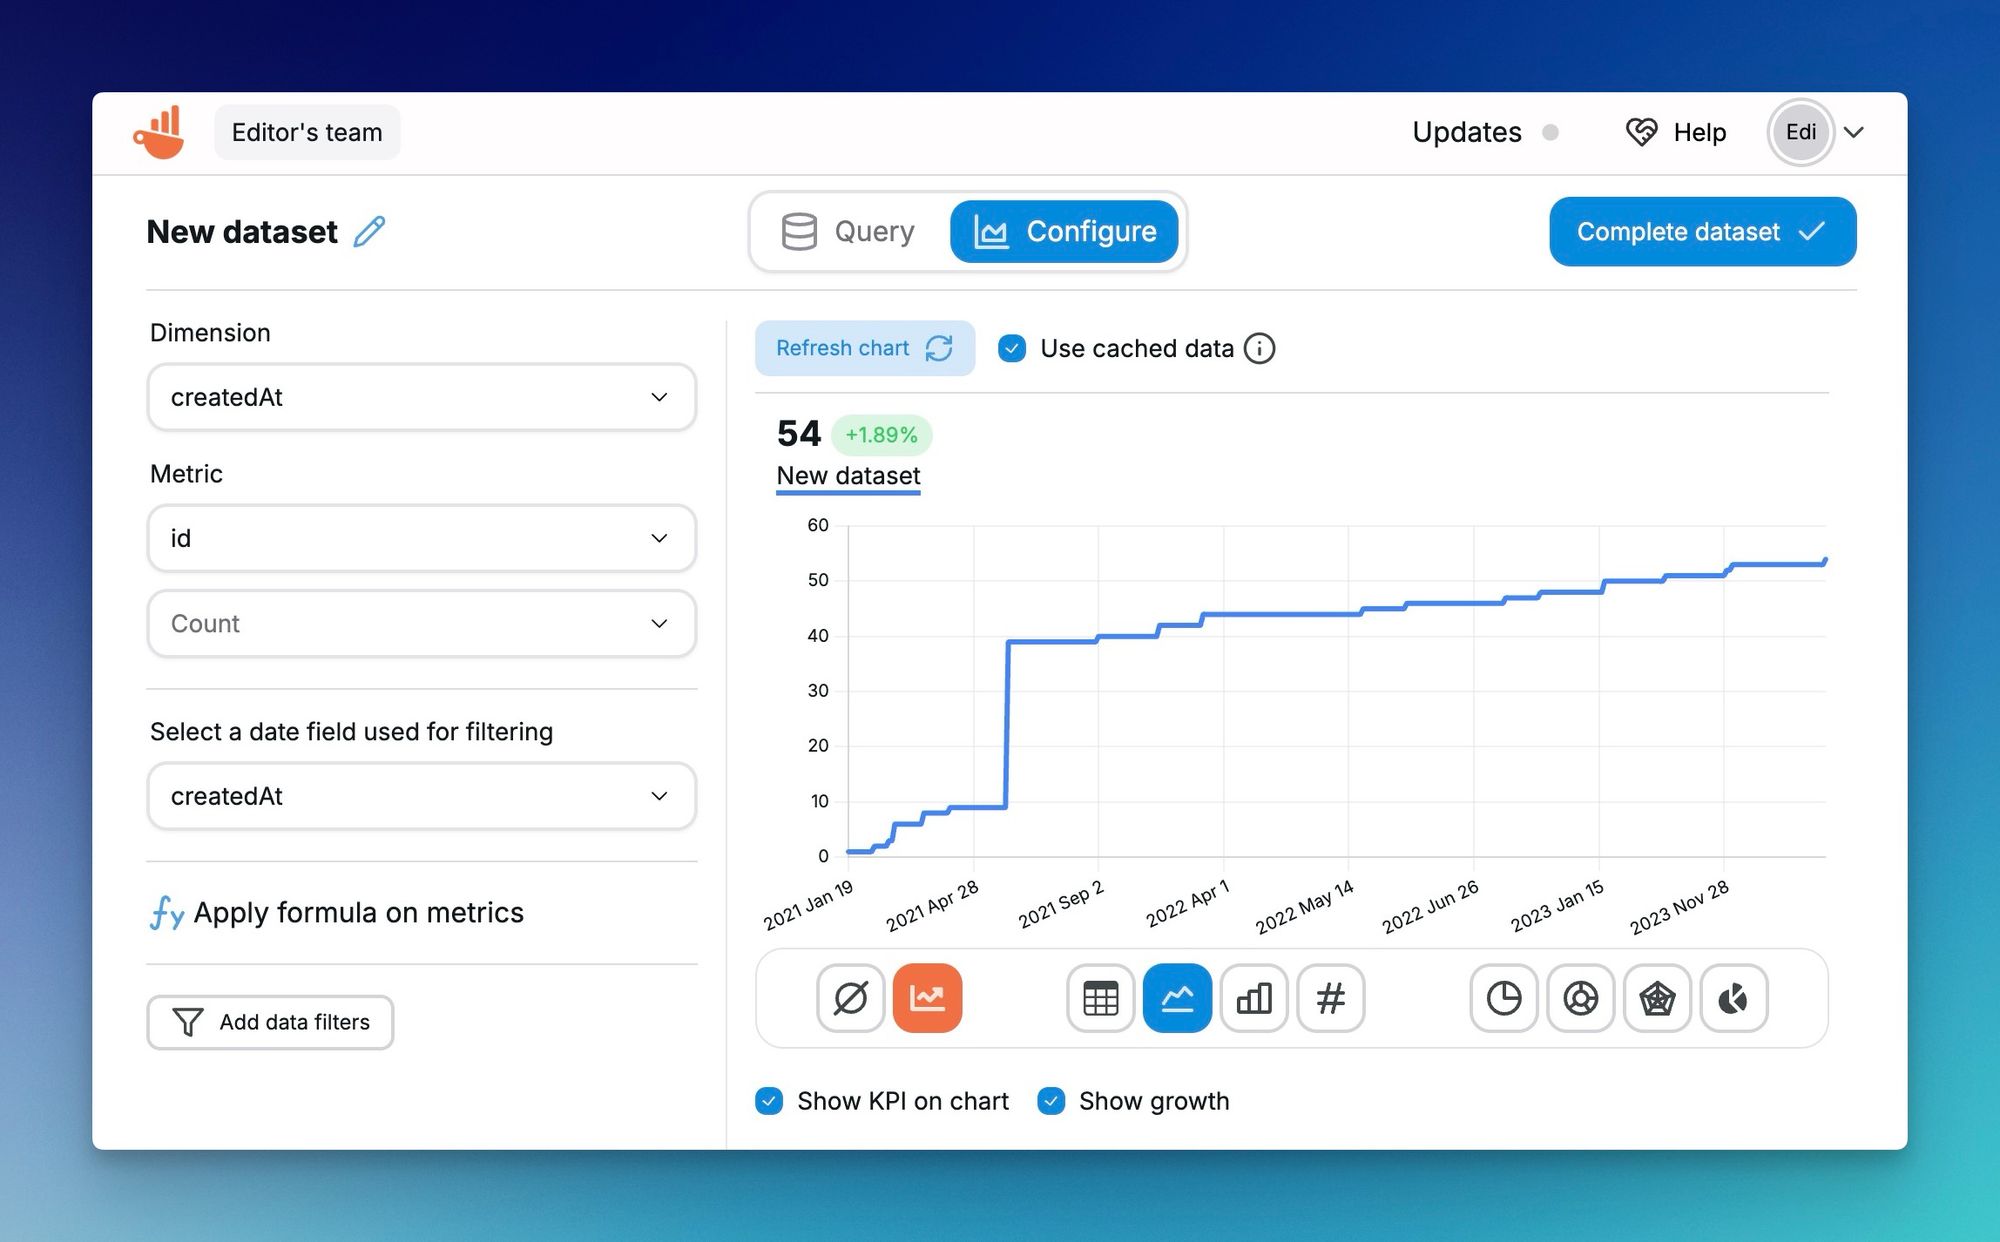
New Dataset builder with preview
The dataset builder UI was built from the ground up to let users preview potential visualizations when creating a dataset.
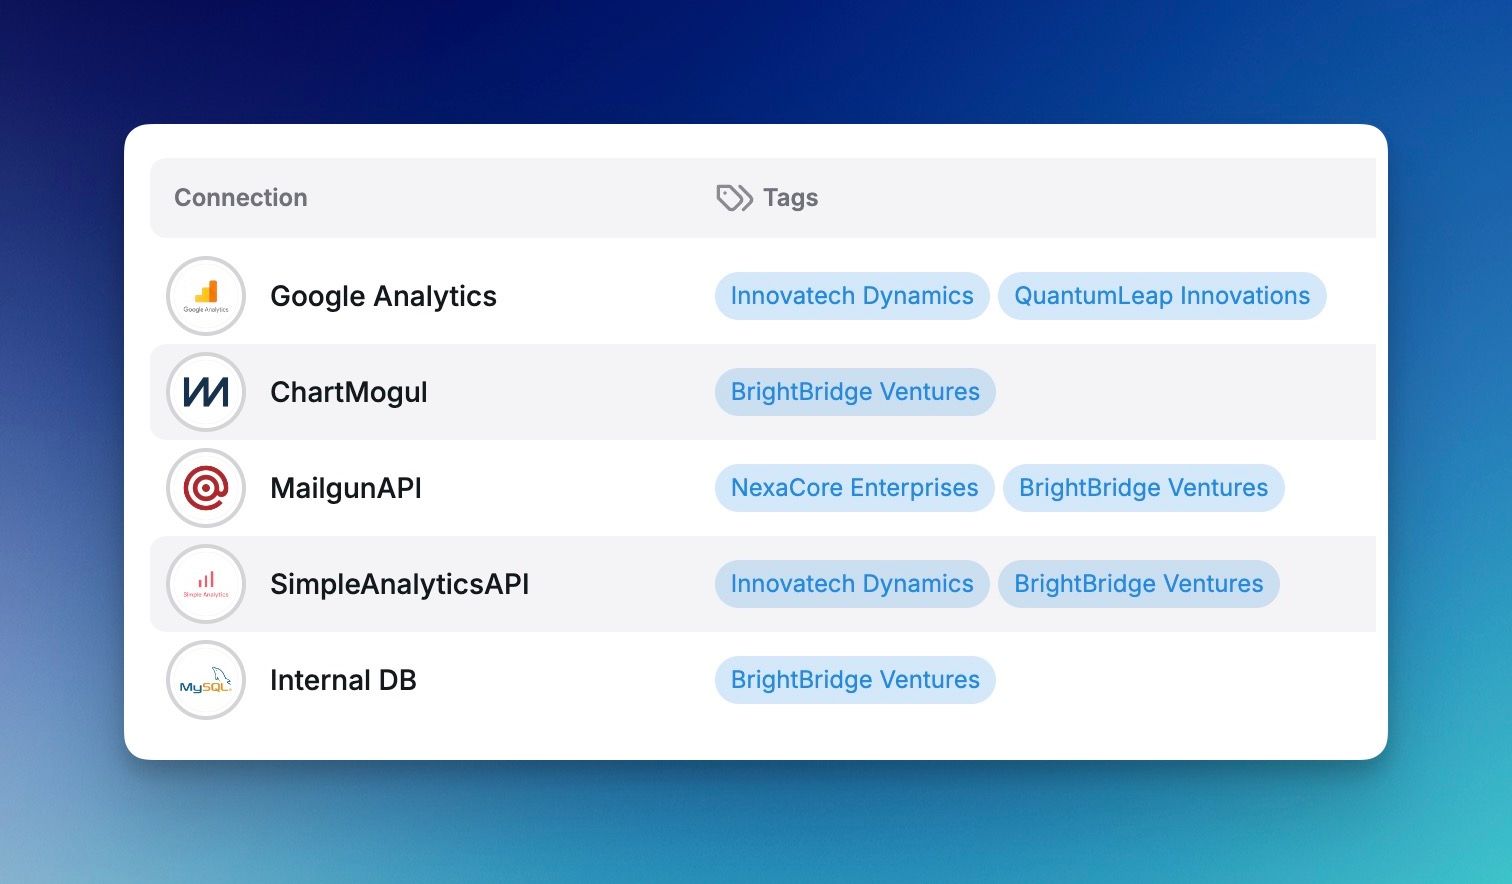
Introducing tags for connections and datasets
The tags are used to organize the content by dashboard. Users can tag connections and datasets to make them available for the clients of certain dashboards. Without tags, they can only be accessed by team members.
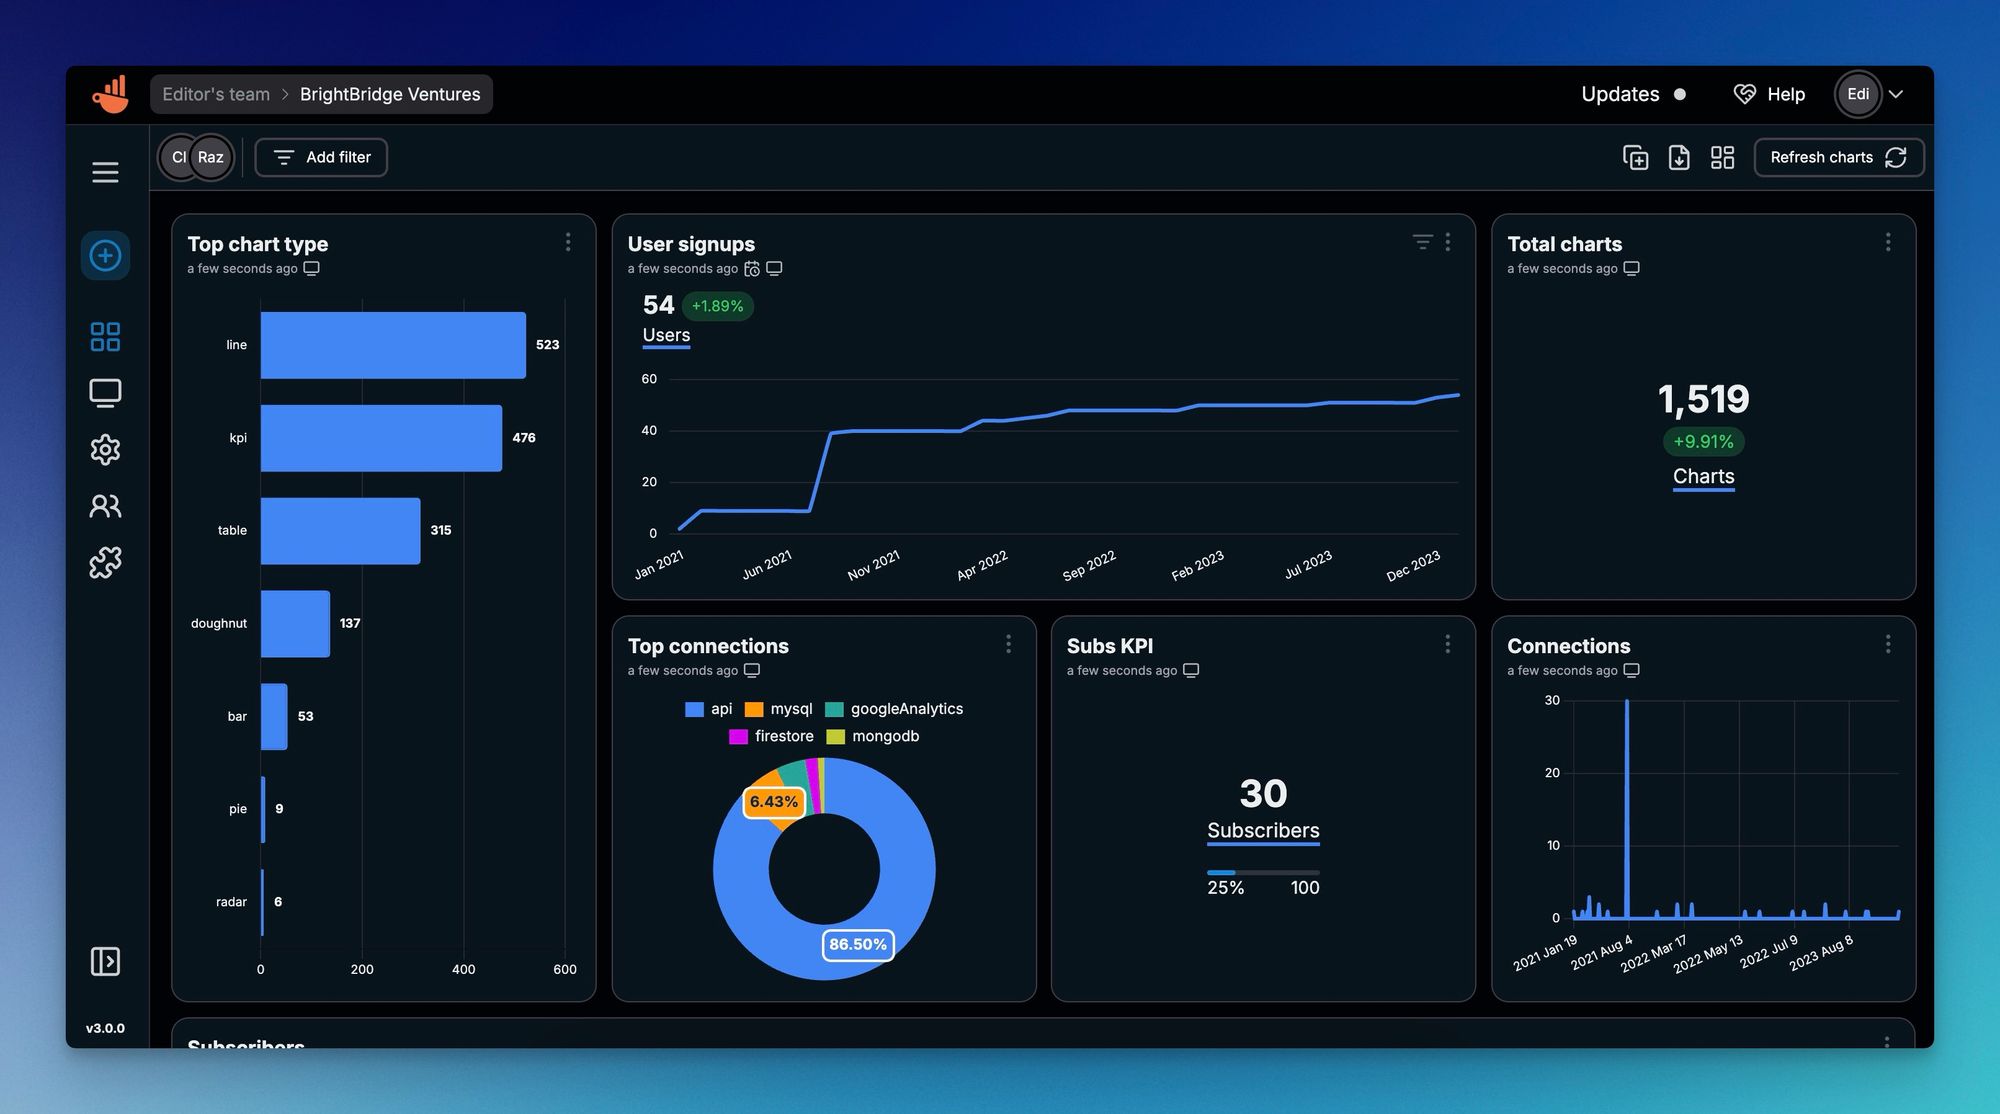
New dashboard layout
Designing your dashboard is now much easier with the new grid layout design in v3. Users can now drag and drop to move charts around, drag to change width and height, and also change the layout depending on the screen size.
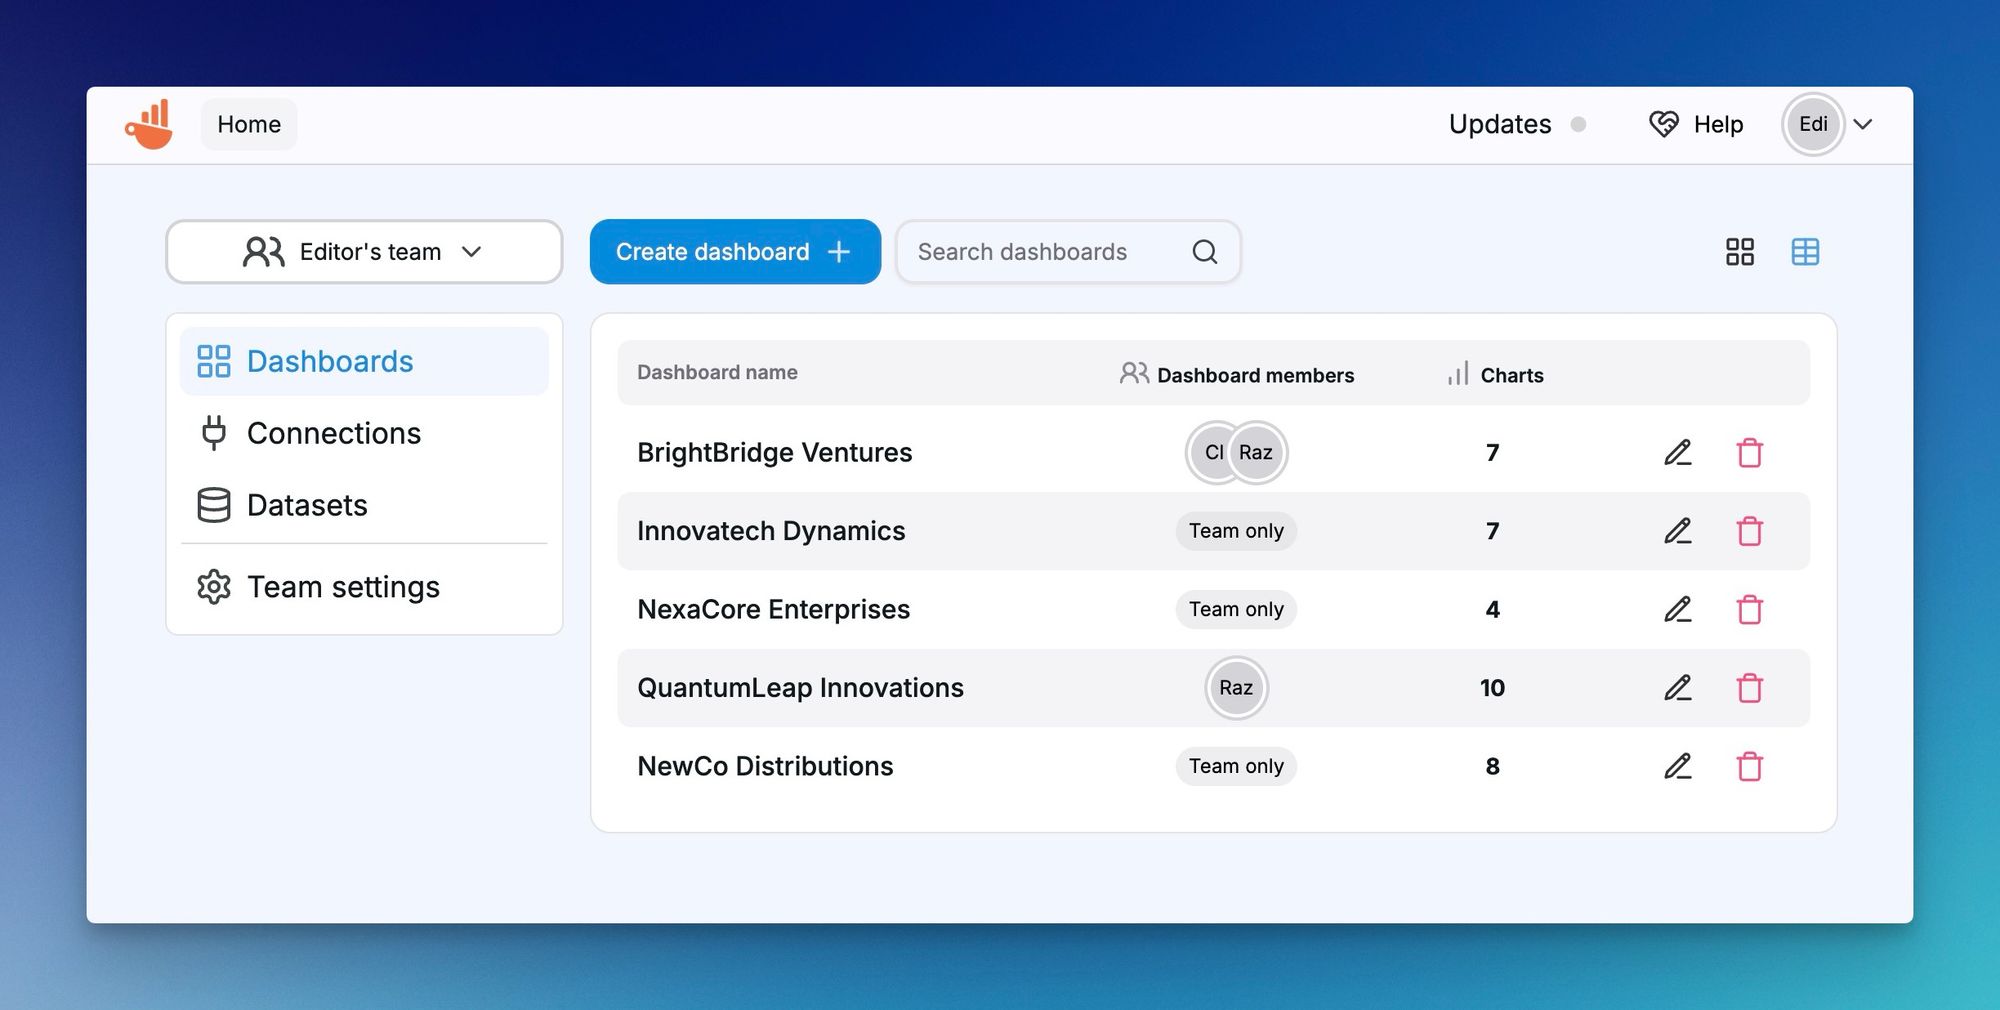
Introducing client accounts and new team roles
The new team roles are now organized by Team members and Client accounts. splitting the type this way will allow users to control the access for clients to only allow access to specific dashboards, while the team accounts have access to all.
For the customers at chartbrew.com, the limit for the client accounts is now much higher than for the team members. On the Professional plan, customers can have unlimited client accounts.
To support this change, there are new UI elements to show who has access to which dashboard at all times. You will be able to see this on the home page on each dashboard summary and inside the dashboard itself.
New design, colors, animations
You might have noticed from the screenshots that the design and UI elements have changed a bit. Chartbrew v3 has updated UI elements all over. Here is a quick list of some of the more important UI changes:
- Brand colors have changed slightly
- Introducing new elements such as Autocomplete selectors useful for selecting fields for filters and axes
- New default chart colors to ensure your data can be perfectly visualized in light and dark mode. Also, no more random colors. Chartbrew selects the right combination for you, but users can also change to any color after
- New chart visuals for the new layout changes with multiple height settings
- Fluid animations to make the platform a joy to use
Updated the Strapi plugin with v3 support
The Strapi plugin has been updated to ensure the connection with Chartbrew still works. But the new update contains new goodies too!
- The Chartbrew page in your Strapi admin UI now supports the new grid layout from v3
- All charts have been updated to fix UI inconsistencies
- Added multiple team support
Project technical changes
If you self-host Chartbrew, you will be happy to hear that the tech has been upgraded across the board. The goal is to always make it easier to self-host, resource-optimize, and keep up-to-date with the latest hosting environments and operating systems. Here are some of the major updates:
- Switched from
create-react-apptovitemaking the development faster, less dependencies, and reducing build times from minutes to seconds - Updated the page routing by upgrading
react-routerto the latest version - Updated the state manager from the legacy
reduxtoredux-toolkit - Updated from NextUI v1 to v2
- Updated the Sequelize ORM to v6
- New NodeJS versions are now supported and the minimum is now NodeJS 20
- New documentation site
Subscription changes for Chartbrew.com
Price-wise, nothing will change for existing customers, but the prices do go up for everyone else.
- Starter plan now $49/month or $490/year
- Growth plan now $129/month or $1290/year
- Professional plan now $299/month or $2990/year
Like before, each plan can be extended with add-ons. Previously, each plan was capped at 10 addon packages, but this has been extended to 20 now. This introduces more flexibility so that customers only pay for what they use.
All plans have been updated to include many more dashboards and charts are no longer capped (they are, but only to avoid abuse. 99% of cases should not need more than the limit).
Introduced client accounts as a metric for the subscription tiers. For the starter plan, each dashboard comes with a client account, the growth plan comes with 2 client accounts per dashboard, and the professional plan has an unlimited number of client accounts available.
The only change for current customers will be that the number of connections is not per dashboard anymore instead they are per team. The plans have been adjusted to include more connections per team, but if anyone is affected by this and needs more connections, please get in touch.
Next steps
Even though v3 is a big update compared to v2, it still is pretty much a template for what's about to come. Chartbrew strives to become the go-to platform for client reporting and soon, most of the work will be focused on making this process easier.
Expect to see API access, custom variables that can be used for connections, datasets, filters, more dashboard themes, smarter dashboards, chart filters, and much more.
Roadmaps are a bit tricky to maintain, but I created a new one that I'll link below. It's not something set in stone, but it should give a general idea at all times of the direction that Chartbrew is taking. The roadmap is not set in stone and it can be influenced by many factors, especially customer needs. So if you're a customer and you think it will be cool to have a certain feature in Chartbrew, do get in touch!
Here is the roadmap:
That's all for now! Thanks for checking this article out, many thanks to Chartbrew customers who keep my motivation up to continue improving the platform, and thanks to the Chartbrew community over on Discord for helping me improve the self-hosting scripts and finding new bugs to fix. Keep being awesome!
- Raz, founder @chartbrew
