The templates feature in Chartbrew allows you to quickly create entire dashboards to get instant insights into your data. The ChartMogul template requires a little configuration to get it up and running. This short tutorial is going to show you step-by-step how to create your dashboard.
Create a new project in Chartbrew
If you don't already have a Chartbrew account or are self-hosting the platform, you can get started by following the links below:
- Create an account and get started with Chartbrew in just a couple of minutes
- Or self-host Chartbrew on your machine by following the documentation
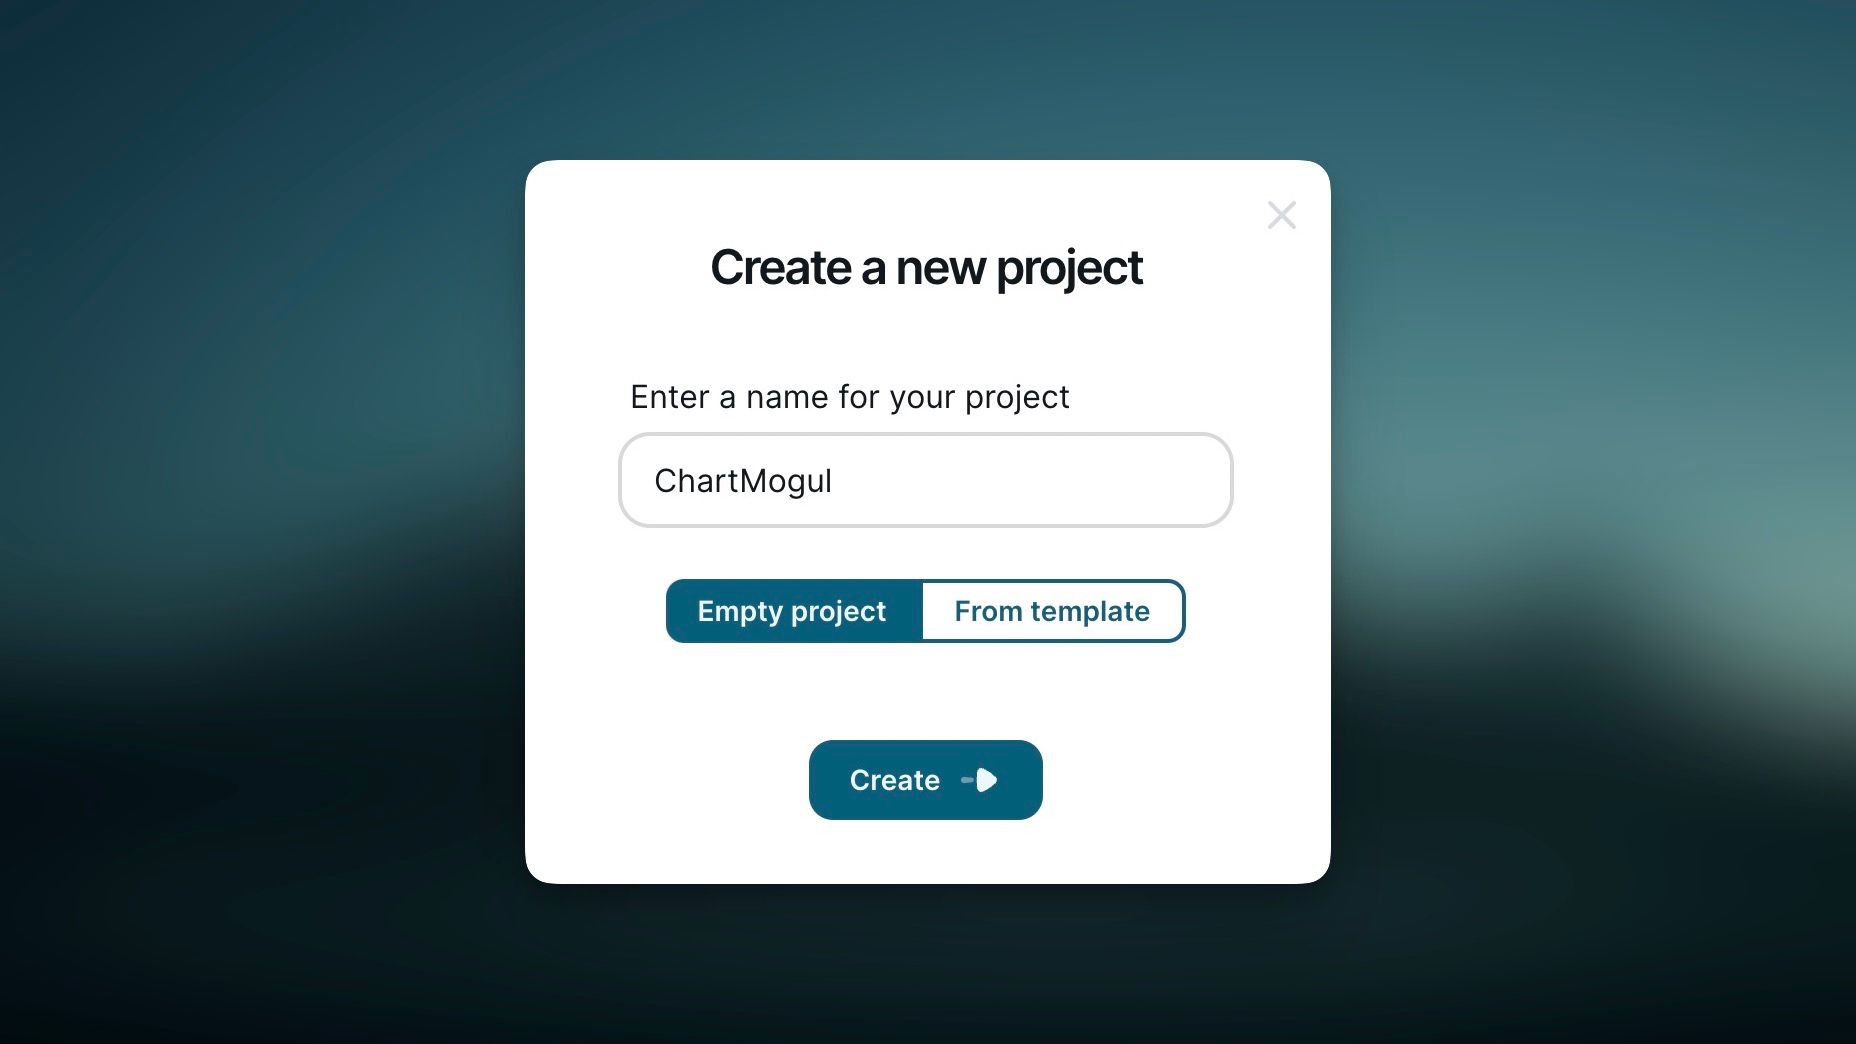
Once you have your account up and running, create a new project where we are going to create the ChartMogul dashboard.
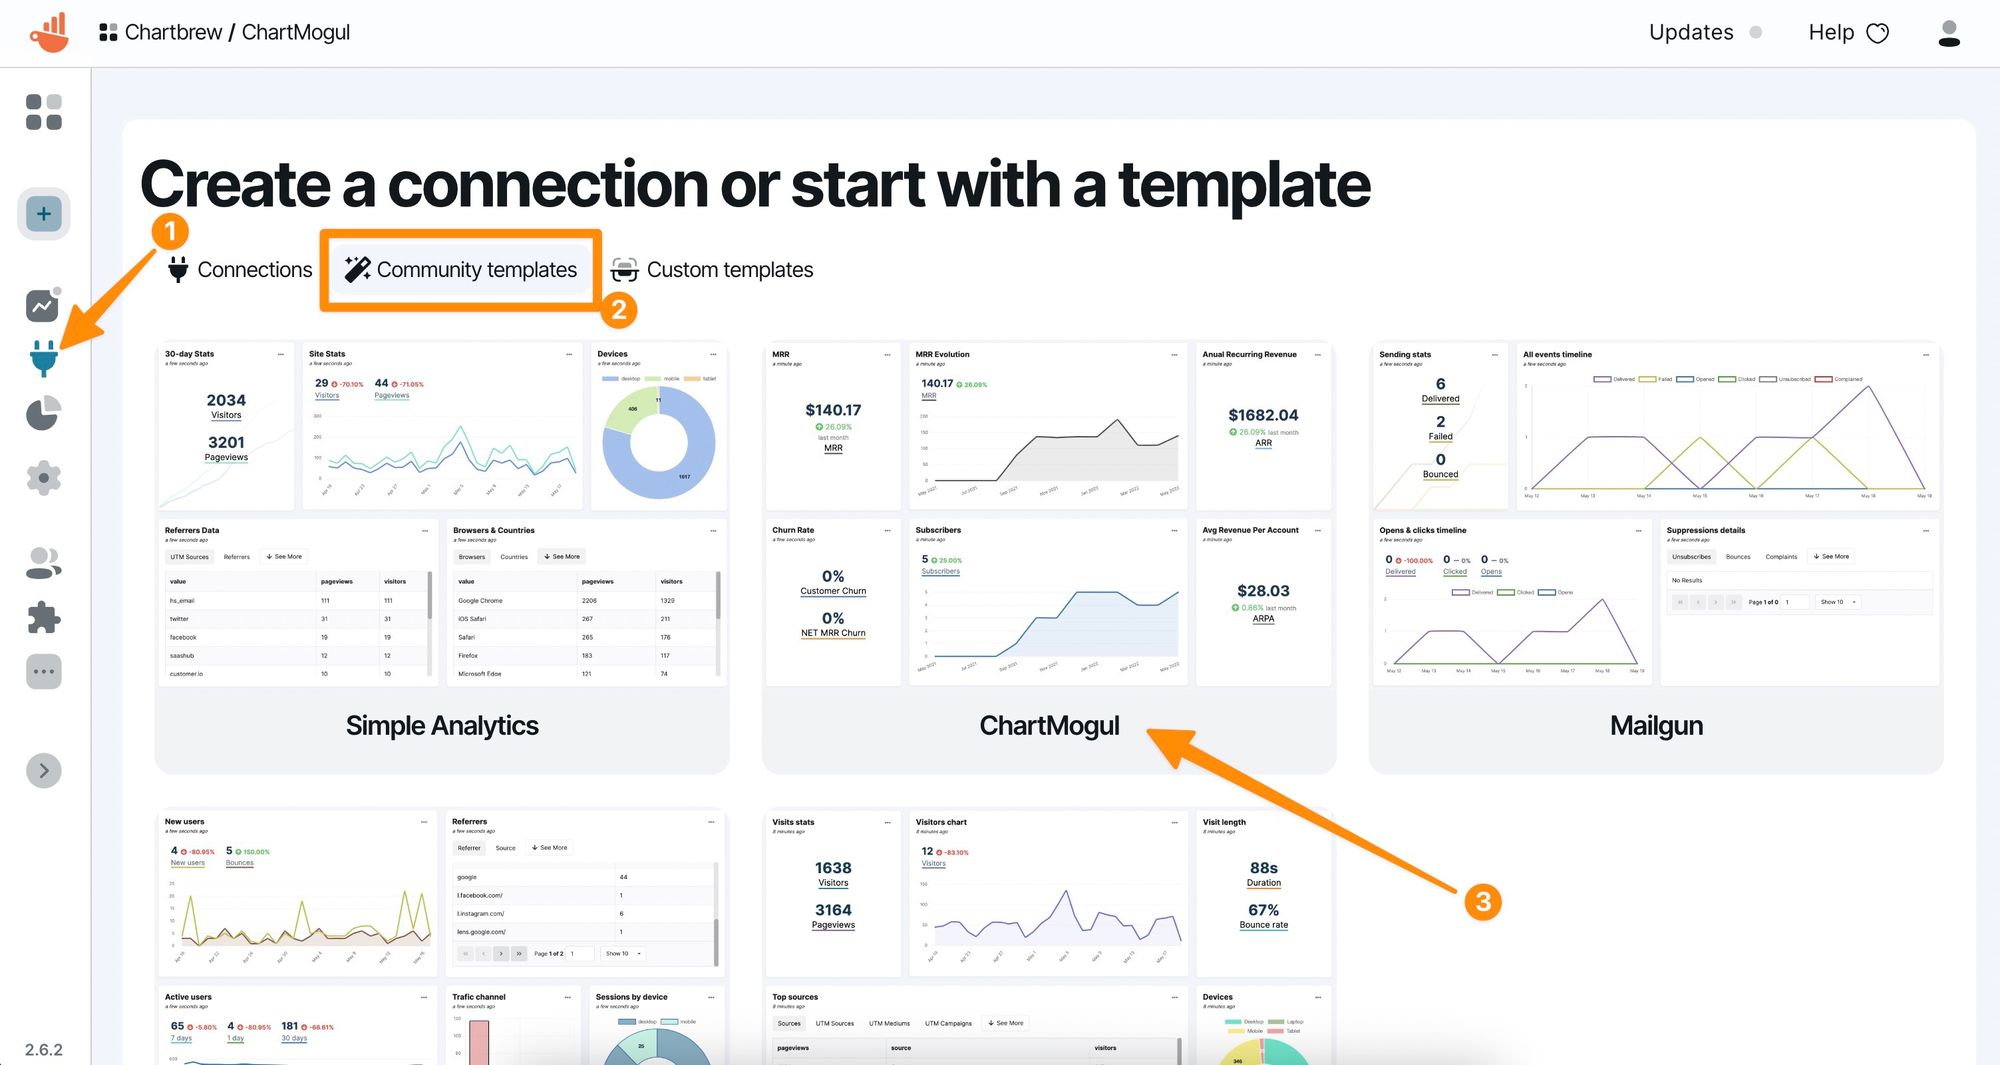
Chartbrew will then prompt you to create a new data source connection. On this screen, we will select the Community Templates and select ChartMogul from the list.
Connecting to the ChartMogul data source
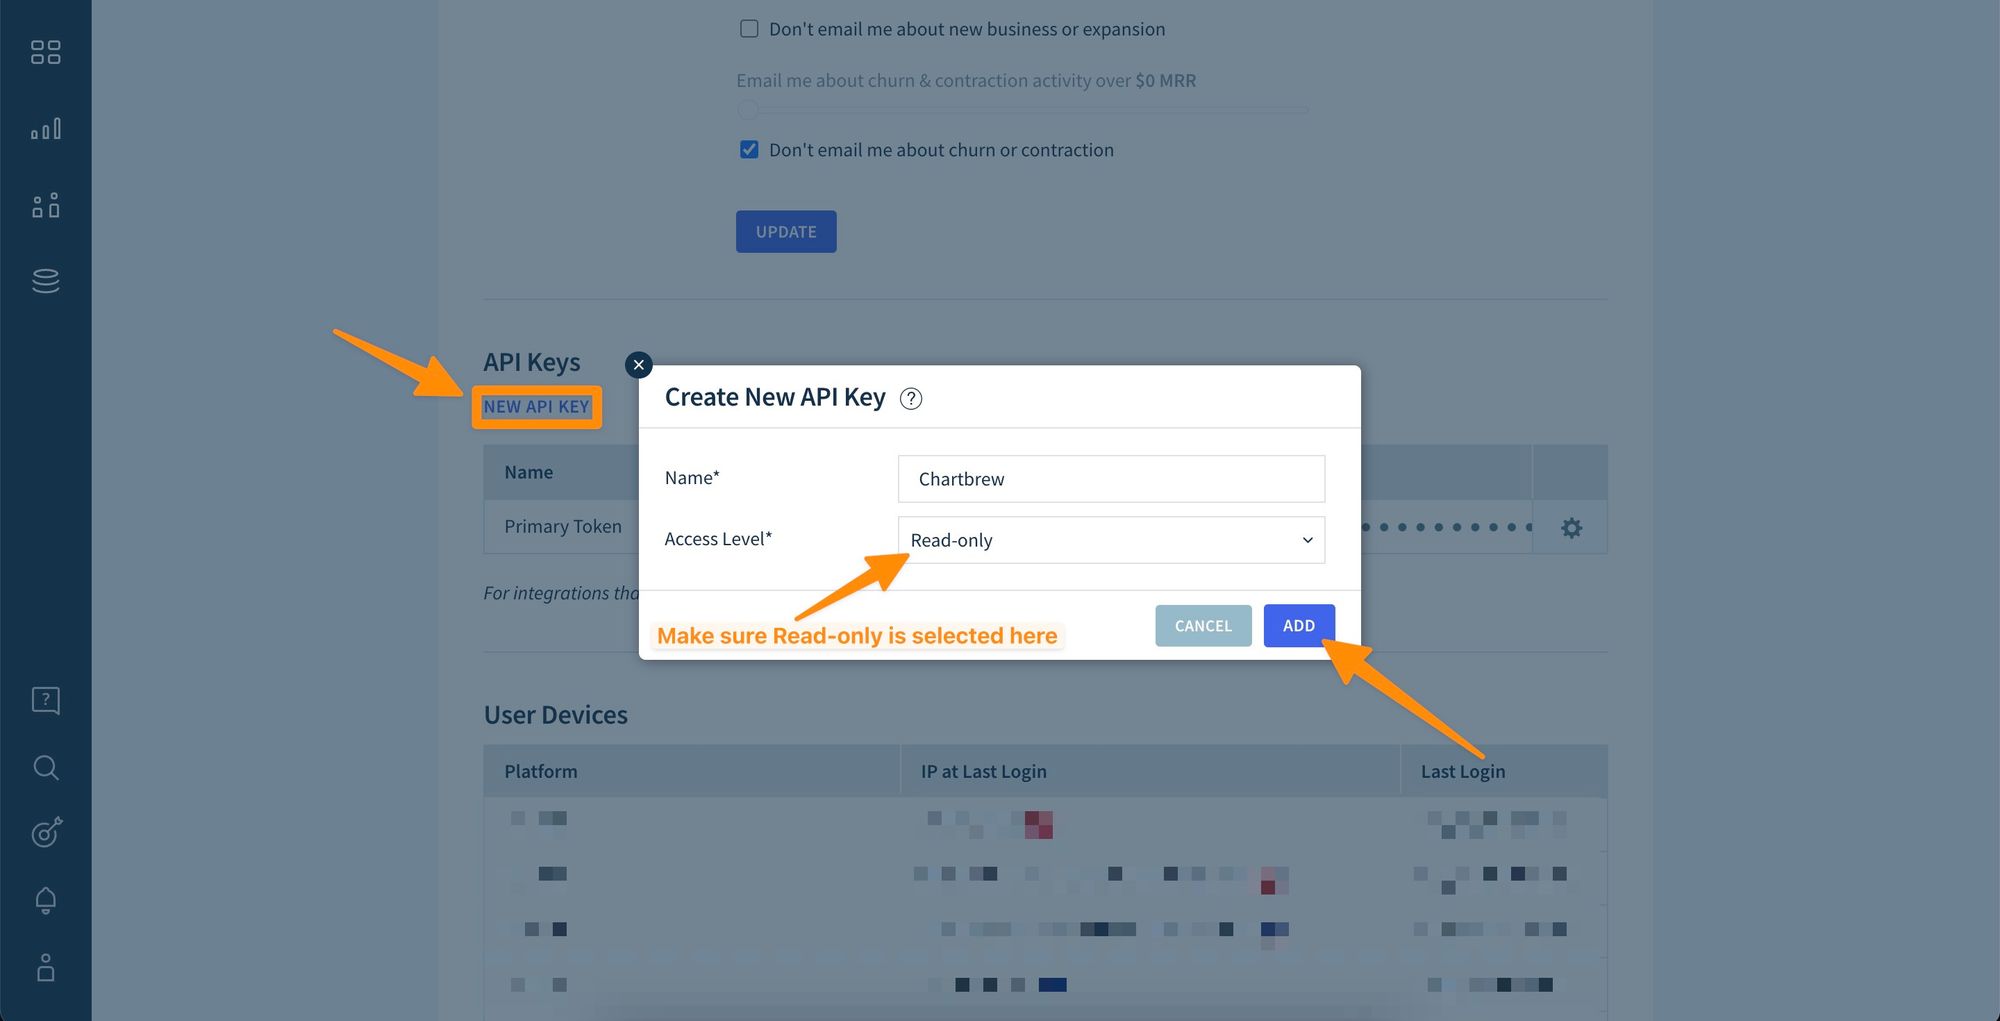
The template form will ask for an API key which we can generate from the ChartMogul dashboard. Head over to the user's admin page and select your user from the list.
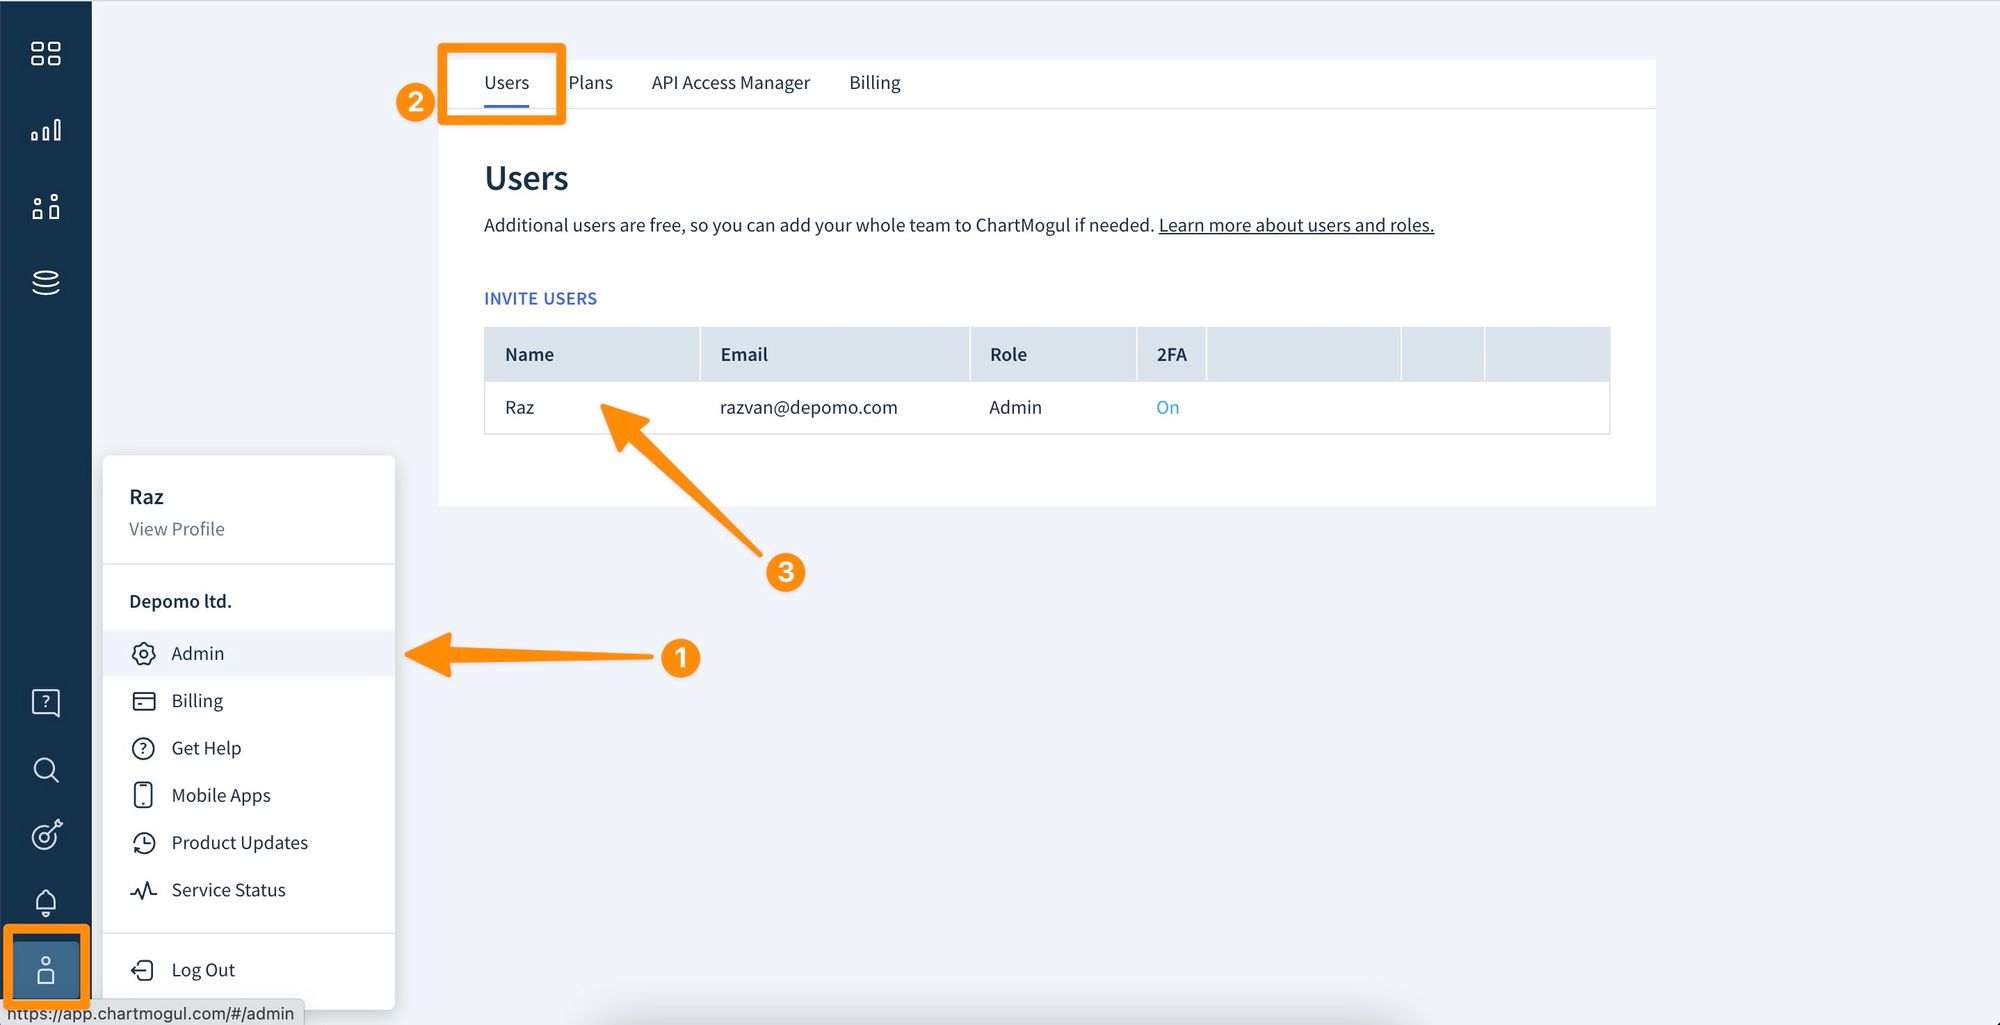
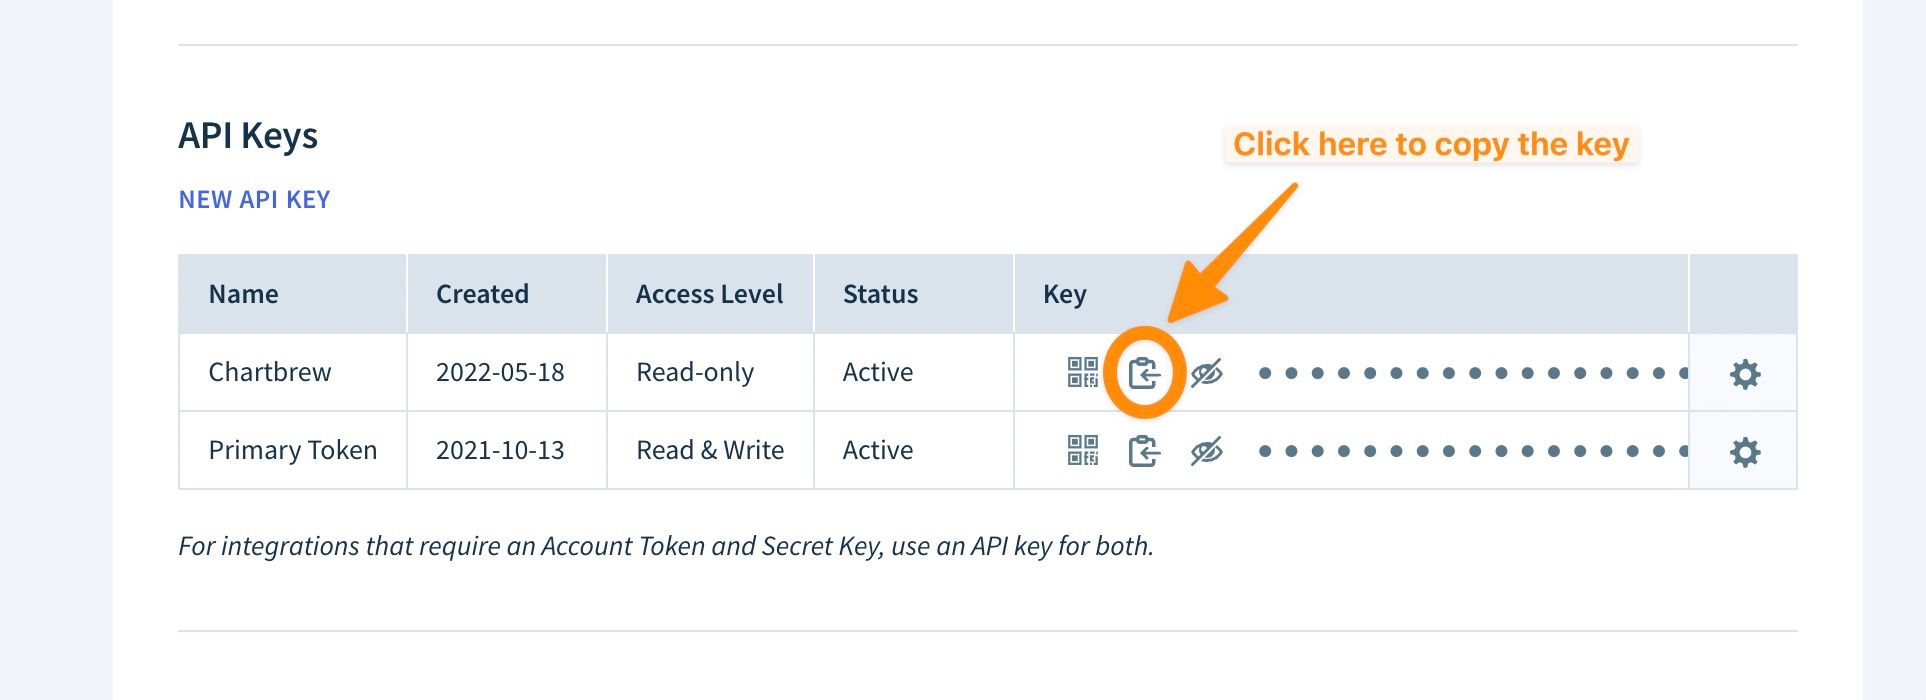
Once you click on the user in the list, you will see a new page with multiple configuration items available. We will only be interested in the API Keys section. Click on the New API Key button, name the key Chartbrew, and copy the code that is generated.
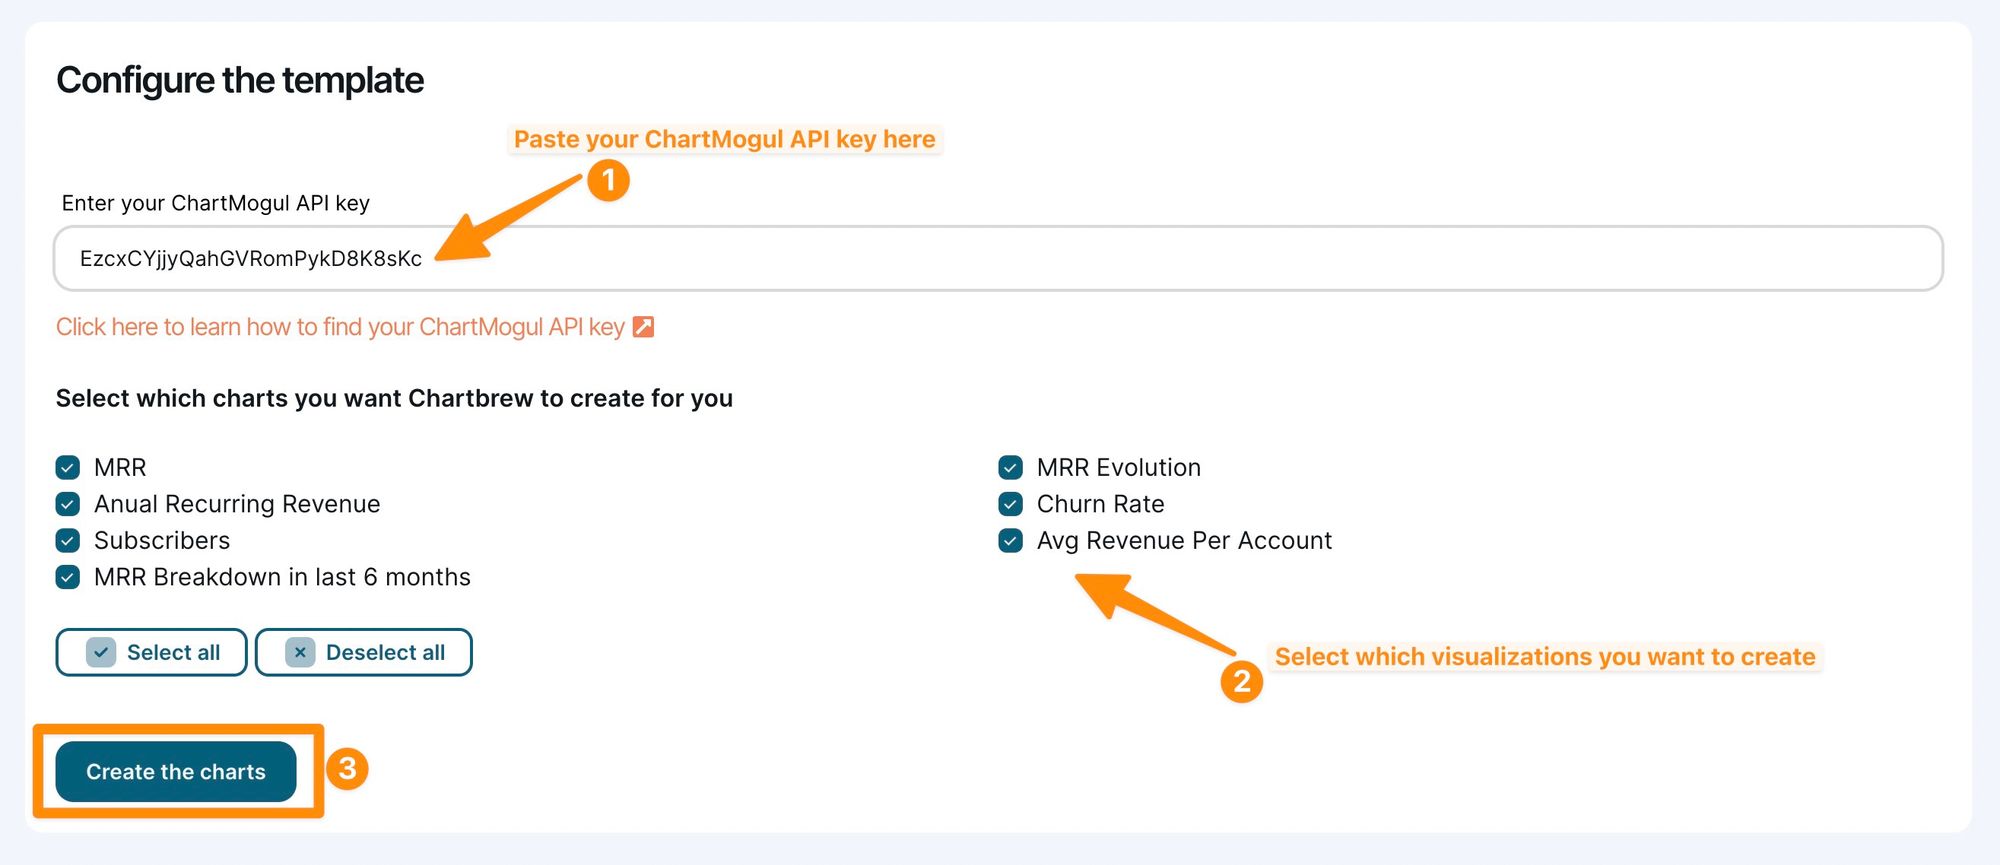
Now that we copied the key, we can return to Chartbrew and paste the key into the template form. Afterward, we can select which visualizations we want on the dashboard and press the Create button.
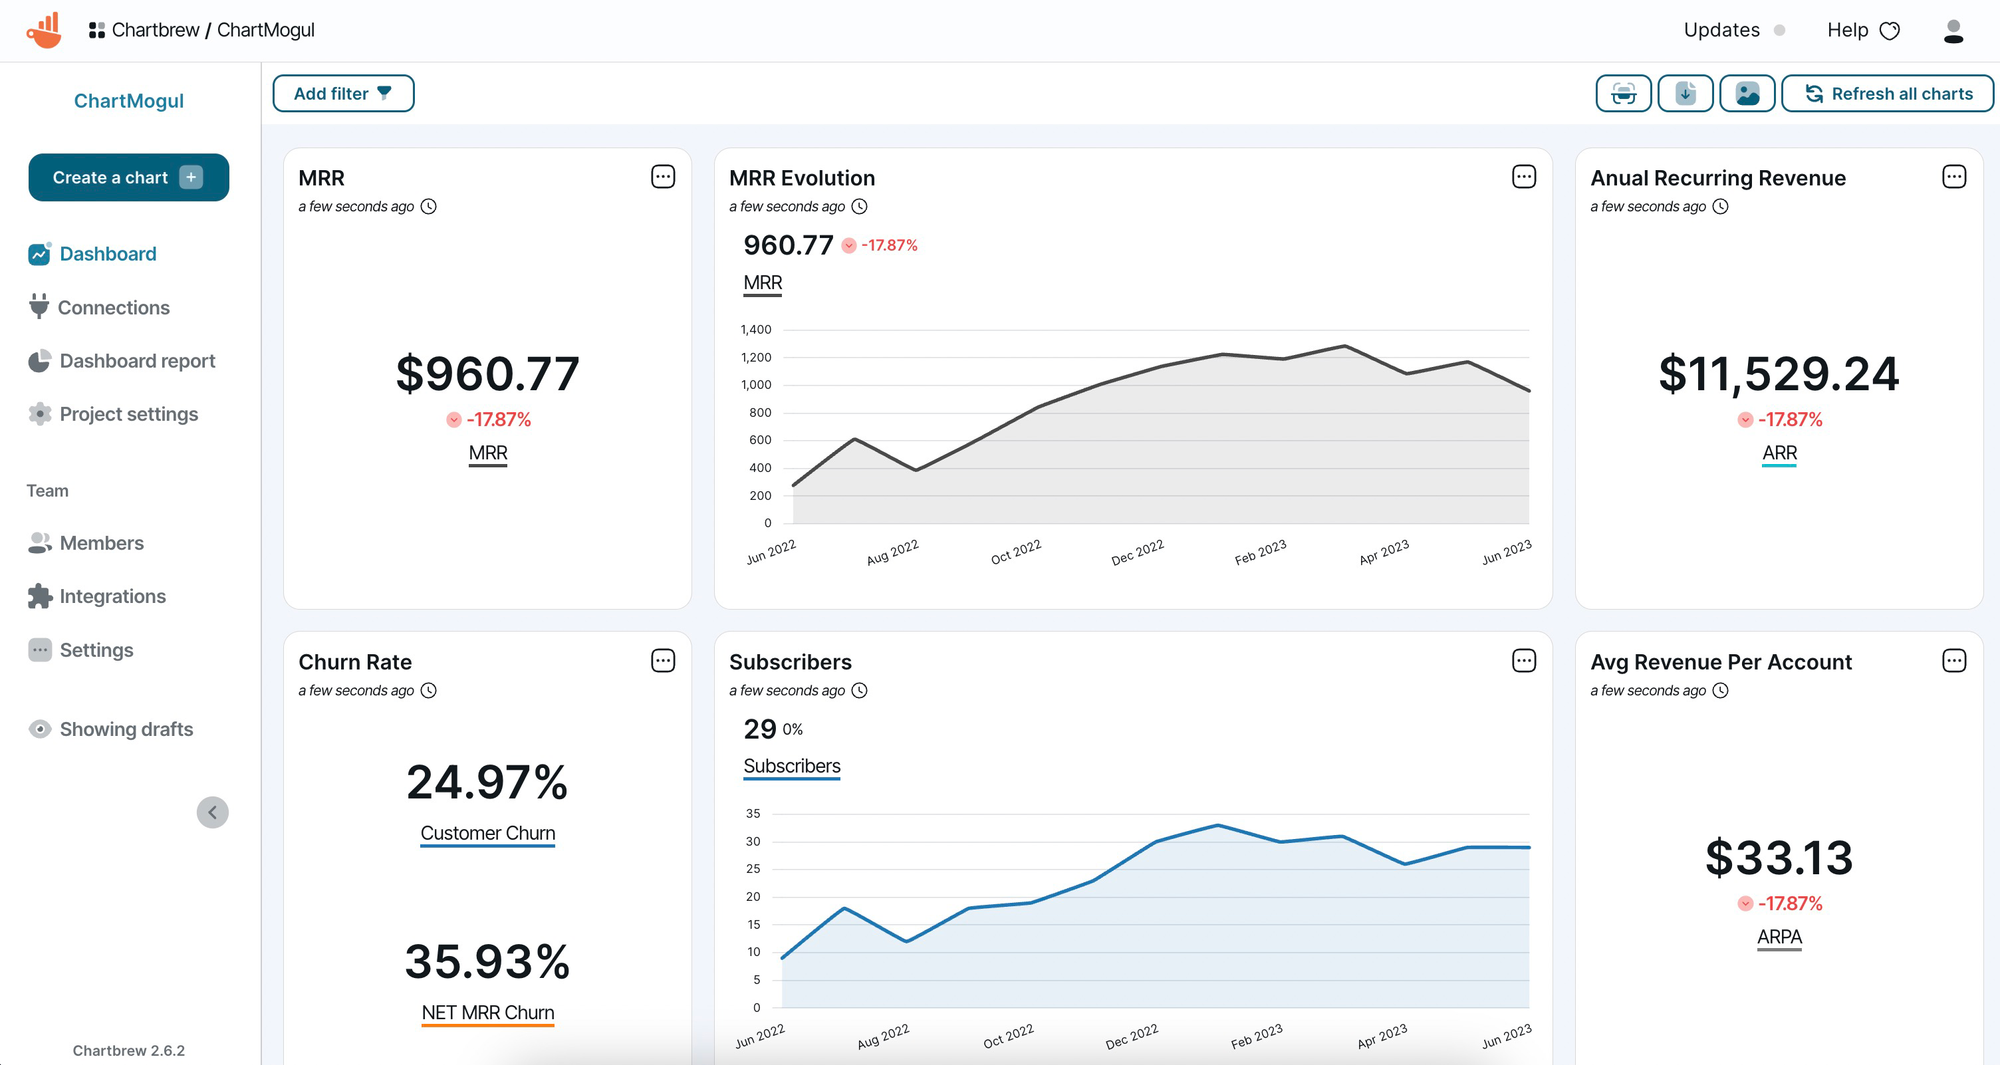
After a few seconds of loading, you will be re-directed to the dashboard view which has all the charts you selected from the list. If the charts are not rendered, please refresh the page.
Next steps
The power of Chartbrew comes with connecting multiple data sources on the same dashboard. Now that you connected to ChartMogul and created some charts, try connecting to your other data sources. You might want to pull product data from your database, or visitor data from Google or Simple Analytics. Check the connections page in your Chartbrew dashboard for a list of integrations and templates made available for you.
Once you completed your dashboard, you can create and customize client reports that you can share with others or even embed on other websites.
